In the competitive financial services sector, S&P Global Inc. and Moody’s Corporation stand out as two powerhouse firms specializing in credit ratings, data analytics, and market intelligence. Both headquartered in New York City, they share a significant market overlap and demonstrate innovative approaches to risk assessment and financial data solutions. This comparison will help investors like you identify which company offers the most compelling opportunity for portfolio inclusion in 2026.

Table of contents
Companies Overview
I will begin the comparison between S&P Global Inc. and Moody’s Corporation by providing an overview of these two companies and their main differences.
S&P Global Inc. Overview
S&P Global Inc. delivers credit ratings, benchmarks, analytics, and workflow solutions across global capital, commodity, and automotive markets. It operates six divisions including S&P Global Ratings and S&P Dow Jones Indices, providing investors and institutions with data and insights to inform decision-making. Founded in 1860, the company is a leading player in financial data services with a market cap of 164B USD.
Moody’s Corporation Overview
Moody’s Corporation operates as a global risk assessment firm with two main segments: Moody’s Investors Service and Moody’s Analytics. It offers credit ratings and risk management products, serving clients worldwide with research, data, and analytical tools. Founded in 1900, Moody’s focuses on credit ratings dissemination and financial market risk solutions, holding a market cap of 95.7B USD as of 2026.
Key similarities and differences
Both S&P Global and Moody’s operate in financial services, specializing in credit ratings and analytics. S&P Global has a broader business scope with six divisions covering indices, commodities, and mobility data, while Moody’s concentrates on integrated risk assessment and analytics. S&P Global employs 42,350 people, significantly more than Moody’s 15,795, reflecting its wider operational reach. Both are headquartered in New York City and trade on the NYSE.
Income Statement Comparison
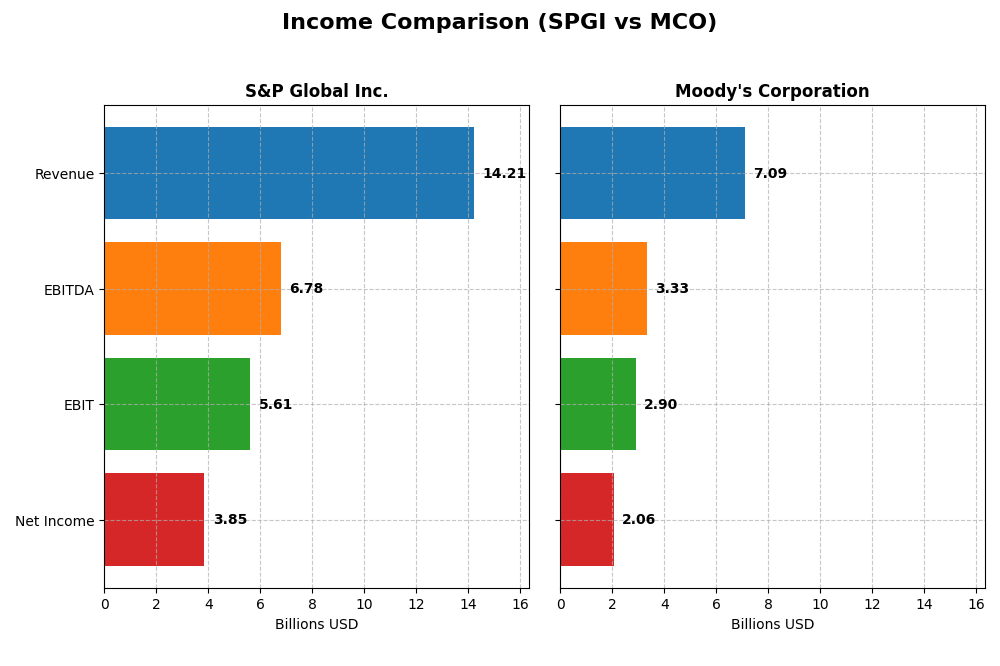
The table below compares key income statement metrics for S&P Global Inc. and Moody’s Corporation for the fiscal year 2024, providing a snapshot of their financial performance.
| Metric | S&P Global Inc. (SPGI) | Moody’s Corporation (MCO) |
|---|---|---|
| Market Cap | 164B | 96B |
| Revenue | 14.21B | 7.09B |
| EBITDA | 6.78B | 3.33B |
| EBIT | 5.61B | 2.90B |
| Net Income | 3.85B | 2.06B |
| EPS | 12.36 | 11.32 |
| Fiscal Year | 2024 | 2024 |
Income Statement Interpretations
S&P Global Inc.
S&P Global Inc. has shown a strong upward trend in revenue and net income from 2020 to 2024, with revenue nearly doubling to 14.2B and net income rising to 3.85B. Margins remain robust, with a gross margin of 69.1% and net margin around 27.1%, though net margin slightly contracted over the period. The latest year saw favorable revenue growth of 13.7% and a significant 29% increase in net margin.
Moody’s Corporation
Moody’s Corporation experienced steady revenue growth, reaching 7.1B in 2024, with net income also increasing to 2.06B. Gross and EBIT margins remain favorable at 66.4% and 41.0%, respectively, while net margin stands at 29.0%, slightly declining over the overall period. In 2024, Moody’s posted strong one-year revenue growth of 19.8% and net margin growth of nearly 7%, indicating solid profitability improvement.
Which one has the stronger fundamentals?
Both S&P Global and Moody’s demonstrate favorable income statement fundamentals with strong margins and growth in revenue and earnings. S&P Global’s larger scale and higher net income growth contrast with Moody’s higher one-year revenue growth and slightly better net margin. However, both companies face minor margin contractions over the long term, reflecting competitive pressures or cost dynamics in their sectors.
Financial Ratios Comparison
This table presents the key financial ratios of S&P Global Inc. and Moody’s Corporation for the fiscal year 2024, facilitating a side-by-side comparison of their recent financial performance.
| Ratios | S&P Global Inc. (SPGI) | Moody’s Corporation (MCO) |
|---|---|---|
| ROE | 11.62% | 57.73% |
| ROIC | 8.14% | 17.84% |
| P/E | 40.29 | 41.82 |
| P/B | 4.68 | 24.14 |
| Current Ratio | 0.85 | 1.43 |
| Quick Ratio | 0.85 | 1.43 |
| D/E | 0.36 | 2.17 |
| Debt-to-Assets | 19.82% | 49.96% |
| Interest Coverage | 18.79 | 14.56 |
| Asset Turnover | 0.24 | 0.46 |
| Fixed Asset Turnover | 20.96 | 8.13 |
| Payout Ratio | 29.44% | 30.13% |
| Dividend Yield | 0.73% | 0.72% |
Interpretation of the Ratios
S&P Global Inc.
S&P Global presents a mixed financial profile with favorable net margin and leverage ratios but unfavorable price multiples and liquidity measures. The return on equity and invested capital are neutral, indicating moderate efficiency. Dividend yield stands low at 0.73%, reflecting a modest payout, with coverage supported by free cash flow, though the current ratio below 1 signals potential short-term liquidity concerns.
Moody’s Corporation
Moody’s exhibits strong profitability and efficiency ratios, including a high ROE of 57.73% and solid returns on invested capital, but faces challenges in debt management with a high debt-to-equity ratio of 2.17. Its dividend yield is similar to S&P Global’s at 0.72%, with a neutral current ratio indicating balanced liquidity. Price multiples like P/E and P/B remain elevated, suggesting market premium concerns.
Which one has the best ratios?
Both companies have a balanced mix of favorable and unfavorable ratios, resulting in a neutral overall assessment. Moody’s shows stronger profitability and returns but carries higher financial leverage risks. S&P Global has better debt metrics and interest coverage but lower liquidity and valuation concerns. Neither stands out decisively as having the best ratios based solely on 2024 data.
Strategic Positioning
This section compares the strategic positioning of S&P Global Inc. (SPGI) and Moody’s Corporation (MCO) in terms of market position, key segments, and exposure to technological disruption:
S&P Global Inc. (SPGI)
- Leading global provider in financial data and analytics with diverse divisions; faces substantial competitive pressure.
- Operates six segments including Ratings, Market Intelligence, Indices, Commodity Insights, Mobility, and Engineering Solutions.
- Exposure includes data and workflow technology solutions; innovation focused on analytics and engineering workflows.
Moody’s Corporation (MCO)
- Integrated risk assessment firm with strong credit ratings presence; competitive in credit and analytics markets.
- Focuses on two segments: Moody’s Investors Service (credit ratings) and Moody’s Analytics (risk management products).
- Exposure through subscription-based analytics and software risk management solutions; less segment diversification.
S&P Global Inc. vs Moody’s Corporation Positioning
SPGI pursues a diversified strategy with multiple business lines, broadening revenue sources but increasing complexity. MCO concentrates on two main segments, enabling focused expertise but with less diversification. SPGI’s broader footprint may offer resilience; MCO’s focus may allow specialization advantages.
Which has the best competitive advantage?
Based on MOAT evaluation, MCO holds a slightly favorable moat with value creation despite declining profitability. SPGI shows a very unfavorable moat with value destruction and declining ROIC, indicating weaker competitive advantage over the period.
Stock Comparison
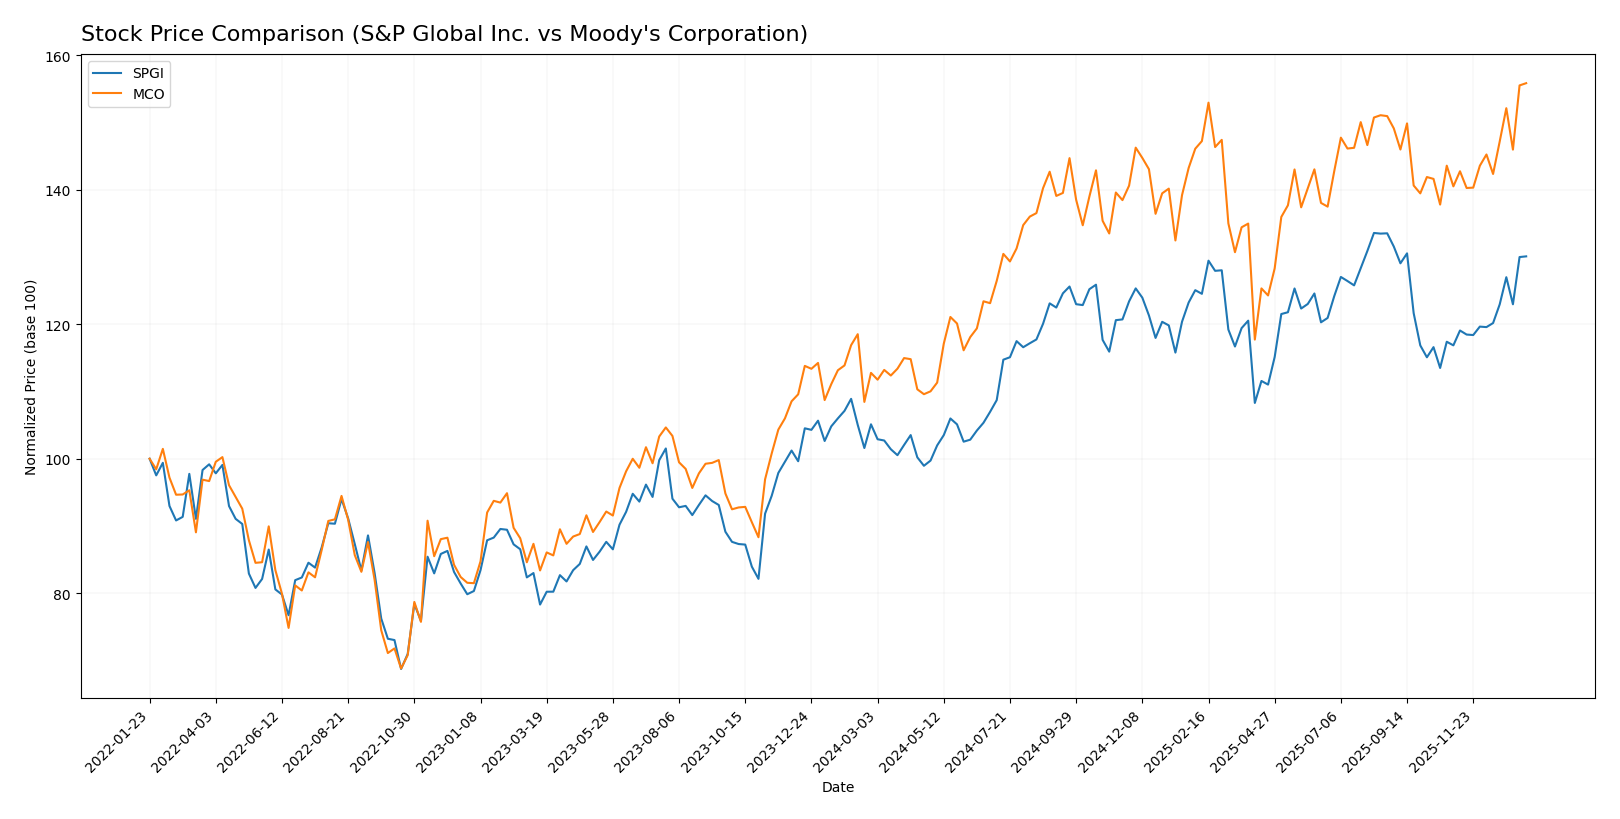
The stock prices of S&P Global Inc. and Moody’s Corporation have exhibited strong bullish momentum over the past 12 months, with notable acceleration in their upward trends and significant price appreciation.
Trend Analysis
S&P Global Inc. recorded a 23.75% price increase over the past year, indicating a bullish trend with accelerating momentum, ranging between $412.56 and $556.87. Recent months show continued positive slope and moderate volatility.
Moody’s Corporation experienced a 38.19% price gain over the same period, also reflecting a bullish trend with accelerating growth. Its price fluctuated between $374.67 and $532.75, accompanied by slightly higher volatility than S&P Global.
Comparing both, Moody’s Corporation delivered the highest market performance with a 38.19% rise, outperforming S&P Global’s 23.75% increase in the last 12 months.
Target Prices
The consensus target prices from verified analysts indicate positive upside potential for both S&P Global Inc. and Moody’s Corporation.
| Company | Target High | Target Low | Consensus |
|---|---|---|---|
| S&P Global Inc. | 643 | 540 | 603.5 |
| Moody’s Corporation | 620 | 507 | 557.44 |
Analysts expect S&P Global’s stock to appreciate moderately above its current price of 542.02 USD, while Moody’s shows upside potential from its current 532.18 USD, reflecting generally bullish sentiment.
Analyst Opinions Comparison
This section compares analysts’ ratings and grades for S&P Global Inc. and Moody’s Corporation:
Rating Comparison
S&P Global Inc. Rating
- Rating: B+, considered very favorable by analysts.
- Discounted Cash Flow Score: 4, indicating favorable.
- ROE Score: 4, favorable efficiency in equity use.
- ROA Score: 5, very favorable asset utilization.
- Debt To Equity Score: 3, moderate financial risk.
- Overall Score: 3, moderate overall financial standing.
Moody’s Corporation Rating
- Rating: B, also considered very favorable by analysts.
- Discounted Cash Flow Score: 3, indicating moderate rating.
- ROE Score: 5, very favorable, showing strong profit use.
- ROA Score: 5, very favorable asset utilization.
- Debt To Equity Score: 1, very unfavorable due to high risk.
- Overall Score: 3, moderate overall financial standing.
Which one is the best rated?
Based strictly on the data, S&P Global holds a slightly better overall rating (B+) with favorable discounted cash flow and moderate debt risk. Moody’s shows superior ROE but a significantly weaker debt-to-equity score. Both have moderate overall scores.
Scores Comparison
Here is the comparison of key financial scores for S&P Global Inc. and Moody’s Corporation:
SPGI Scores
- Altman Z-Score: 5.60, indicating a safe zone status
- Piotroski Score: 9, reflecting very strong financial health
MCO Scores
- Altman Z-Score: 7.47, indicating a safe zone status
- Piotroski Score: 8, reflecting very strong financial health
Which company has the best scores?
Moody’s has a higher Altman Z-Score at 7.47 compared to S&P Global’s 5.60, both in the safe zone. S&P Global has a slightly stronger Piotroski Score of 9 versus 8 for Moody’s. Scores show both companies have strong financial stability.
Grades Comparison
Here is a comparison of the latest available grades from recognized grading companies for both S&P Global Inc. and Moody’s Corporation:
S&P Global Inc. Grades
The following table presents recent grades assigned to S&P Global Inc. by established grading firms.
| Grading Company | Action | New Grade | Date |
|---|---|---|---|
| Evercore ISI Group | Maintain | Outperform | 2026-01-08 |
| JP Morgan | Maintain | Overweight | 2025-10-31 |
| Stifel | Maintain | Buy | 2025-10-31 |
| Evercore ISI Group | Maintain | Outperform | 2025-10-31 |
| Mizuho | Maintain | Outperform | 2025-10-16 |
| BMO Capital | Maintain | Outperform | 2025-10-16 |
| Evercore ISI Group | Maintain | Outperform | 2025-10-14 |
| Morgan Stanley | Maintain | Overweight | 2025-10-09 |
| Wells Fargo | Maintain | Overweight | 2025-09-19 |
| Citigroup | Maintain | Buy | 2025-09-15 |
Overall, S&P Global Inc. shows a consistent pattern of strong positive grades, predominantly “Outperform,” “Buy,” and “Overweight,” with no downgrades reported.
Moody’s Corporation Grades
The following table displays recent grades assigned to Moody’s Corporation by reputable grading firms.
| Grading Company | Action | New Grade | Date |
|---|---|---|---|
| Evercore ISI Group | Maintain | Outperform | 2026-01-08 |
| Stifel | Upgrade | Buy | 2026-01-05 |
| Goldman Sachs | Upgrade | Buy | 2025-12-16 |
| Mizuho | Maintain | Neutral | 2025-10-28 |
| Stifel | Maintain | Hold | 2025-10-23 |
| JP Morgan | Maintain | Overweight | 2025-10-23 |
| Wells Fargo | Maintain | Overweight | 2025-10-23 |
| BMO Capital | Maintain | Market Perform | 2025-10-23 |
| Raymond James | Upgrade | Market Perform | 2025-10-17 |
| BMO Capital | Maintain | Market Perform | 2025-10-16 |
Moody’s Corporation exhibits a mix of grades, ranging from “Buy” and “Outperform” upgrades to “Neutral,” “Hold,” and “Market Perform,” indicating a more varied consensus.
Which company has the best grades?
S&P Global Inc. has received more uniformly positive grades, mainly “Outperform” and “Buy,” compared to Moody’s Corporation’s broader range including several “Hold” and “Market Perform” ratings. This suggests S&P Global’s outlook is more favorably viewed by analysts, potentially implying higher confidence among investors in its near-term performance.
Strengths and Weaknesses
Below is a comparison table of key strengths and weaknesses for S&P Global Inc. (SPGI) and Moody’s Corporation (MCO) based on the most recent financial data and operational metrics.
| Criterion | S&P Global Inc. (SPGI) | Moody’s Corporation (MCO) |
|---|---|---|
| Diversification | High diversification across five segments including Market Intelligence (4.65B) and Ratings (4.37B) | Moderate diversification with two main segments: Moody’s Analytics (4.41B) and Moody’s Investors Service (2.68B) |
| Profitability | Net margin 27.11% (favorable), ROIC 8.14% (neutral), but ROIC < WACC indicating value destruction | Net margin 29.03%, ROIC 17.84% (both favorable), ROIC > WACC showing value creation |
| Innovation | Moderate innovation with new segments like Mobility, but declining ROIC trend (-74%) signals challenges | Innovation steady but ROIC slightly declining (-6%), overall still creating value |
| Global presence | Strong global presence supported by multiple business lines and markets | Strong global presence, with steady revenue growth in core segments |
| Market Share | Leading market share in indices and ratings segments, but facing profitability pressure | Strong market share in credit ratings and analytics, with higher profitability margins |
Key takeaway: Moody’s Corporation shows stronger profitability and value creation despite a slight decline in ROIC, while S&P Global, although well diversified, is currently experiencing declining profitability and value destruction. Investors should weigh Moody’s superior ROIC and profitability against S&P’s broader business scope and global footprint.
Risk Analysis
Below is a comparative overview of key risks for S&P Global Inc. (SPGI) and Moody’s Corporation (MCO) based on their latest financial and operational data from 2024.
| Metric | S&P Global Inc. (SPGI) | Moody’s Corporation (MCO) |
|---|---|---|
| Market Risk | Beta 1.21 indicating moderate volatility; PE ratio high at 40.29, suggesting potential overvaluation risk. | Beta 1.45 showing higher volatility; PE ratio 41.82, also indicating possible overvaluation. |
| Debt Level | Low debt-to-equity ratio (0.36) and debt-to-assets at 19.8%, with strong interest coverage (18.87x). | Higher debt-to-equity (2.17) and moderate debt-to-assets (49.96%), with interest coverage of 14.23x, signaling elevated leverage risk. |
| Regulatory Risk | Moderate, given global financial services exposure and reliance on credit ratings and indices. | Moderate, with international credit rating operations subject to evolving regulations across 140 countries. |
| Operational Risk | Diversified divisions reduce concentration risk, but complex global operations present execution challenges. | Concentrated in credit rating and analytics, reliant on data accuracy and technology platforms. |
| Environmental Risk | Limited direct exposure; some risk from sustainability data services and ESG reporting trends. | Similar limited direct impact; growing importance of ESG analytics poses both opportunity and risk. |
| Geopolitical Risk | Exposure to global markets; political instability could affect data access and client operations. | High global footprint with sovereign ratings and public finance exposure, sensitive to geopolitical shifts. |
S&P Global’s moderate market risk and low leverage make it relatively resilient, but its high valuation demands cautious entry. Moody’s higher leverage and greater market volatility pose increased financial risk despite robust profitability. Geopolitical and regulatory risks remain meaningful for both due to their global roles in financial data and credit ratings.
Which Stock to Choose?
S&P Global Inc. (SPGI) shows a favorable income evolution with strong revenue and profit growth, supported by mostly favorable financial ratios, moderate profitability, and low debt levels. Its rating is very favorable with a B+ score, despite some unfavorable valuation metrics.
Moody’s Corporation (MCO) presents a solid income growth trend, with favorable profitability and financial ratios, though it carries higher debt. Its rating is also very favorable with a B score, balanced by strong returns but less attractive valuation multiples.
For investors prioritizing stable income growth and moderate debt, SPGI might appear more suitable, while those favoring higher returns despite elevated leverage could find MCO more appealing. The overall neutral ratings and income evaluations suggest careful consideration aligned with individual risk tolerance and investment strategy.
Disclaimer: Investment carries a risk of loss of initial capital. The past performance is not a reliable indicator of future results. Be sure to understand risks before making an investment decision.
Go Further
I encourage you to read the complete analyses of S&P Global Inc. and Moody’s Corporation to enhance your investment decisions: