Home > Comparison > Financial Services > MCO vs NDAQ
The strategic rivalry between Moody’s Corporation and Nasdaq, Inc. defines the current trajectory of the financial data and stock exchange sector. Moody’s operates as an integrated risk assessment firm with strong credit rating and analytics services. Nasdaq, in contrast, is a technology-driven market operator with a focus on trading platforms and anti-financial crime solutions. This analysis will determine which company’s strategic model offers the superior risk-adjusted return for a diversified portfolio in 2026.

Table of contents
Companies Overview
Moody’s Corporation and Nasdaq, Inc. both hold pivotal roles in the global financial data and stock exchange landscape.
Moody’s Corporation: Global Risk Assessment Powerhouse
Moody’s dominates as an integrated risk assessment firm, generating revenue mainly through credit ratings and risk analytics. Its core strength lies in Moody’s Investors Service and Moody’s Analytics, which provide credit ratings, research, and risk management tools worldwide. In 2026, Moody’s strategic focus remains on expanding its analytical product suite to deepen client dependency on its credit assessment expertise.
Nasdaq, Inc.: Market Technology and Exchange Innovator
Nasdaq operates primarily as a technology-driven capital markets company, earning revenue from market technology solutions, listing services, and trading platforms. Its offerings include SaaS anti-financial crime tools and extensive exchange services across multiple asset classes. Nasdaq’s 2026 strategy emphasizes growth in market technology innovation and expanding its platform ecosystem to capture broader market share.
Strategic Collision: Similarities & Divergences
Both firms excel in financial services but differ fundamentally in approach. Moody’s builds a closed ecosystem focused on credit insights and risk analytics, while Nasdaq pursues an open infrastructure model centered on market technology and exchange services. The primary battleground is data and technology-driven market intelligence. Moody’s offers deep analytical rigor, whereas Nasdaq leverages platform scale and innovation, creating distinct investment profiles anchored in complementary financial ecosystems.
Income Statement Comparison
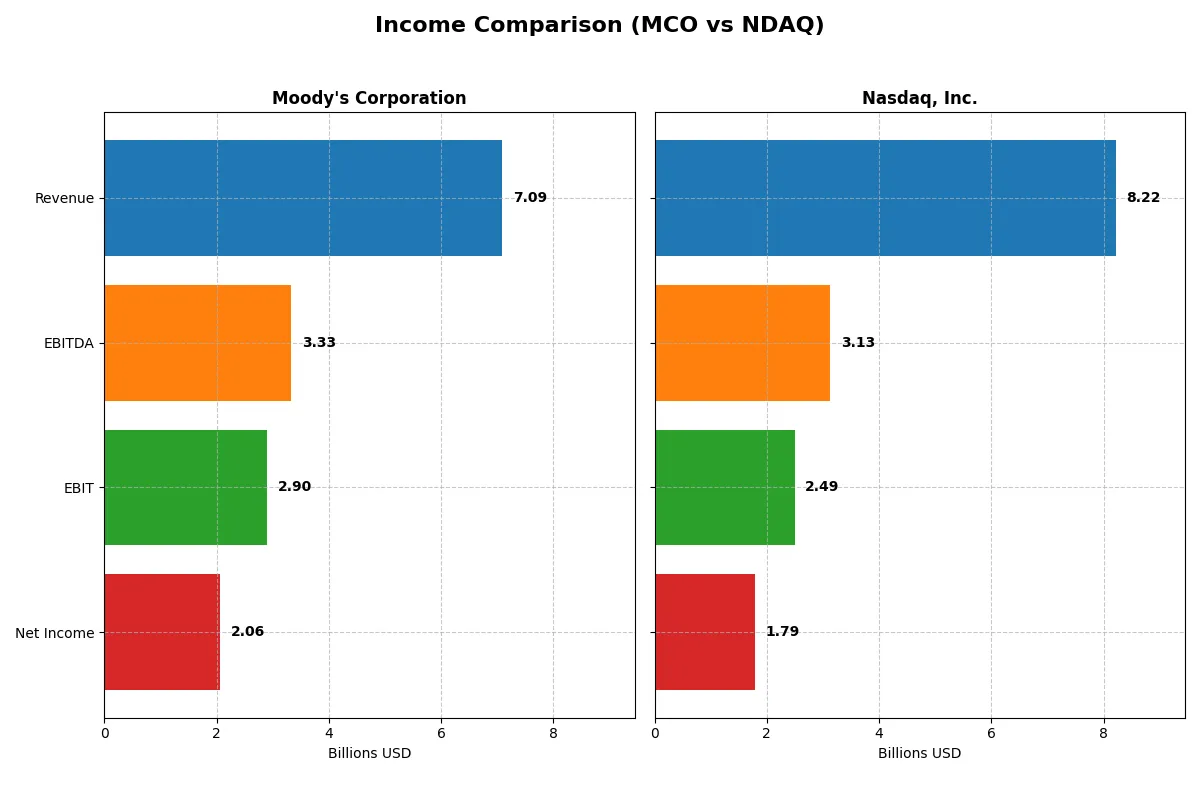
The table below dissects the core profitability and scalability of both corporate engines to reveal who dominates the bottom line:
| Metric | Moody’s Corporation (MCO) | Nasdaq, Inc. (NDAQ) |
|---|---|---|
| Revenue | 7.1B | 7.4B |
| Cost of Revenue | 2.4B | 4.4B |
| Operating Expenses | 1.7B | 1.2B |
| Gross Profit | 4.7B | 3.0B |
| EBITDA | 3.3B | 2.5B |
| EBIT | 2.9B | 1.8B |
| Interest Expense | 204M | 0 |
| Net Income | 2.1B | 1.1B |
| EPS | 11.32 | 1.94 |
| Fiscal Year | 2024 | 2024 |
Income Statement Analysis: The Bottom-Line Duel
This income statement comparison reveals which company runs a more efficient and profitable corporate engine through recent financial performance.
Moody’s Corporation Analysis
Moody’s revenue rose steadily from $5.37B in 2020 to $7.09B in 2024, with net income climbing from $1.78B to $2.06B. The company maintains a robust gross margin of 66.4% and a net margin near 29%, reflecting strong cost control and operational efficiency. In 2024, Moody’s accelerated EBIT growth by 35.5%, signaling improving profitability momentum.
Nasdaq, Inc. Analysis
Nasdaq’s revenue expanded from $5.89B in 2021 to $8.22B in 2025, with net income increasing from $1.19B to $1.79B. Despite a lower gross margin at 47.9%, Nasdaq’s net margin improved to 21.8%, driven by disciplined expense management. The latest year showed a sharp 44.2% net margin growth and a striking 60.1% EPS increase, highlighting strong earnings leverage.
Margin Strength vs. Earnings Momentum
Moody’s leads with superior gross and net margins, showcasing consistent operational efficiency and cost discipline. Nasdaq outpaces in bottom-line growth rates and EPS momentum, reflecting aggressive expansion and margin improvement. Moody’s stable high margins appeal to investors favoring reliability, while Nasdaq’s accelerating earnings growth attracts those seeking dynamic profit expansion.
Financial Ratios Comparison
These vital ratios act as a diagnostic tool to expose the underlying fiscal health, valuation premiums, and capital efficiency of the companies compared below:
| Ratios | Moody’s Corporation (MCO) | Nasdaq, Inc. (NDAQ) |
|---|---|---|
| ROE | 57.7% | 14.6% (2025) |
| ROIC | 17.8% | -26.9% (2025) |
| P/E | 41.8 | 31.1 (2025) |
| P/B | 24.1 | 4.55 (2025) |
| Current Ratio | 1.43 | 0.99 (2024) |
| Quick Ratio | 1.43 | 0.99 (2024) |
| D/E | 2.17 | 0.81 (2025) |
| Debt-to-Assets | 50.0% | 32.0% (2025) |
| Interest Coverage | 14.6 | -6.63 (2025) |
| Asset Turnover | 0.46 | 0.26 (2025) |
| Fixed Asset Turnover | 8.13 | 6.99 (2025) |
| Payout ratio | 30.1% | 33.7% (2025) |
| Dividend yield | 0.72% | 1.08% (2025) |
| Fiscal Year | 2024 | 2025 |
Efficiency & Valuation Duel: The Vital Signs
Ratios serve as a company’s DNA, unveiling hidden risks and operational strengths that raw numbers alone cannot reveal.
Moody’s Corporation
Moody’s shows compelling profitability with a robust 57.7% ROE and a strong 29% net margin, signaling excellent operational efficiency. However, its valuation appears stretched, with a high P/E of 41.8 and a P/B of 24.1, suggesting premium pricing. Dividend yield is modest at 0.72%, reflecting cautious shareholder returns.
Nasdaq, Inc.
Nasdaq posts a moderate 14.6% ROE and a solid 21.8% net margin, indicating reasonable profitability. Its valuation is also elevated with a P/E near 31.1 and a P/B of 4.55, though less stretched than Moody’s. Dividend yield at 1.08% offers a more balanced return, offset by concerns over negative ROIC.
Premium Valuation vs. Operational Safety
Moody’s delivers superior profitability but at a high valuation premium, raising risk. Nasdaq trades cheaper with steadier dividends but shows weaker capital returns and operational risks. Investors prioritizing growth might prefer Moody’s; those favoring income and stability may lean toward Nasdaq.
Which one offers the Superior Shareholder Reward?
I compare Moody’s (MCO) and Nasdaq (NDAQ) distribution models. Moody’s yields ~0.72% with a 30% payout ratio, well-covered by strong FCF (13.9/share). Moody’s complements dividends with consistent buybacks, supporting robust TSR. Nasdaq offers a higher yield near 1.08% but pays out ~34%, with lower FCF per share and modest buybacks. Moody’s higher margins and sustainable capital allocation suggest superior long-term shareholder reward. I favor Moody’s total return profile in 2026 due to balanced dividends, aggressive buybacks, and resilient free cash flow generation.
Comparative Score Analysis: The Strategic Profile
The radar chart reveals the fundamental DNA and trade-offs of Moody’s Corporation and Nasdaq, Inc., highlighting each firm’s financial strengths and vulnerabilities:
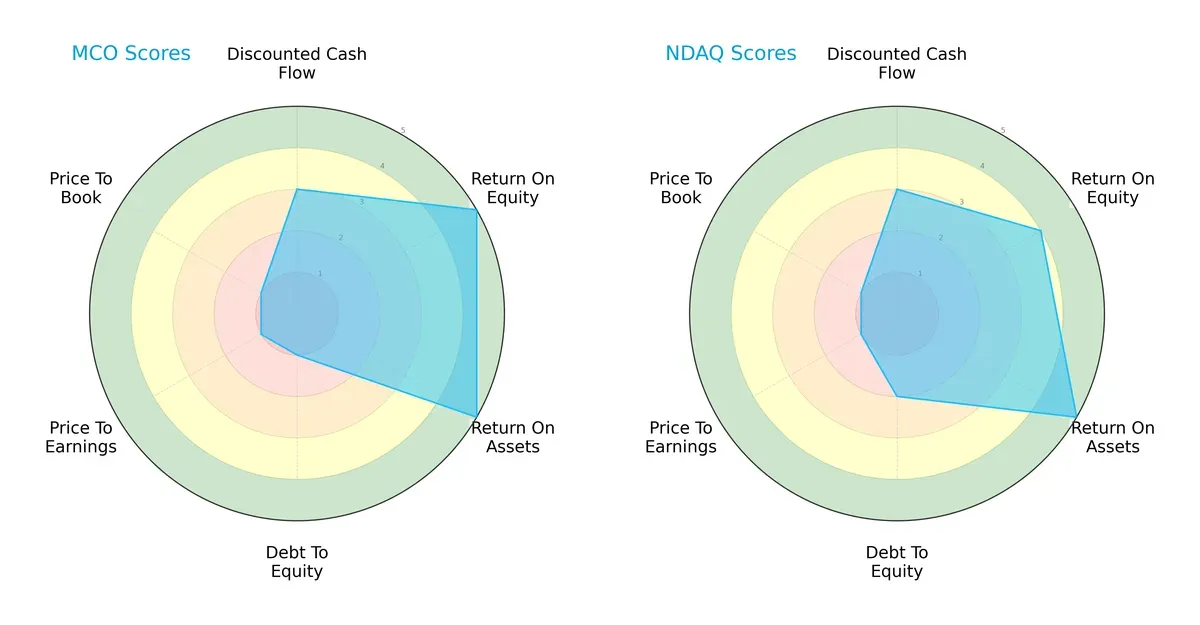
Moody’s excels in profitability with top ROE and ROA scores (5 each), but it struggles heavily with leverage and valuation, scoring very low (1) in Debt/Equity, P/E, and P/B. Nasdaq shows a more balanced profile, with moderately better Debt/Equity (2) and slightly lower ROE (4) but matching ROA (5). Both face valuation headwinds, yet Nasdaq’s stronger balance sheet reduces financial risk compared to Moody’s concentrated reliance on operational efficiency.
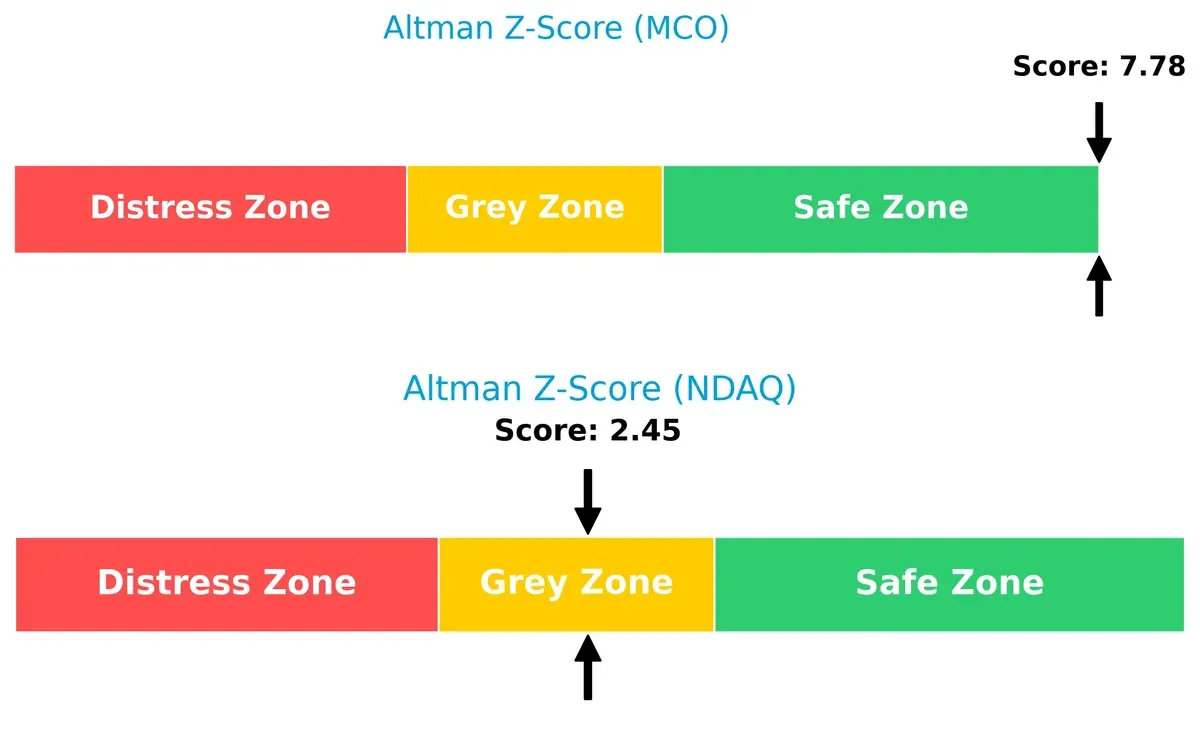
Bankruptcy Risk: Solvency Showdown
Moody’s Altman Z-Score of 7.78 places it firmly in the safe zone, while Nasdaq’s 2.45 signals moderate bankruptcy risk in the grey zone, indicating divergent long-term survival outlooks:
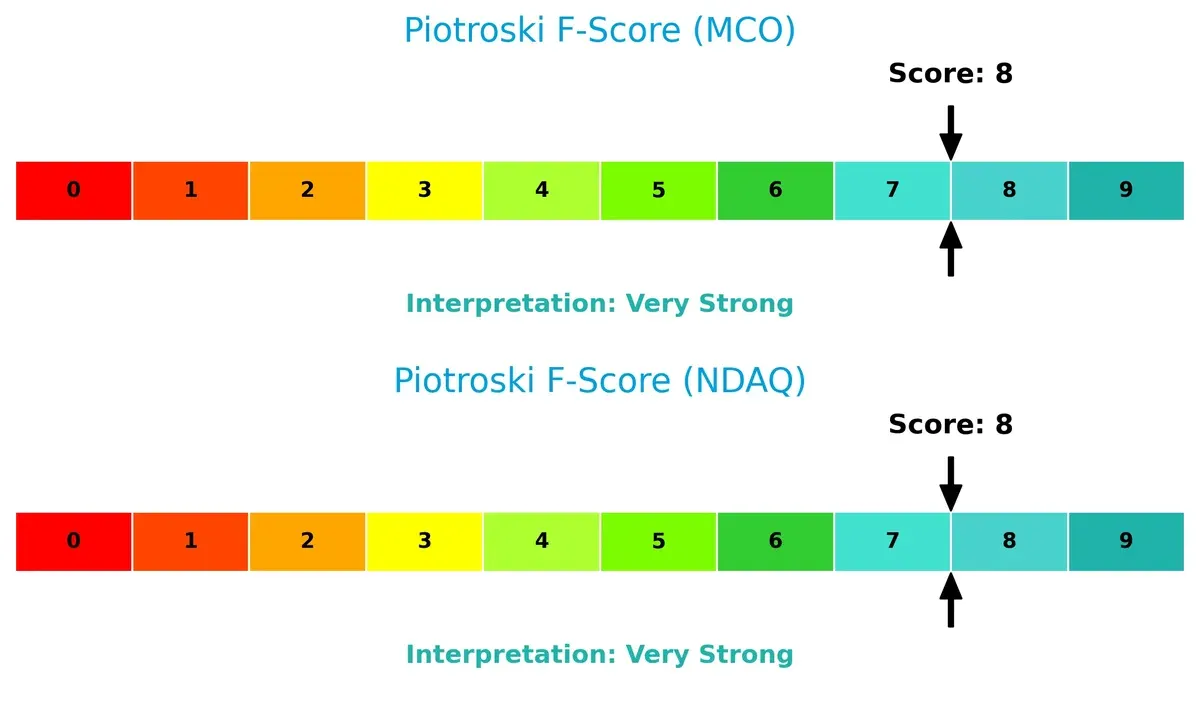
Financial Health: Quality of Operations
Both companies score an impressive 8 on the Piotroski F-Score, reflecting very strong financial health and operational quality, with no apparent red flags in internal metrics:
How are the two companies positioned?
This section dissects the operational DNA of Moody’s and Nasdaq by comparing their revenue distribution and internal strengths and weaknesses. The goal is to confront their economic moats and determine which offers the most resilient competitive advantage today.
Revenue Segmentation: The Strategic Mix
This comparison dissects how Moody’s Corporation and Nasdaq, Inc. diversify their income streams and reveals where each firm anchors its primary sector bets:

Moody’s divides revenue mainly between Moody’s Analytics at $4.41B and Moody’s Investors Service at $2.68B, showing a two-pronged but concentrated approach. Nasdaq commands a more diversified structure with Market Services leading at $3.77B, followed by Capital Access Platforms at $1.97B and Market Technology at $1.62B. Nasdaq’s broader mix reduces concentration risk, while Moody’s reliance on analytics and investor services suggests deep ecosystem lock-in and specialized market dominance.
Strengths and Weaknesses Comparison
This table compares the Strengths and Weaknesses of Moody’s Corporation and Nasdaq, Inc.:
Moody’s Corporation Strengths
- High net margin at 29.03%
- Strong ROE of 57.73%
- Favorable ROIC of 17.84%
- Quick ratio of 1.43 indicates liquidity
- Diverse revenue streams from Analytics and Investors Service
- Significant international revenue across EMEA and Asia Pacific
Nasdaq, Inc. Strengths
- Favorable net margin at 21.76%
- Strong interest coverage ratio of 28.34
- Lower debt to equity ratio at 0.81
- Diverse product segments including Capital Access, Market Technology, and Market Services
- Substantial U.S. revenue base of 5.8B
- Favorable WACC at 7.81% supports capital efficiency
Moody’s Corporation Weaknesses
- High debt to equity ratio at 2.17 raises leverage concerns
- Asset turnover at 0.46 suggests lower efficiency
- Elevated PE and PB ratios signal expensive valuation
- Dividend yield low at 0.72%
- WACC higher than ROIC at 10.05%
- Neutral current ratio at 1.43 limits short-term liquidity buffer
Nasdaq, Inc. Weaknesses
- Negative ROIC at -26.92% indicates poor capital returns
- Zero current and quick ratios warn liquidity risks
- Elevated PE and PB ratios are unfavorable
- Asset turnover low at 0.26 weakens operational efficiency
- Dividend yield neutral at 1.08%
- Slightly unfavorable overall financial ratio profile
Moody’s stands out with high profitability and global diversification but carries significant leverage and valuation pressures. Nasdaq shows strong U.S. market presence and capital efficiency but faces liquidity issues and negative returns on invested capital, indicating challenges in operational effectiveness.
The Moat Duel: Analyzing Competitive Defensibility
A structural moat shields long-term profits from competitive erosion. Without it, market share and margins quickly erode:
Moody’s Corporation: Intangible Asset Moat Anchored in Credit Expertise
Moody’s leverages its vast credit rating franchise and proprietary data as an intangible asset moat. This sustains high ROIC near 8%, despite a slight decline. Expansion into analytics deepens its moat in 2026.
Nasdaq, Inc.: Market Ecosystem Moat Facing Profitability Challenges
Nasdaq’s moat relies on its listing platform and market technology ecosystem. However, its negative ROIC versus WACC signals value destruction. The company must innovate quickly to reverse this in 2026.
Verdict: Intangible Assets vs. Ecosystem Dynamics in Financial Data Services
Moody’s exhibits a wider, more durable moat through entrenched intangible assets and consistent value creation. Nasdaq’s shrinking ROIC reveals a fragile moat, less equipped to defend market share. Moody’s stands better poised to preserve profits long term.
Which stock offers better returns?
Over the past year, both Moody’s Corporation and Nasdaq, Inc. exhibited strong bullish momentum with accelerating price gains and notable highs, reflecting dynamic trading conditions.
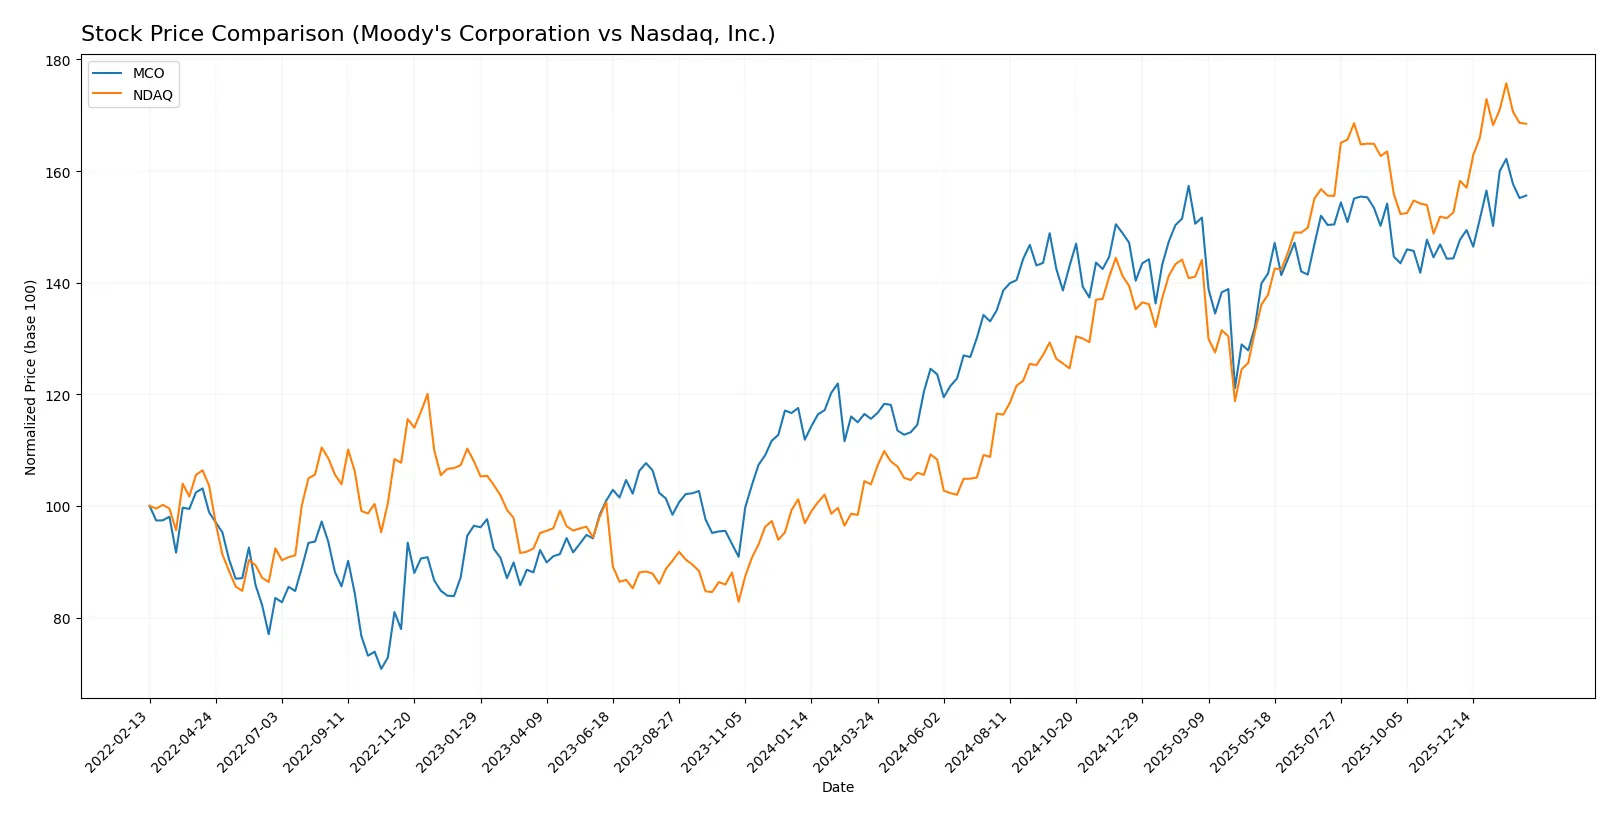
Trend Comparison
Moody’s Corporation (MCO) shows a 34.59% price increase over 12 months with accelerating bullish momentum. The stock’s volatility is high, reflected in a 39.49 standard deviation, peaking at 538.92.
Nasdaq, Inc. (NDAQ) outperformed with a 62.22% gain over the same period, also accelerating bullishly. It maintained lower volatility at 11.96 standard deviation, reaching a high of 100.98.
Nasdaq’s stock delivered the highest market performance versus Moody’s, combining stronger gains with steadier volatility and sustained buyer dominance.
Target Prices
Analysts present a moderately bullish consensus on Moody’s Corporation and Nasdaq, Inc., reflecting confidence in their financial services niches.
| Company | Target Low | Target High | Consensus |
|---|---|---|---|
| Moody’s Corporation | 507 | 620 | 561.3 |
| Nasdaq, Inc. | 100 | 120 | 111.8 |
Moody’s consensus target implies a 8.5% upside from the current 517.05 price, while Nasdaq’s consensus suggests a 15.5% potential gain from 96.81. Both stocks show room for appreciation.

Don’t Let Luck Decide Your Entry Point
Optimize your entry points with our advanced ProRealTime indicators. You’ll get efficient buy signals with precise price targets for maximum performance. Start outperforming now!
How do institutions grade them?
Moody’s Corporation Grades
The following table summarizes recent institutional grades for Moody’s Corporation.
| Grading Company | Action | New Grade | Date |
|---|---|---|---|
| Wells Fargo | Maintain | Overweight | 2026-01-14 |
| Morgan Stanley | Maintain | Equal Weight | 2026-01-13 |
| Daiwa Capital | Upgrade | Outperform | 2026-01-13 |
| Evercore ISI Group | Maintain | Outperform | 2026-01-08 |
| Stifel | Upgrade | Buy | 2026-01-05 |
| Goldman Sachs | Upgrade | Buy | 2025-12-16 |
| Mizuho | Maintain | Neutral | 2025-10-28 |
| Stifel | Maintain | Hold | 2025-10-23 |
| Wells Fargo | Maintain | Overweight | 2025-10-23 |
| JP Morgan | Maintain | Overweight | 2025-10-23 |
Nasdaq, Inc. Grades
The following table summarizes recent institutional grades for Nasdaq, Inc.
| Grading Company | Action | New Grade | Date |
|---|---|---|---|
| Barclays | Maintain | Overweight | 2026-01-30 |
| RBC Capital | Maintain | Outperform | 2026-01-30 |
| JP Morgan | Maintain | Overweight | 2026-01-30 |
| TD Cowen | Maintain | Hold | 2026-01-30 |
| Morgan Stanley | Maintain | Overweight | 2026-01-30 |
| Morgan Stanley | Maintain | Overweight | 2026-01-15 |
| TD Cowen | Maintain | Hold | 2026-01-14 |
| UBS | Maintain | Buy | 2026-01-12 |
| JP Morgan | Maintain | Overweight | 2026-01-12 |
| Barclays | Maintain | Overweight | 2026-01-08 |
Which company has the best grades?
Moody’s Corporation features multiple upgrades to Buy and Outperform grades, signaling growing institutional confidence. Nasdaq, Inc. maintains predominantly Overweight and Outperform ratings but shows fewer upgrades. Investors may interpret Moody’s recent upgrades as a stronger positive signal.
Risks specific to each company
The following categories identify critical pressure points and systemic threats facing Moody’s Corporation and Nasdaq, Inc. in the 2026 market environment:
1. Market & Competition
Moody’s Corporation
- Faces intense competition in credit rating and analytics with pressure on pricing power.
Nasdaq, Inc.
- Competes broadly in technology-driven market services and data, with high innovation demands.
2. Capital Structure & Debt
Moody’s Corporation
- High debt-to-equity ratio (2.17) signals elevated financial leverage and risk.
Nasdaq, Inc.
- Moderate leverage with debt-to-equity around 0.81, showing more conservative capital structure.
3. Stock Volatility
Moody’s Corporation
- Beta of 1.44 indicates higher share price volatility relative to the market.
Nasdaq, Inc.
- Beta near 1.02 suggests volatility close to overall market levels, implying steadier trading.
4. Regulatory & Legal
Moody’s Corporation
- Subject to stringent regulations in credit rating disclosures and conflicts of interest scrutiny.
Nasdaq, Inc.
- Heavily regulated in exchange operations, market technology, and anti-financial crime compliance.
5. Supply Chain & Operations
Moody’s Corporation
- Relies on data integrity and analytics infrastructure, vulnerable to tech disruptions.
Nasdaq, Inc.
- Operations depend on robust IT systems and cloud platforms, with risks from cyber threats.
6. ESG & Climate Transition
Moody’s Corporation
- Faces pressure to enhance ESG product offerings and integrate climate risk in ratings.
Nasdaq, Inc.
- Increasing focus on ESG data services but must manage own sustainability footprint transparently.
7. Geopolitical Exposure
Moody’s Corporation
- Global footprint in 140 countries exposes it to sovereign risk and regulatory variability.
Nasdaq, Inc.
- Global exchange presence subjects it to geopolitical tensions impacting cross-border trading.
Which company shows a better risk-adjusted profile?
Moody’s most impactful risk is its high financial leverage, raising solvency concerns despite strong profitability. Nasdaq’s chief risk lies in operational tech dependency amid evolving regulations. Moody’s elevated beta signals greater market risk. Nasdaq’s safer capital structure and moderate volatility provide a cleaner risk-adjusted profile. Moody’s Altman Z-Score of 7.78 confirms low bankruptcy risk but flags leverage. Nasdaq’s Z-Score in the grey zone calls for caution on financial stability. Overall, Nasdaq offers a more balanced risk-reward posture for 2026 investors.
Final Verdict: Which stock to choose?
Moody’s Corporation (MCO) shines with its unmatched efficiency in capital allocation, consistently creating value above its cost of capital. Its high returns on equity and strong cash flow generation highlight a robust business model. The point of vigilance is its rising leverage, which could pressure financial flexibility. MCO suits portfolios aiming for aggressive growth with a tolerance for moderate risk.
Nasdaq, Inc. (NDAQ) leverages a strategic moat rooted in its recurring revenue streams and diversified market infrastructure dominance. It offers better stability and lower financial risk than Moody’s, supported by strong interest coverage and a conservative debt profile. Its profile fits well with investors seeking growth at a reasonable price (GARP), favoring steadier income and capital preservation.
If you prioritize aggressive growth and strong capital efficiency, Moody’s Corporation outshines due to superior return metrics and cash generation. However, if you seek stability and recurring revenue safety with lower leverage risk, Nasdaq offers better stability and a more conservative risk profile. Each presents distinct trade-offs aligned with different investor strategies.
Disclaimer: Investment carries a risk of loss of initial capital. The past performance is not a reliable indicator of future results. Be sure to understand risks before making an investment decision.
Go Further
I encourage you to read the complete analyses of Moody’s Corporation and Nasdaq, Inc. to enhance your investment decisions: