Home > Comparison > Technology > TXN vs MPWR
The strategic rivalry between Texas Instruments Incorporated and Monolithic Power Systems, Inc. defines the current trajectory of the semiconductor industry. Texas Instruments operates as a capital-intensive giant with broad analog and embedded processing solutions. Monolithic Power Systems focuses on integrated power electronics with a nimble, innovation-driven model. This analysis will identify which company’s operational approach offers superior risk-adjusted returns for a diversified portfolio in the evolving technology landscape.
Table of contents
Companies Overview
Texas Instruments and Monolithic Power Systems stand as influential players in the global semiconductor landscape.
Texas Instruments Incorporated: Analog and Embedded Processing Leader
Texas Instruments dominates the semiconductor industry with a broad product portfolio focused on Analog and Embedded Processing. Its core revenue derives from power management solutions and microcontrollers serving automotive, industrial, and consumer electronics markets. In 2026, the company prioritizes innovation in signal chain products and energy-efficient components to maintain its competitive edge.
Monolithic Power Systems, Inc.: Specialized Power Electronics Innovator
Monolithic Power Systems excels in semiconductor-based power electronics, delivering DC-to-DC integrated circuits for computing, automotive, and industrial applications. Its revenue engine centers on voltage conversion and lighting control ICs for diverse electronic devices. The 2026 strategy emphasizes expanding global market reach through distributors and OEM partnerships, targeting high-growth sectors like automotive and communications.
Strategic Collision: Similarities & Divergences
Both firms compete fiercely in power management semiconductors but diverge in scope—Texas Instruments opts for a diversified product ecosystem, while Monolithic Power Systems focuses on niche, high-margin solutions. The primary battleground lies in voltage regulation and power efficiency technologies. Their distinct scale and specialization define contrasting investment profiles—Texas Instruments offers stable breadth, Monolithic Power Systems delivers targeted innovation.
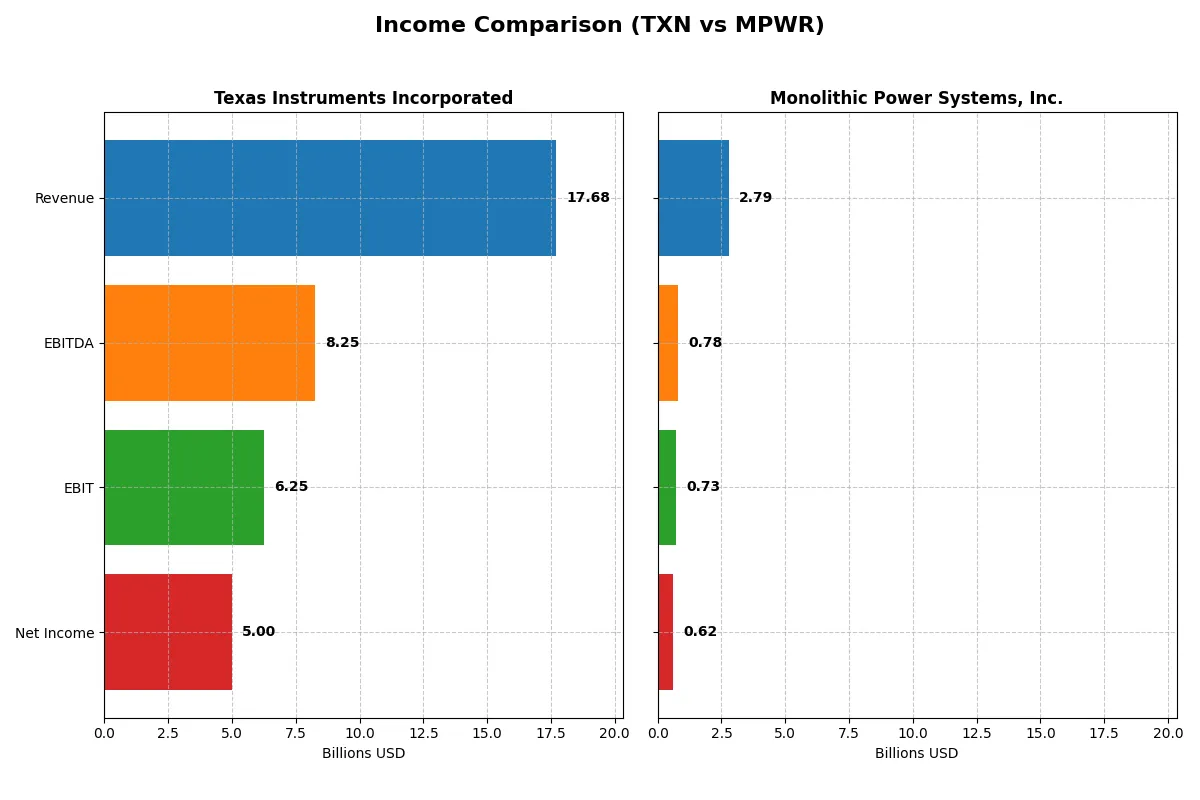
Income Statement Comparison
This data dissects the core profitability and scalability of both corporate engines to reveal who dominates the bottom line:
| Metric | Texas Instruments (TXN) | Monolithic Power Systems (MPWR) |
|---|---|---|
| Revenue | 17.7B | 2.79B |
| Cost of Revenue | 7.6B | 1.25B |
| Operating Expenses | 4.06B | 811M |
| Gross Profit | 10.1B | 1.54B |
| EBITDA | 8.25B | 780M |
| EBIT | 6.25B | 729M |
| Interest Expense | 543M | 0 |
| Net Income | 5.00B | 616M |
| EPS | 5.45 | 12.82 |
| Fiscal Year | 2025 | 2025 |
Income Statement Analysis: The Bottom-Line Duel
This income statement comparison reveals the true efficiency and profitability of Texas Instruments versus Monolithic Power Systems’ corporate engines.
Texas Instruments Incorporated Analysis
Texas Instruments (TXN) shows a mixed revenue trajectory, peaking at $20B in 2022 before declining to $17.7B in 2025. Net income also fell sharply over five years from $8.7B to $5B. Despite this, TXN maintains strong gross and net margins at 57% and 28%, reflecting solid cost control. The 2025 year shows moderate revenue growth of 13%, but net margin dipped nearly 8%, signaling margin pressure despite operational efficiency.
Monolithic Power Systems, Inc. Analysis
Monolithic Power (MPWR) exhibits robust revenue growth, surging 131% over five years to $2.79B in 2025. Net income expanded even faster by 154%, reaching $616M. Gross margin remains healthy at 55%, though lower than TXN’s, while net margin stands at 22%. MPWR’s latest year shows a 26% revenue jump and a 35% rise in EBIT, but net margin and EPS contracted sharply, suggesting some earnings volatility despite strong top-line momentum.
Margin Strength vs. Growth Momentum
TXN leads with superior margins and operational stability, but faces declining revenue and net income trends over five years. MPWR impresses with explosive revenue and profit growth, although its margins and earnings per share show more volatility. For investors, TXN’s profile suits margin-focused, steady cash flow seekers, while MPWR appeals more to growth-oriented investors willing to tolerate short-term swings.
Financial Ratios Comparison
These vital ratios act as a diagnostic tool to expose the underlying fiscal health, valuation premiums, and capital efficiency of each company:
| Ratios | Texas Instruments Incorporated (TXN) | Monolithic Power Systems, Inc. (MPWR) |
|---|---|---|
| ROE | 30.7% | 16.6% |
| ROIC | 16.5% | 14.9% |
| P/E | 31.5 | 70.7 |
| P/B | 9.69 | 11.7 |
| Current Ratio | 4.35 | 5.91 |
| Quick Ratio | 2.83 | 4.38 |
| D/E | 0.86 | 0 (Zero Debt) |
| Debt-to-Assets | 40.6% | 0% |
| Interest Coverage | 11.1 | 0 (No Interest Expense) |
| Asset Turnover | 0.51 | 0.65 |
| Fixed Asset Turnover | 1.44 | 4.45 |
| Payout ratio | 100% | 46.2% |
| Dividend yield | 3.17% | 0.65% |
| Fiscal Year | 2025 | 2025 |
Efficiency & Valuation Duel: The Vital Signs
Financial ratios serve as a company’s DNA, exposing hidden risks and revealing operational excellence beneath the surface.
Texas Instruments Incorporated
Texas Instruments delivers strong profitability with a robust 30.7% ROE and a healthy 28.3% net margin, signaling operational efficiency. However, its valuation appears stretched, with a P/E of 31.5 and P/B of 9.7, above sector averages. The 3.17% dividend yield rewards shareholders consistently, reflecting a disciplined capital return strategy.
Monolithic Power Systems, Inc.
Monolithic Power shows decent profitability, posting a 16.6% ROE and a 22.1% net margin, but it trades at a lofty P/E of 70.7 and P/B of 11.7, indicating a premium valuation. The company retains most earnings to fuel R&D and growth, offering a modest 0.65% dividend yield, highlighting a growth-focused capital allocation approach.
Premium Valuation vs. Operational Safety
Monolithic Power’s valuation premium contrasts Texas Instruments’ operational strength and shareholder returns. Texas Instruments offers a better risk-reward balance with higher profitability and a solid dividend. Investors seeking stable income and efficient capital deployment may find Texas Instruments’ profile more fitting.
Which one offers the Superior Shareholder Reward?
I compare Texas Instruments (TXN) and Monolithic Power Systems (MPWR) on their shareholder return strategies. TXN yields 3.17% with a nearly 100% payout ratio, showing strong dividend commitment backed by steady free cash flow (3B+ FCF). TXN also maintains moderate buybacks, reinforcing capital return. MPWR offers a minimal 0.65% dividend yield but commits heavily to buybacks and reinvestment, reflecting a growth-centric model with no debt and high cash reserves. TXN’s model balances income and growth, while MPWR leans on aggressive reinvestment and buybacks. I find TXN’s sustainable dividend and measured buybacks deliver a superior total return profile for cautious 2026 investors.
Comparative Score Analysis: The Strategic Profile
The radar chart reveals the fundamental DNA and trade-offs of Texas Instruments and Monolithic Power Systems, highlighting their strategic strengths and weaknesses:
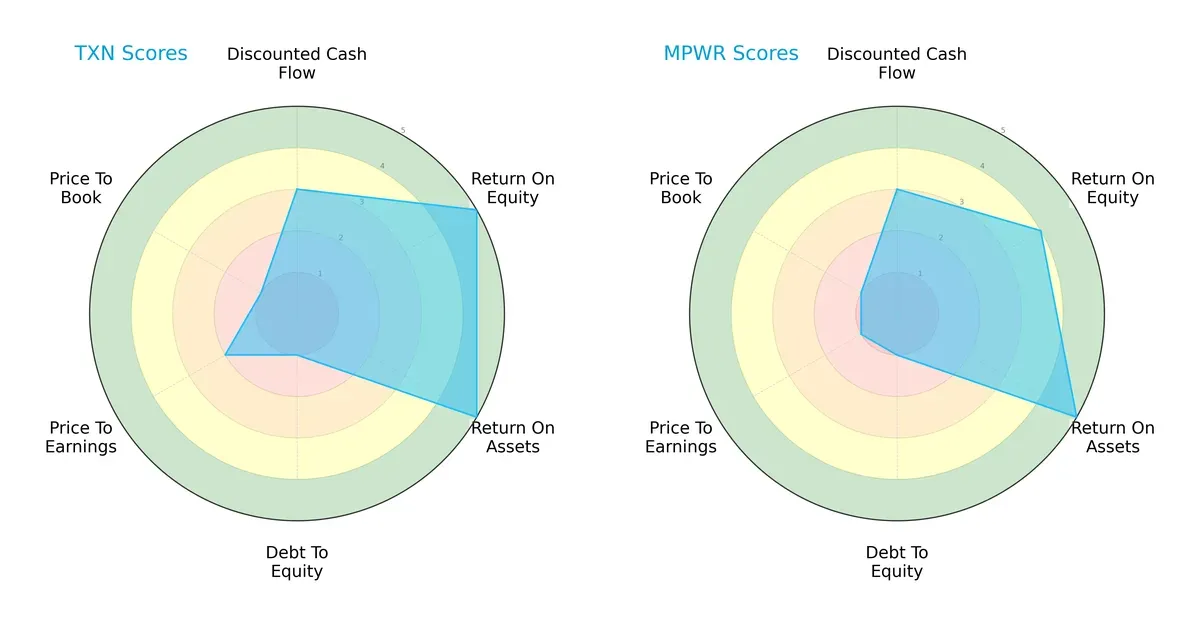
Texas Instruments excels with very favorable ROE and ROA scores, demonstrating superior profitability and asset efficiency. Monolithic Power also shows strong asset utilization but slightly lags in ROE. Both firms share very unfavorable debt-to-equity and price-to-book scores, reflecting higher financial leverage and valuation concerns. Texas Instruments presents a more balanced profile, leveraging its profitability edge, while Monolithic Power relies more on operational efficiency.
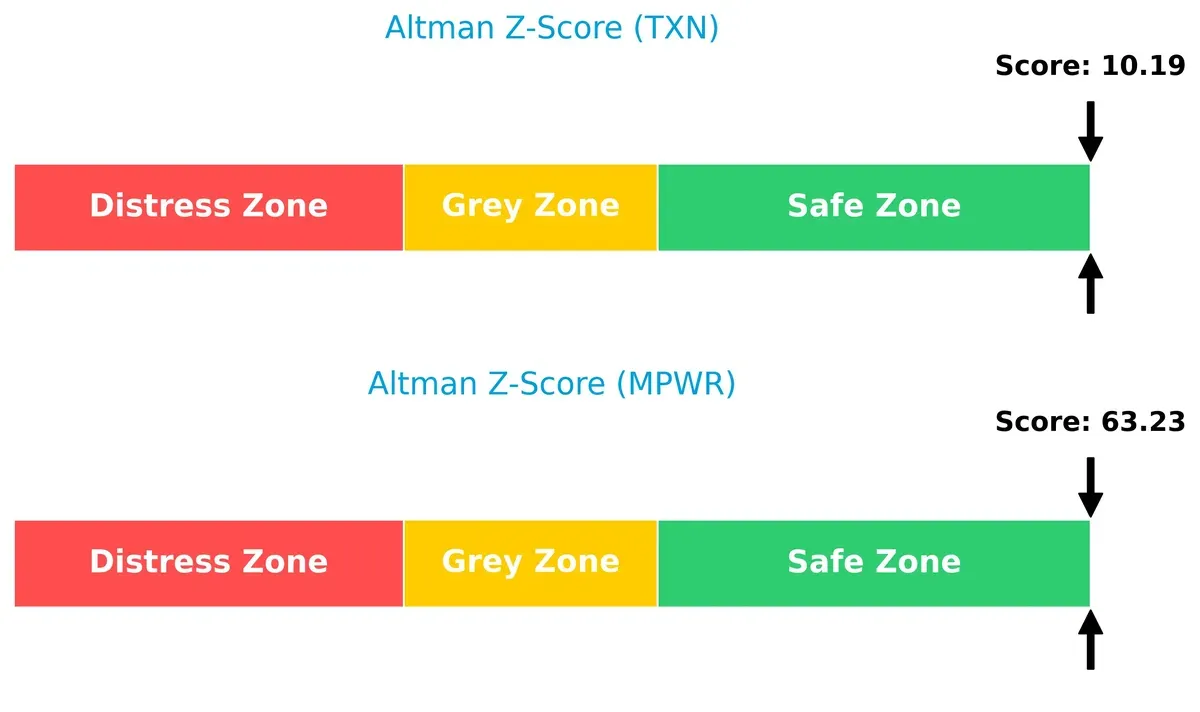
Bankruptcy Risk: Solvency Showdown
The Altman Z-Scores show both firms are firmly in the safe zone, with Monolithic Power’s exceptionally high score indicating a robust buffer against bankruptcy risk in this cycle:
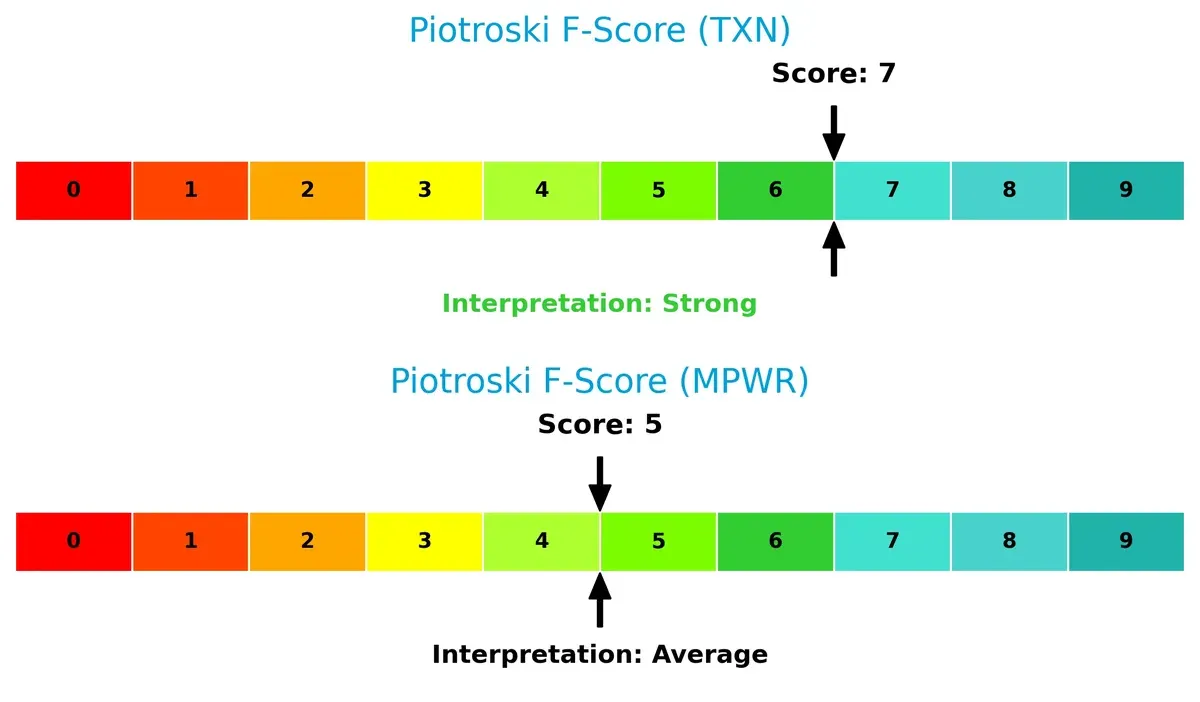
Financial Health: Quality of Operations
Texas Instruments holds a stronger Piotroski F-Score at 7, signaling solid financial health and operational quality, whereas Monolithic Power’s score of 5 suggests moderate strength with some potential red flags:
How are the two companies positioned?
This section dissects Texas Instruments and Monolithic Power Systems’ operational DNA by comparing their revenue distribution and internal dynamics. The goal is to confront their economic moats and identify which model delivers the most resilient competitive advantage today.
Revenue Segmentation: The Strategic Mix
This visual comparison dissects how Texas Instruments and Monolithic Power Systems diversify their income streams and where their primary sector bets lie:
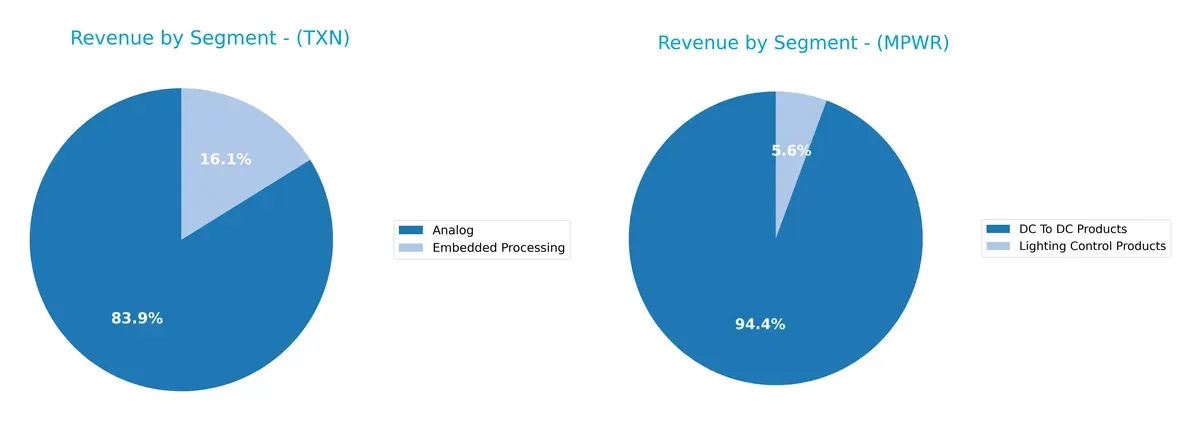
Texas Instruments anchors its revenue with $14B from Analog and $2.7B from Embedded Processing in 2025, showing a clear dominance of Analog. Monolithic Power Systems pivots almost entirely on DC To DC Products at $1.72B, with a minor $102M from Lighting Control. TI’s mix suggests ecosystem lock-in with varied but concentrated strength, while MPWR faces concentration risk relying heavily on one segment.
Strengths and Weaknesses Comparison
This table compares the Strengths and Weaknesses of Texas Instruments Incorporated and Monolithic Power Systems, Inc.:
Texas Instruments Strengths
- Strong profitability with 28.28% net margin
- High ROE at 30.73%
- Favorable ROIC of 16.52%
- Robust quick ratio at 2.83
- High interest coverage at 11.52
- Significant dividend yield of 3.17%
Monolithic Power Systems Strengths
- Solid profitability with 22.07% net margin
- Favorable ROE at 16.55%
- Strong ROIC of 14.93%
- Zero debt enhances financial stability
- Infinite interest coverage
- High fixed asset turnover of 4.45
Texas Instruments Weaknesses
- Unfavorable high P/E ratio of 31.53
- Elevated P/B ratio at 9.69
- High current ratio of 4.35, possibly inefficient asset use
- Moderate debt-to-assets at 40.62%
- Neutral WACC at 8.12%
- Moderate asset turnover at 0.51
Monolithic Power Systems Weaknesses
- Very high P/E ratio of 70.69 signals expensive valuation
- High P/B ratio at 11.7
- Unfavorable WACC at 10.63%
- High current ratio of 5.91 might indicate excess liquidity
- Low dividend yield at 0.65%
- Asset turnover neutral at 0.65
Both companies show strong profitability and financial health markers but differ in capital structure and valuation metrics. Texas Instruments emphasizes dividend income and efficient use of equity, while Monolithic Power Systems benefits from a debt-free balance sheet and asset efficiency, albeit with a more stretched valuation and weaker dividend profile. These contrasts suggest distinct strategic priorities in capital allocation and market positioning.
The Moat Duel: Analyzing Competitive Defensibility
A structural moat is the only reliable shield protecting long-term profits from relentless competitive pressures in dynamic markets:
Texas Instruments Incorporated: Durable Cost Advantage
Texas Instruments leverages a cost advantage in analog and embedded semiconductors, reflected in a strong 35% EBIT margin. Though ROIC exceeds WACC by 8.4%, its declining trend warns of margin pressure in 2026 amid evolving product demands.
Monolithic Power Systems, Inc.: Agile Innovation Moat
Monolithic Power Systems’ moat stems from innovative power management ICs, showing rapid revenue growth of 26% and a 4.3% ROIC premium over WACC. Its agility contrasts with Texas Instruments’ scale but faces margin compression risks from intensifying competition.
Scale Efficiency vs. Innovation Velocity
Texas Instruments’ wider moat benefits from scale and cost leadership, while Monolithic Power Systems relies on faster innovation cycles. I see Texas Instruments better positioned to defend market share through entrenched cost efficiencies despite both firms’ declining ROIC trends.
Which stock offers better returns?
Over the past year, Texas Instruments and Monolithic Power Systems both showed strong upward momentum, with notable acceleration and increasing buyer dominance shaping their trading dynamics.
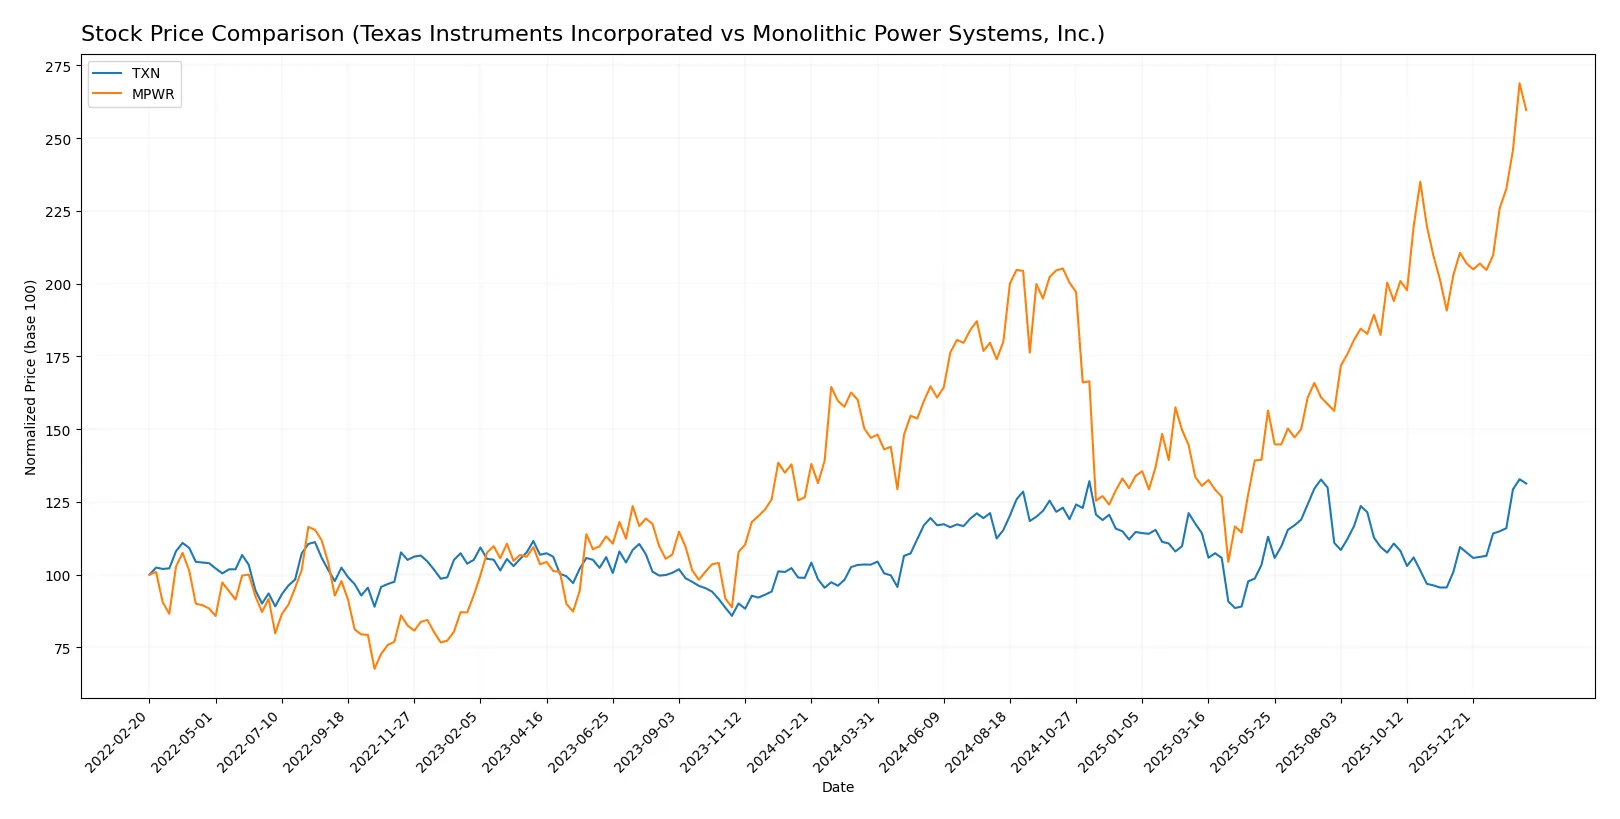
Trend Comparison
Texas Instruments’ stock price rose 26.94% over the past 12 months, marking a bullish trend with accelerating momentum and moderate volatility (16.41 std deviation). The price ranged from 147.6 to 221.44.
Monolithic Power Systems surged 76.66% in the same period, also bullish with acceleration but significantly higher volatility (155.88 std deviation). Price fluctuated between 477.39 and 1229.82.
Monolithic Power Systems outperformed Texas Instruments, delivering the highest market return amid greater price swings and stronger recent upward slope.
Target Prices
Analysts present a confident consensus on target prices for Texas Instruments and Monolithic Power Systems.
| Company | Target Low | Target High | Consensus |
|---|---|---|---|
| Texas Instruments Incorporated | 160 | 260 | 204.64 |
| Monolithic Power Systems, Inc. | 1200 | 1500 | 1313.71 |
The consensus target for Texas Instruments sits slightly below its current price of 219, signaling moderate upside potential. Monolithic Power’s consensus target exceeds its current 1195 stock price, reflecting stronger expected growth.

Don’t Let Luck Decide Your Entry Point
Optimize your entry points with our advanced ProRealTime indicators. You’ll get efficient buy signals with precise price targets for maximum performance. Start outperforming now!
How do institutions grade them?
The institutional grades for Texas Instruments Incorporated and Monolithic Power Systems, Inc. reveal the latest analyst views:
Texas Instruments Incorporated Grades
The table below summarizes recent grades from leading financial institutions for Texas Instruments Incorporated.
| Grading Company | Action | New Grade | Date |
|---|---|---|---|
| Rosenblatt | Maintain | Buy | 2026-02-05 |
| JP Morgan | Maintain | Overweight | 2026-01-28 |
| Cantor Fitzgerald | Maintain | Neutral | 2026-01-28 |
| Wells Fargo | Maintain | Equal Weight | 2026-01-28 |
| Truist Securities | Maintain | Hold | 2026-01-28 |
| Stifel | Maintain | Hold | 2026-01-28 |
| UBS | Maintain | Buy | 2026-01-28 |
| Mizuho | Maintain | Underperform | 2026-01-28 |
| Jefferies | Maintain | Hold | 2026-01-28 |
| Benchmark | Maintain | Buy | 2026-01-28 |
Monolithic Power Systems, Inc. Grades
Below is a summary of recent grades assigned by major institutions for Monolithic Power Systems, Inc.
| Grading Company | Action | New Grade | Date |
|---|---|---|---|
| Rosenblatt | Maintain | Neutral | 2026-02-06 |
| Needham | Maintain | Buy | 2026-02-06 |
| Keybanc | Maintain | Overweight | 2026-02-06 |
| Wells Fargo | Maintain | Overweight | 2026-02-06 |
| Truist Securities | Maintain | Buy | 2026-02-06 |
| Stifel | Maintain | Buy | 2026-02-04 |
| Wells Fargo | Maintain | Overweight | 2026-01-26 |
| Wells Fargo | Upgrade | Overweight | 2026-01-15 |
| Truist Securities | Maintain | Buy | 2025-12-19 |
| Citigroup | Maintain | Buy | 2025-11-03 |
Which company has the best grades?
Monolithic Power Systems holds a stronger consensus with multiple “Buy” and “Overweight” ratings. Texas Instruments shows a wider grade range, including “Underperform.” Investors may perceive Monolithic as having more bullish analyst support.
Risks specific to each company
In 2026’s complex market environment, the following categories identify critical pressure points and systemic threats facing both Texas Instruments Incorporated and Monolithic Power Systems, Inc.:
1. Market & Competition
Texas Instruments Incorporated
- Established analog and embedded processing segments face intense competition and cyclical semiconductor demand.
Monolithic Power Systems, Inc.
- Rapid innovation needed to maintain edge in power electronics amid rising competition and higher market beta.
2. Capital Structure & Debt
Texas Instruments Incorporated
- Moderate leverage with debt-to-assets at 40.6%, interest coverage strong at 11.5x, but debt-to-equity score very unfavorable.
Monolithic Power Systems, Inc.
- Debt-free balance sheet offers financial flexibility and minimal risk, reflected in a perfect debt-to-equity score.
3. Stock Volatility
Texas Instruments Incorporated
- Beta near 1.0 suggests market-level volatility; stable but sensitive to macro shifts.
Monolithic Power Systems, Inc.
- Elevated beta at 1.46 indicates higher price swings, increasing risk for risk-averse investors.
4. Regulatory & Legal
Texas Instruments Incorporated
- Global semiconductor regulations pose compliance costs but manageable given scale and experience.
Monolithic Power Systems, Inc.
- Exposure to international markets increases regulatory complexity, especially in Asia-Pacific regions.
5. Supply Chain & Operations
Texas Instruments Incorporated
- Large scale operations backed by diversified supplier base reduce supply chain disruptions risk.
Monolithic Power Systems, Inc.
- Smaller scale and reliance on third-party distributors amplify supply chain vulnerability.
6. ESG & Climate Transition
Texas Instruments Incorporated
- Strong ESG commitments likely to enhance stakeholder trust but require continuous investment.
Monolithic Power Systems, Inc.
- ESG initiatives still evolving; potential reputational risk if lagging peers in climate transition.
7. Geopolitical Exposure
Texas Instruments Incorporated
- Broad international footprint exposes TI to trade tensions but benefits from diversified market access.
Monolithic Power Systems, Inc.
- Concentrated exposure in Asia-Pacific markets raises vulnerability to geopolitical tensions and tariffs.
Which company shows a better risk-adjusted profile?
Texas Instruments faces leverage and regulatory risks but benefits from scale, stable volatility, and solid operational resilience. Monolithic Power Systems boasts a pristine balance sheet and strong operational efficiency but contends with higher volatility and concentrated geopolitical exposure. TI’s diversified risk profile and strong financial health offer a better risk-adjusted profile today.
Final Verdict: Which stock to choose?
Texas Instruments’ superpower lies in its unmatched operational efficiency and robust capital returns. It generates consistent free cash flow, supporting dividends and strategic investments. A point of vigilance is its declining ROIC trend, signaling potential margin pressure ahead. This stock suits portfolios focused on stable income and moderate growth.
Monolithic Power Systems commands a strategic moat through rapid revenue growth and a strong balance sheet with zero debt. Its nimble innovation and high R&D intensity fuel expansion in niche power solutions. Compared to Texas Instruments, it offers higher growth potential but with increased valuation risk, fitting growth-oriented or GARP portfolios.
If you prioritize reliable cash generation and defensive positioning, Texas Instruments outshines with a proven track record and attractive dividend yield. However, if you seek accelerated growth and can tolerate valuation volatility, Monolithic Power Systems offers superior upside fueled by innovation and balance sheet strength. Each presents a distinct analytical scenario for different investor profiles.
Disclaimer: Investment carries a risk of loss of initial capital. The past performance is not a reliable indicator of future results. Be sure to understand risks before making an investment decision.
Go Further
I encourage you to read the complete analyses of Texas Instruments Incorporated and Monolithic Power Systems, Inc. to enhance your investment decisions: