Home > Comparison > Technology > MPWR vs STM
The strategic rivalry between Monolithic Power Systems and STMicroelectronics shapes the semiconductor sector’s evolution. Monolithic Power excels as a nimble, high-margin designer of power electronics, while STMicroelectronics operates as a diversified industrial heavyweight with broad semiconductor manufacturing capabilities. This analysis pits focused innovation against scale and diversification, aiming to identify which trajectory offers superior risk-adjusted returns for a diversified portfolio in today’s complex technology landscape.
Table of contents
Companies Overview
Monolithic Power Systems and STMicroelectronics stand as pivotal players in the global semiconductor landscape.
Monolithic Power Systems, Inc.: Power Electronics Specialist
Monolithic Power Systems dominates the DC to DC integrated circuits market, powering devices from automotive to consumer electronics. Its revenue engine centers on voltage conversion and control solutions. In 2026, the company sharpened its focus on expanding applications in computing, storage, and industrial sectors, leveraging cutting-edge power electronics to enhance energy efficiency.
STMicroelectronics N.V.: Diversified Semiconductor Innovator
STMicroelectronics operates a broad semiconductor portfolio spanning automotive ICs, analog, MEMS, sensors, and microcontrollers. Its revenue derives from diverse segments catering to automotive, industrial, and personal electronics markets worldwide. In 2026, it prioritized scaling advanced sensor technologies and integrated microcontrollers to meet rising demand for smart, connected devices.
Strategic Collision: Similarities & Divergences
Both firms excel in semiconductor innovation but diverge sharply: Monolithic Power Systems focuses on power management ICs, while STMicroelectronics pursues a diversified analog and digital product mix. Their battleground lies in automotive and industrial electronics, where integration and efficiency dictate market share. Investors find distinct profiles—MPWR as a niche technical leader, STM as a broad-based industry stalwart.
Income Statement Comparison
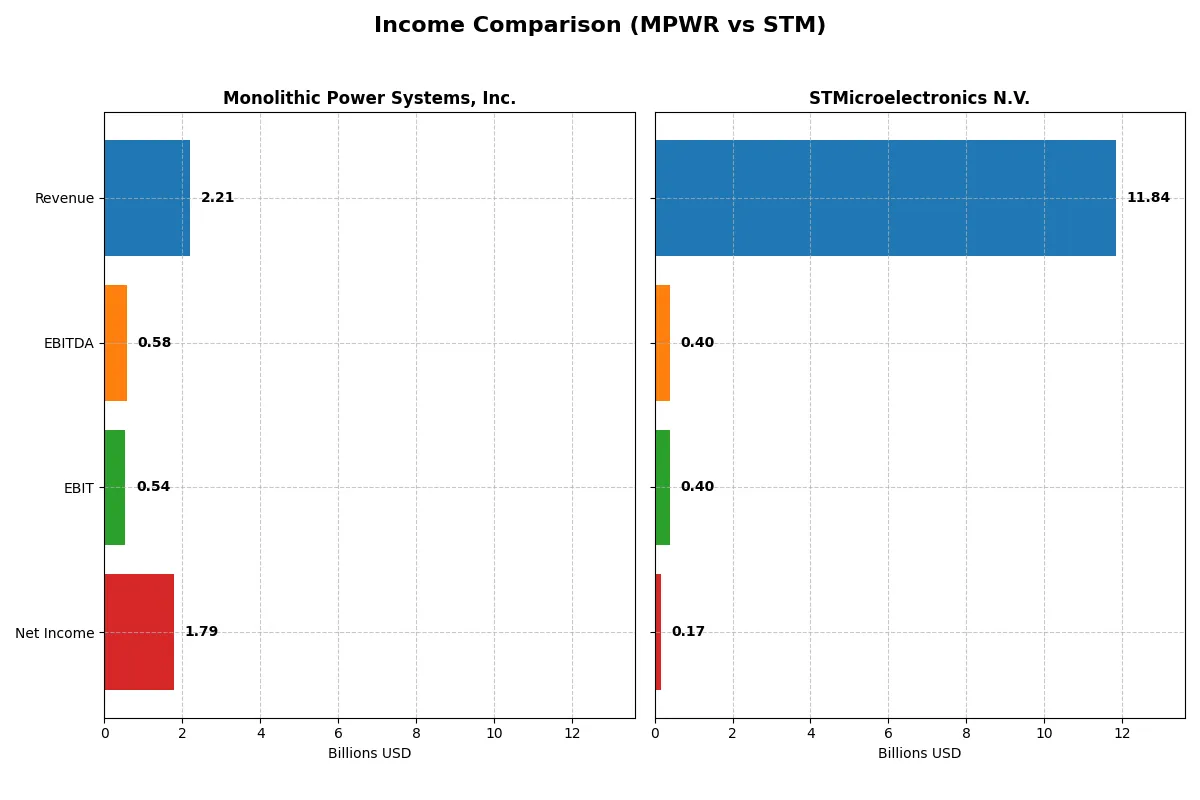
The following data dissects the core profitability and scalability of both corporate engines to reveal who dominates the bottom line:
| Metric | Monolithic Power Systems, Inc. (MPWR) | STMicroelectronics N.V. (STM) |
|---|---|---|
| Revenue | 2.21B | 13.27B |
| Cost of Revenue | 986M | 8.05B |
| Operating Expenses | 682M | 3.54B |
| Gross Profit | 1.22B | 5.22B |
| EBITDA | 576M | 3.72B |
| EBIT | 539M | 1.96B |
| Interest Expense | 0 | 85M |
| Net Income | 1.79B | 1.56B |
| EPS | 36.76 | 1.73 |
| Fiscal Year | 2024 | 2024 |
Income Statement Analysis: The Bottom-Line Duel
This income statement comparison reveals which company operates with superior efficiency and sustainable profitability in a competitive semiconductor landscape.
Monolithic Power Systems, Inc. Analysis
Monolithic Power’s revenue climbed from 844M in 2020 to 2.2B in 2024, a 161% rise, with net income surging nearly 10-fold to 1.79B. Its gross margin holds strong at 55.3%, and net margin impressively reached 81% in 2024, signaling exceptional cost control and earnings quality. The company’s momentum accelerates with a 21% revenue increase and nearly 318% EPS growth from 2023 to 2024.
STMicroelectronics N.V. Analysis
STMicroelectronics posted revenue peaking at 17.3B in 2023, then declining 11% to 11.8B in 2025, with net income shrinking over 90% to just 167M. Its gross margin remains decent at 33.9%, but the net margin collapsed to 1.4%, reflecting margin pressure and operational challenges. The company’s profitability deteriorated sharply in 2025, marked by a nearly 80% EBIT decline and negative earnings growth.
Margin Mastery vs. Scale Struggles
Monolithic Power dominates with superior margin expansion, robust revenue growth, and sharply rising net income. STMicroelectronics, despite larger scale, faces declining revenue and compressed profits. For investors prioritizing efficiency and earnings momentum, Monolithic Power’s profile presents a clearer path to sustainable value creation.
Financial Ratios Comparison
These vital ratios act as a diagnostic tool to expose the underlying fiscal health, valuation premiums, and capital efficiency of the companies compared below:
| Ratios | Monolithic Power Systems, Inc. (MPWR) | STMicroelectronics N.V. (STM) |
|---|---|---|
| ROE | 56.8% | 8.9% |
| ROIC | 16.2% | 6.3% |
| P/E | 16.1 | 14.4 |
| P/B | 9.14 | 1.29 |
| Current Ratio | 5.31 | 3.11 |
| Quick Ratio | 3.89 | 2.37 |
| D/E | 0.005 | 0.18 |
| Debt-to-Assets | 0.44% | 12.8% |
| Interest Coverage | 0 | 19.7 |
| Asset Turnover | 0.61 | 0.54 |
| Fixed Asset Turnover | 4.17 | 1.22 |
| Payout ratio | 13.5% | 18.5% |
| Dividend yield | 0.84% | 1.28% |
| Fiscal Year | 2024 | 2024 |
Efficiency & Valuation Duel: The Vital Signs
Ratios act as a company’s DNA, uncovering hidden risks and operational strengths beyond headline financials.
Monolithic Power Systems, Inc.
MPWR demonstrates exceptional profitability with a 56.8% ROE and an 80.95% net margin, signaling operational excellence. Its P/E ratio of 16.09 suggests a fairly valued stock, while a high P/B ratio of 9.14 flags valuation concerns. Shareholders receive modest dividends, complemented by strong reinvestment in R&D (14.7% of revenue).
STMicroelectronics N.V.
STM posts weak profitability with a 0.93% ROE and a slim 1.41% net margin, reflecting operational challenges. The P/E and P/B ratios are favorable but likely distorted by losses. STM maintains a neutral stance on leverage, with a current ratio of 3.36. It pays no dividend, focusing on R&D (17.3% of revenue) to drive future growth.
Premium Valuation vs. Operational Safety
MPWR balances strong returns and solid reinvestment but trades at a stretched book value. STM offers a cheaper valuation but suffers from weak profitability and no shareholder payouts. MPWR suits investors prioritizing operational efficiency, while STM fits those seeking turnaround potential with higher risk.
Which one offers the Superior Shareholder Reward?
I compare Monolithic Power Systems (MPWR) and STMicroelectronics (STM) on distribution strategies. MPWR pays a modest 0.84% dividend yield with a 13.5% payout ratio, well-covered by strong free cash flow (FCF). STM offers a slightly higher 1.28% yield but with a lower payout ratio near 18.5%. MPWR’s consistent buyback activity adds meaningful shareholder value, while STM’s buybacks seem minimal or absent, relying more on dividends and reinvestment. MPWR’s low debt and high current ratio underpin a sustainable distribution model. STM shows thinner margins and higher leverage, risking payout sustainability. I see MPWR’s balanced dividends and aggressive buybacks as superior for total return in 2026.
Comparative Score Analysis: The Strategic Profile
The radar chart reveals the fundamental DNA and trade-offs of Monolithic Power Systems, Inc. and STMicroelectronics N.V., highlighting their core financial strengths and vulnerabilities:
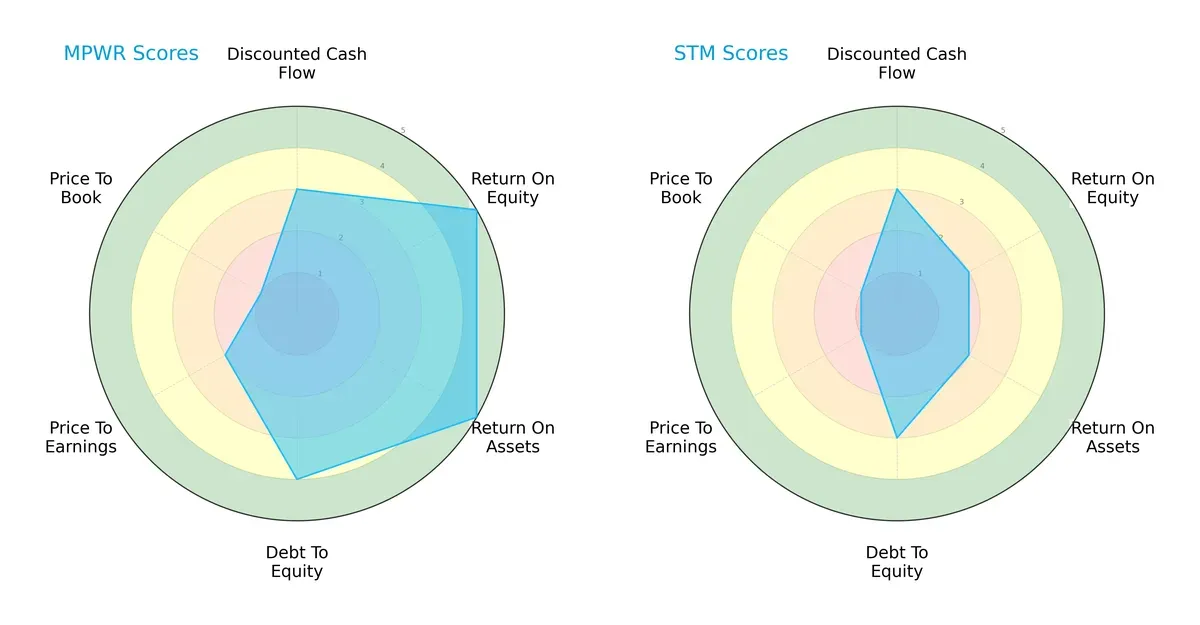
Monolithic Power Systems exhibits a balanced profile with very favorable ROE and ROA scores, reflecting efficient profit generation and asset use. It also shows a stronger debt-to-equity position, signaling lower financial risk. However, its valuation scores (P/E and P/B) are weak, suggesting potential overvaluation or market skepticism. STMicroelectronics has moderate scores across the board but relies on neither a strong profit efficiency nor an exceptionally low leverage, indicating less financial robustness. MPWR clearly dominates in operational efficiency, while STM lacks a distinct edge.
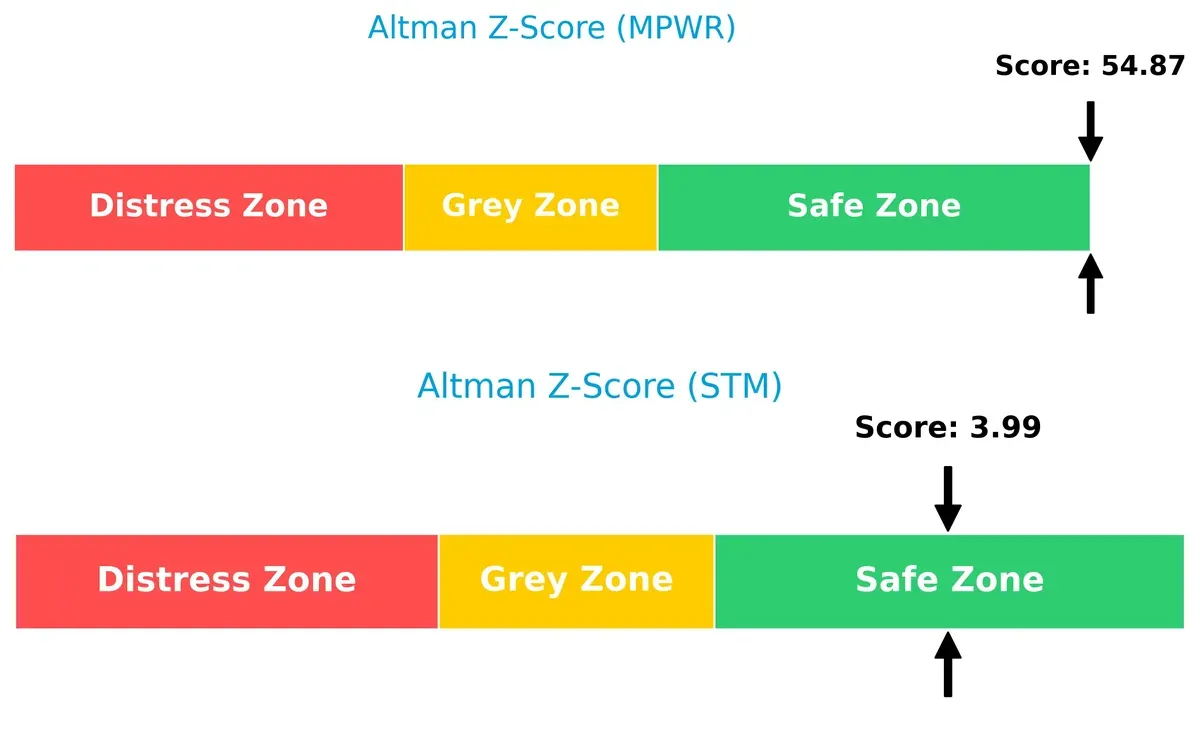
Bankruptcy Risk: Solvency Showdown
Monolithic Power Systems’ Altman Z-Score dramatically outperforms STMicroelectronics, signaling far superior long-term solvency and a safer financial position in this cycle:
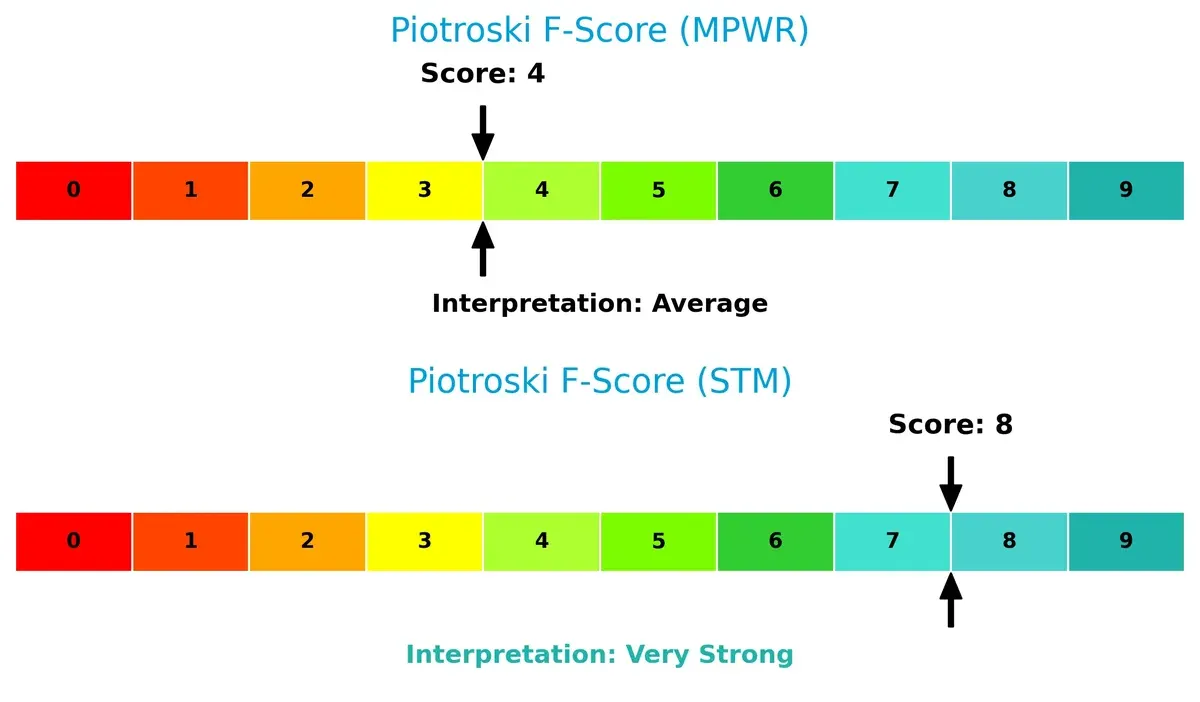
Financial Health: Quality of Operations
STMicroelectronics leads in Piotroski F-Score, indicating stronger internal financial health and fewer red flags compared to Monolithic Power Systems, whose average score suggests caution in operational metrics:
How are the two companies positioned?
This section dissects the operational DNA of MPWR and STM by comparing their revenue distribution and internal dynamics. The final objective confronts their economic moats to reveal which model offers the most resilient competitive advantage today.
Revenue Segmentation: The Strategic Mix
This comparison dissects how Monolithic Power Systems and STMicroelectronics diversify income streams and reveals their primary sector bets:
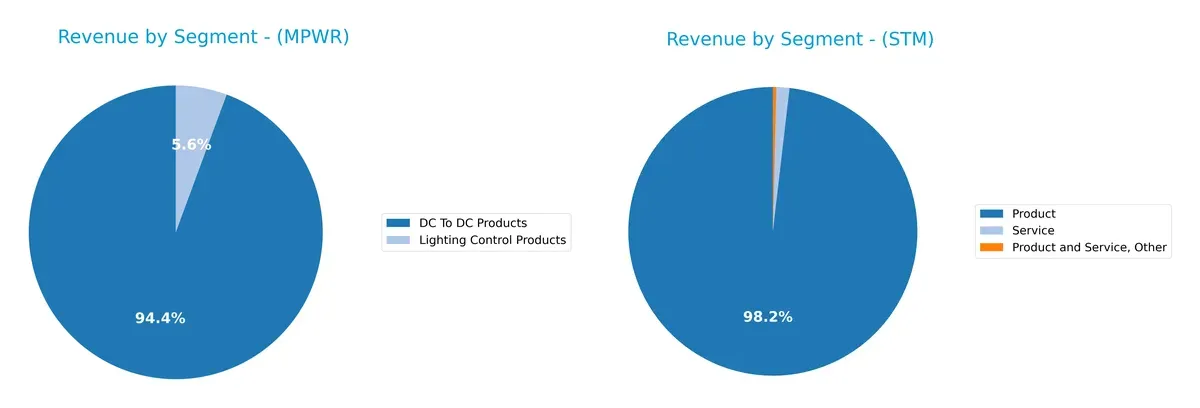
Monolithic Power Systems anchors revenue heavily in DC To DC Products with $1.72B in 2023, while Lighting Control Products contribute a modest $102M. This concentration contrasts with STMicroelectronics, whose $17.24B in Products dominates but is supplemented by $145M in Services and $47M in Other segments. MPWR’s focus signals specialization risk, whereas STM’s broader mix supports resilience through diversified semiconductor and service offerings.
Strengths and Weaknesses Comparison
This table compares the strengths and weaknesses of Monolithic Power Systems, Inc. and STMicroelectronics N.V.:
Monolithic Power Systems Strengths
- Very high net margin at 81%
- Strong ROE at 57%
- ROIC exceeds WACC, indicating value creation
- Excellent interest coverage
- Low debt-to-assets ratio at 0.44%
- High quick ratio at 3.89
- Significant revenue from DC to DC products
- Growing presence in China and Taiwan
STMicroelectronics Strengths
- Favorable P/E and P/B ratios at 0, signaling undervaluation
- Low debt-to-assets at 8.6%
- Infinite interest coverage
- Diversified product segments including automotive and digital
- Substantial global footprint across Asia Pacific, Americas, and Europe
- Strong revenue from Singapore and Switzerland
- Solid quick ratio at 2.43
Monolithic Power Systems Weaknesses
- Unfavorable WACC higher than ROIC
- High price-to-book ratio at 9.14
- Current ratio unusually high at 5.31, indicating possible inefficiency
- Dividend yield low at 0.84%
- Asset turnover moderate at 0.61
- Limited product diversification, mainly DC to DC and lighting control
STMicroelectronics Weaknesses
- Very low net margin at 1.4%
- ROE and ROIC close to zero, below WACC
- Unfavorable current ratio at 3.36
- Low asset turnover at 0.48
- Zero dividend yield
- Product revenue heavily concentrated in few segments
Overall, Monolithic Power Systems excels in profitability and capital efficiency but shows signs of financial structure inefficiency and limited diversification. STMicroelectronics demonstrates broad global reach and product diversity but struggles with profitability and asset utilization, highlighting different strategic challenges.
The Moat Duel: Analyzing Competitive Defensibility
A structural moat is the sole barrier protecting long-term profits from competitive erosion and market disruption. Let’s dissect the moats of two semiconductor players:
Monolithic Power Systems, Inc. (MPWR): Precision Engineering with Cost Advantage
I see MPWR’s moat rooted in cost advantage and specialized power ICs. Its ROIC surpasses WACC by 5.5%, signaling efficient capital use and robust profitability. Growing ROIC confirms a deepening moat. New product lines in automotive and industrial markets could further extend this advantage in 2026.
STMicroelectronics N.V. (STM): Broad Portfolio Facing Margin Pressure
STM’s moat relies on its diversified semiconductor portfolio, contrasting MPWR’s focused niche. However, with ROIC well below WACC and a steep decline in profitability, STM struggles to leverage its scale profitably. Market shifts and product commoditization threaten its position, though expansion in MEMS and sensors might offer future relief.
Cost Leadership vs. Diversification: The Moat Verdict
MPWR’s focused cost advantage yields a wider and more durable moat than STM’s sprawling but weakening portfolio. MPWR’s improving profitability equips it better to defend market share in a competitive semiconductor landscape. STM faces a steep uphill battle to regain value creation and competitive resilience.
Which stock offers better returns?
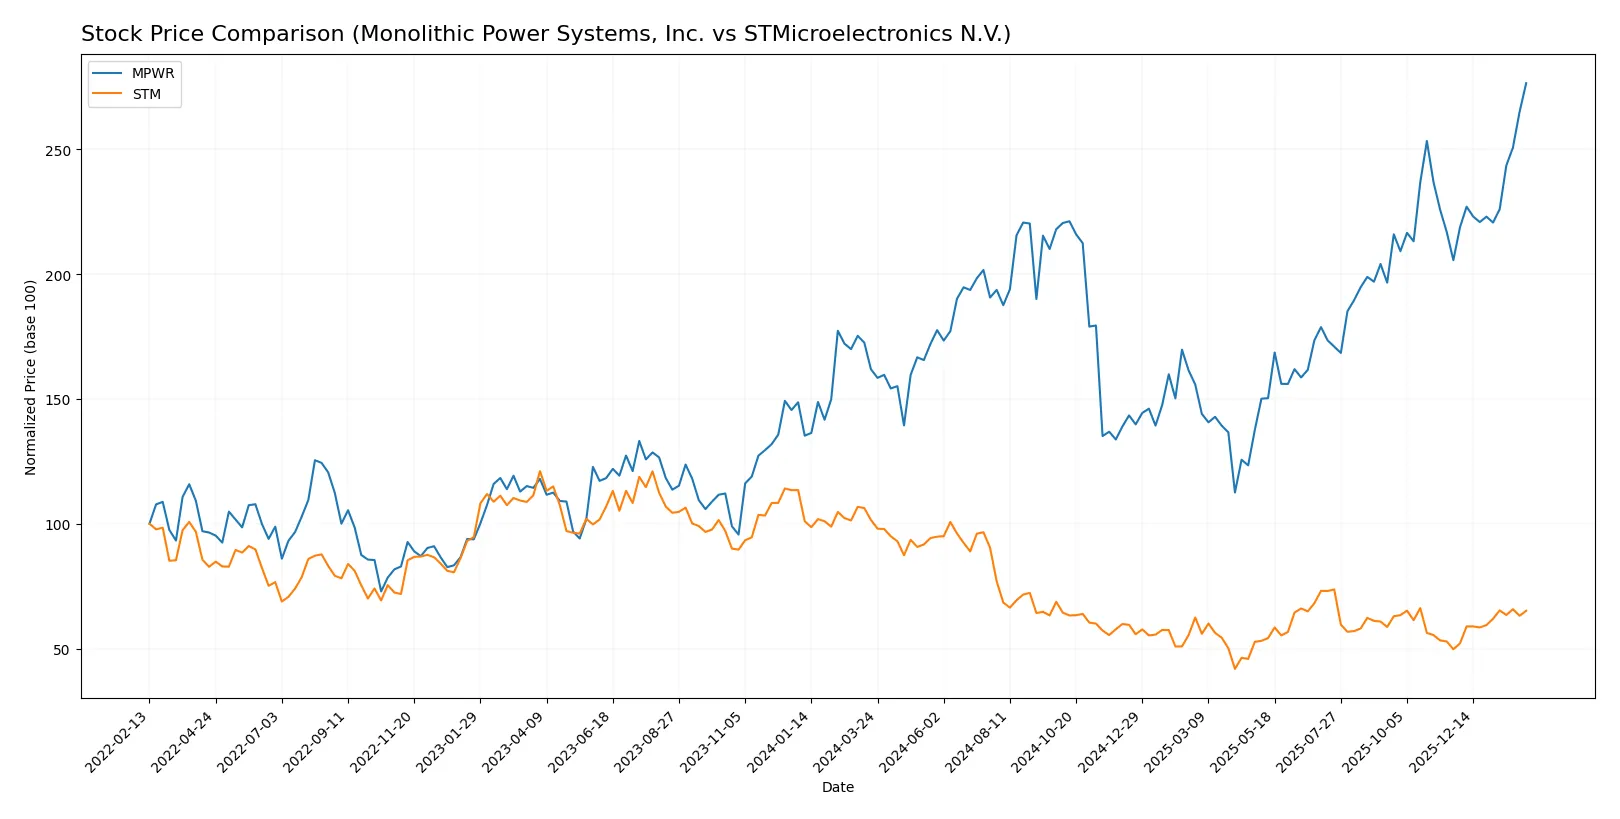
Over the past year, Monolithic Power Systems surged 70.78%, showing strong acceleration, while STMicroelectronics declined 35.85%, despite recent positive momentum.
Trend Comparison
Monolithic Power Systems’ stock rose 70.78% over the last 12 months, marking a bullish trend with accelerating gains and high volatility. Its price ranged from 477.39 to 1173.22.
STMicroelectronics experienced a 35.85% decline over the past year, reflecting a bearish trend despite recent acceleration. Price volatility remained low, fluctuating between 18.49 and 44.85.
Monolithic Power Systems outperformed STMicroelectronics significantly, with a strong upward trajectory versus a marked overall decline, delivering the highest market performance in this period.
Target Prices
Analysts set a balanced target consensus for these semiconductor leaders, indicating measured upside potential.
| Company | Target Low | Target High | Consensus |
|---|---|---|---|
| Monolithic Power Systems, Inc. | 1025 | 1375 | 1214.29 |
| STMicroelectronics N.V. | 28 | 45 | 37.67 |
Monolithic Power’s consensus target of $1,214.29 sits about 3.5% above its current $1,173 stock price, signaling modest upside. STMicroelectronics’ $37.67 consensus target exceeds its $28.77 price by over 30%, reflecting stronger growth expectations.

Don’t Let Luck Decide Your Entry Point
Optimize your entry points with our advanced ProRealTime indicators. You’ll get efficient buy signals with precise price targets for maximum performance. Start outperforming now!
How do institutions grade them?
Monolithic Power Systems, Inc. Grades
The following table summarizes recent grades from reputable institutions for Monolithic Power Systems, Inc.:
| Grading Company | Action | New Grade | Date |
|---|---|---|---|
| Wells Fargo | Maintain | Overweight | 2026-01-26 |
| Wells Fargo | Upgrade | Overweight | 2026-01-15 |
| Truist Securities | Maintain | Buy | 2025-12-19 |
| Citigroup | Maintain | Buy | 2025-11-03 |
| Keybanc | Maintain | Overweight | 2025-10-31 |
| TD Cowen | Maintain | Buy | 2025-10-31 |
| Rosenblatt | Maintain | Neutral | 2025-10-31 |
| Keybanc | Maintain | Overweight | 2025-10-23 |
| Wells Fargo | Maintain | Equal Weight | 2025-10-20 |
| Stifel | Maintain | Buy | 2025-10-17 |
STMicroelectronics N.V. Grades
Below is a summary of recent institutional grades for STMicroelectronics N.V.:
| Grading Company | Action | New Grade | Date |
|---|---|---|---|
| TD Cowen | Maintain | Buy | 2025-10-24 |
| Susquehanna | Maintain | Positive | 2025-10-22 |
| Susquehanna | Maintain | Positive | 2025-07-25 |
| Baird | Upgrade | Outperform | 2025-07-22 |
| Susquehanna | Maintain | Positive | 2025-07-22 |
| Jefferies | Upgrade | Buy | 2025-02-19 |
| Bernstein | Downgrade | Market Perform | 2025-02-05 |
| Susquehanna | Maintain | Positive | 2025-01-31 |
| Barclays | Downgrade | Underweight | 2025-01-22 |
| JP Morgan | Downgrade | Neutral | 2024-12-09 |
Which company has the best grades?
Monolithic Power Systems, Inc. holds consistently positive ratings, mostly “Buy” and “Overweight,” indicating stronger recent institutional confidence. STMicroelectronics N.V. shows mixed grades with some downgrades, reflecting more cautious sentiment. Investors might interpret these differences as varying outlooks on growth and risk.
Risks specific to each company
The following categories identify the critical pressure points and systemic threats facing both firms in the 2026 market environment:
1. Market & Competition
Monolithic Power Systems, Inc.
- Strong niche in power electronics with high margins but faces intense semiconductor industry competition.
STMicroelectronics N.V.
- Broad semiconductor portfolio with diversified markets but struggles with low profitability and margin pressure.
2. Capital Structure & Debt
Monolithic Power Systems, Inc.
- Extremely low debt-to-equity (0.01), strong balance sheet, and infinite interest coverage.
STMicroelectronics N.V.
- Moderate leverage (0.12 debt-to-equity), manageable but higher financial risk than MPWR.
3. Stock Volatility
Monolithic Power Systems, Inc.
- Beta of 1.455 indicates above-market volatility, reflecting sensitivity to tech cycles.
STMicroelectronics N.V.
- Beta of 1.322 suggests high but slightly lower volatility than MPWR.
4. Regulatory & Legal
Monolithic Power Systems, Inc.
- US-based, exposed to evolving tech regulations and export controls, especially with China.
STMicroelectronics N.V.
- European headquarters with broad global exposure, facing complex regulatory regimes and geopolitical trade tensions.
5. Supply Chain & Operations
Monolithic Power Systems, Inc.
- Relies on global suppliers with potential disruption risks but benefits from focused product lines.
STMicroelectronics N.V.
- Larger operational scale increases complexity and vulnerability to supply chain bottlenecks, especially in Asia.
6. ESG & Climate Transition
Monolithic Power Systems, Inc.
- Growing pressure to improve ESG metrics; smaller size may limit resources for climate initiatives.
STMicroelectronics N.V.
- Larger footprint requires substantial ESG compliance efforts but can leverage scale for sustainability investments.
7. Geopolitical Exposure
Monolithic Power Systems, Inc.
- US-China trade tensions impact sales and supply, with significant exposure to Asia-Pacific markets.
STMicroelectronics N.V.
- Extensive global footprint with exposure to European Union policies, US-China dynamics, and regional instability.
Which company shows a better risk-adjusted profile?
Monolithic Power Systems faces its greatest risk in market competition and stock volatility, given its niche focus and higher beta. STMicroelectronics contends with profitability challenges and complex global regulatory and supply chain risks but benefits from a stronger Piotroski score indicating financial resilience. Overall, MPWR offers a more favorable risk-adjusted profile due to its robust capital structure and superior profitability despite its volatility. Notably, MPWR’s high net margin (81%) contrasts sharply with STM’s 1.4%, underscoring concerns about STM’s operational efficiency in a challenging semiconductor cycle.
Final Verdict: Which stock to choose?
Monolithic Power Systems stands out as a cash-generating powerhouse with a durable competitive moat. Its ability to consistently deliver growing returns on invested capital signals strong capital allocation. A point of vigilance is its stretched current ratio, which may hint at overcapitalization. This stock suits aggressive growth portfolios seeking robust profitability.
STMicroelectronics offers a strategic moat grounded in diversified semiconductor manufacturing and steady R&D investment. While its profitability lags behind Monolithic, it presents a more conservative balance sheet and a stronger Piotroski score, reflecting financial resilience. It fits well with investors favoring GARP—growth at a reasonable price—with a margin of safety.
If you prioritize durable profitability and capital efficiency, Monolithic Power Systems outshines due to its superior ROIC and earnings growth. However, if stability and financial strength with moderate growth appeal more, STMicroelectronics offers better stability despite weaker profitability. Both present analytical scenarios tailored to distinct investor profiles.
Disclaimer: Investment carries a risk of loss of initial capital. The past performance is not a reliable indicator of future results. Be sure to understand risks before making an investment decision.
Go Further
I encourage you to read the complete analyses of Monolithic Power Systems, Inc. and STMicroelectronics N.V. to enhance your investment decisions: