Home > Comparison > Technology > MPWR vs SLAB
The strategic rivalry between Monolithic Power Systems, Inc. and Silicon Laboratories Inc. shapes the semiconductor sector’s evolution. Monolithic Power leads as an integrated power electronics innovator with broad end-market exposure. Silicon Laboratories operates as a fabless specialist focusing on analog mixed-signal solutions for IoT applications. This analysis contrasts their growth and capital models to identify which offers superior risk-adjusted returns for a diversified portfolio in today’s dynamic technology landscape.
Table of contents
Companies Overview
Monolithic Power Systems and Silicon Laboratories stand as key innovators in the semiconductor sector, shaping power and connectivity solutions worldwide.
Monolithic Power Systems, Inc.: Power Electronics Innovator
Monolithic Power Systems dominates the market for semiconductor-based power electronics. Its core revenue comes from DC to DC integrated circuits that regulate voltage in diverse devices such as computers, automotive systems, and medical equipment. In 2026, the company sharpens its focus on expanding applications in computing and industrial sectors, reinforcing its competitive edge in power management solutions.
Silicon Laboratories Inc.: IoT Connectivity Specialist
Silicon Laboratories excels as a fabless semiconductor company delivering mixed-signal and wireless microcontrollers. It generates revenue primarily from products serving Internet of Things (IoT) markets, including smart homes, industrial automation, and medical devices. In 2026, the firm prioritizes broadening its presence in IoT ecosystems, advancing sensor and wireless technologies to meet growing connectivity demands.
Strategic Collision: Similarities & Divergences
Both companies innovate within semiconductors but diverge in philosophy: Monolithic Power Systems focuses on power management solutions while Silicon Laboratories targets IoT connectivity and mixed-signal integration. Their primary battleground is embedded semiconductor technology for connected devices. This contrast defines distinct investment profiles—Monolithic Power emphasizes robust power solutions, whereas Silicon Labs bets on expanding IoT infrastructure.
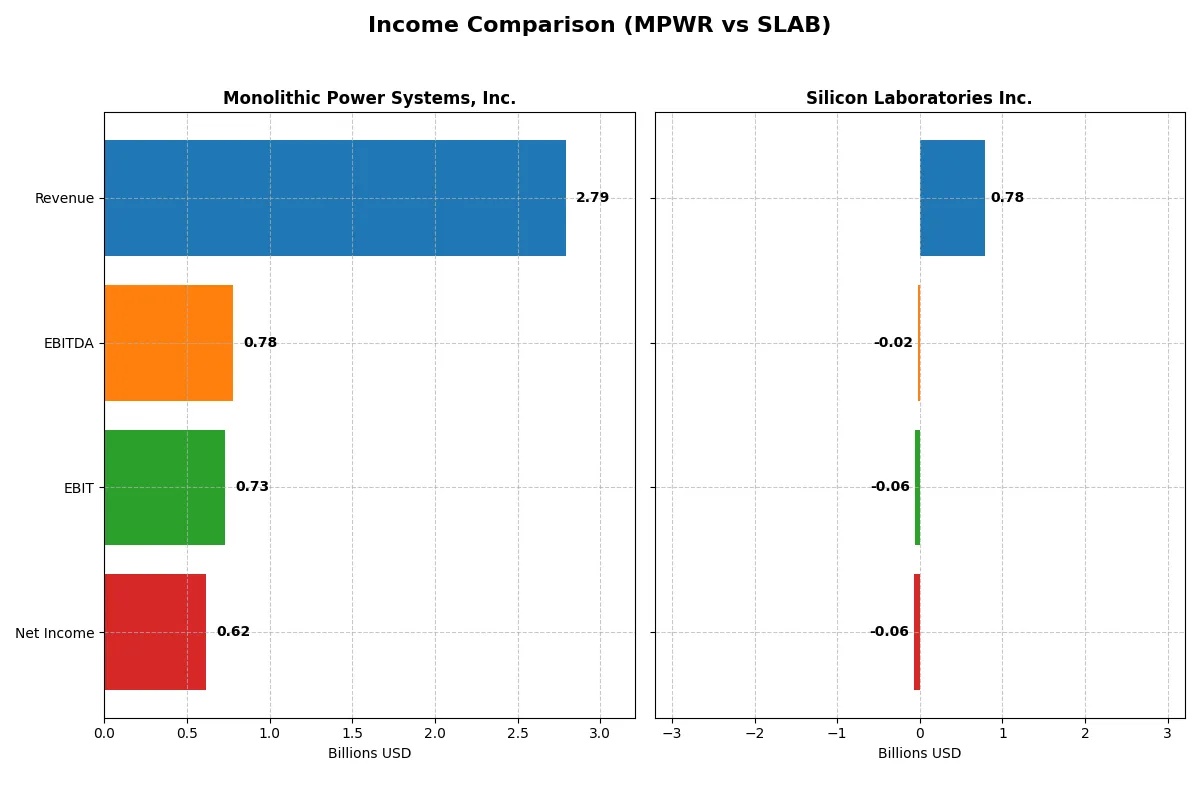
Income Statement Comparison
This data dissects the core profitability and scalability of both corporate engines to reveal who dominates the bottom line:
| Metric | Monolithic Power Systems, Inc. (MPWR) | Silicon Laboratories Inc. (SLAB) |
|---|---|---|
| Revenue | 2.79B | 785M |
| Cost of Revenue | 1.25B | 328M |
| Operating Expenses | 811M | 528M |
| Gross Profit | 1.54B | 457M |
| EBITDA | 780M | -19M |
| EBIT | 729M | -57M |
| Interest Expense | 0 | 975K |
| Net Income | 616M | -65M |
| EPS | 12.82 | -1.98 |
| Fiscal Year | 2025 | 2025 |
Income Statement Analysis: The Bottom-Line Duel
This income statement comparison uncovers the true efficiency and profitability of two semiconductor firms in a competitive market.
Monolithic Power Systems, Inc. Analysis
Monolithic Power Systems grew revenue from 1.2B in 2021 to 2.8B in 2025, with net income surging from 242M to 616M in 2025 despite a 2024 spike. Gross margin holds strong above 55%, and net margin remains favorable at 22%. Its 2025 momentum shows solid operational efficiency improving EBIT by 35% year-over-year.
Silicon Laboratories Inc. Analysis
Silicon Laboratories saw revenue climb from 721M in 2021 to 785M in 2025, but net income remains negative at -65M in 2025 after a 2024 loss of -191M. While gross margin at 58% is healthy, EBIT and net margins remain unfavorable. The company improved EBIT by 63% in 2025 but still struggles to reach profitability.
Margin Power vs. Revenue Scale
Monolithic Power Systems outperforms Silicon Laboratories with superior revenue scale, consistent net income growth, and healthier margins. Silicon Labs shows strong topline growth and margin improvement but still posts losses. Investors seeking stability may prefer Monolithic’s scalable profit engine, while Silicon Labs suits those betting on a turnaround.
Financial Ratios Comparison
These vital ratios act as a diagnostic tool to expose the underlying fiscal health, valuation premiums, and capital efficiency of the companies compared below:
| Ratios | Monolithic Power Systems, Inc. (MPWR) | Silicon Laboratories Inc. (SLAB) |
|---|---|---|
| ROE | 16.6% | -5.9% |
| ROIC | 14.9% | -6.3% |
| P/E | 70.7 | -65.9 |
| P/B | 11.7 | 3.91 |
| Current Ratio | 5.91 | 4.69 |
| Quick Ratio | 4.38 | 4.02 |
| D/E | 0.00 | 0.00 |
| Debt-to-Assets | 0.00 | 0.00 |
| Interest Coverage | N/A | -72.3 |
| Asset Turnover | 0.65 | 0.62 |
| Fixed Asset Turnover | 4.45 | 6.10 |
| Payout ratio | 46.2% | 0.0% |
| Dividend yield | 0.65% | 0.0% |
| Fiscal Year | 2025 | 2025 |
Efficiency & Valuation Duel: The Vital Signs
Ratios act as a company’s DNA, uncovering hidden risks and operational strengths that raw numbers alone cannot reveal.
Monolithic Power Systems, Inc.
Monolithic Power Systems demonstrates strong profitability with a 16.55% ROE and a healthy 22.07% net margin. However, its valuation appears stretched, reflected in a high P/E of 70.69 and P/B of 11.7. The company returns value through a modest 0.65% dividend yield, balancing shareholder payouts with reinvestment in R&D (13.7% of revenue).
Silicon Laboratories Inc.
Silicon Laboratories struggles with negative profitability, posting a -5.93% ROE and -8.27% net margin, signaling operational challenges. Its P/E ratio is negative due to losses, while a P/B of 3.91 shows moderate valuation pressure. The company provides no dividends, focusing heavily on R&D (45% of revenue) to drive future growth despite current inefficiencies.
Premium Valuation vs. Operational Safety
Monolithic Power offers superior profitability and a favorable global ratio profile, though at a premium valuation. Silicon Laboratories faces operational headwinds and weaker financial health but invests aggressively in innovation. Investors seeking stability may prefer Monolithic Power, while those targeting turnaround potential might consider Silicon Laboratories’ growth focus.
Which one offers the Superior Shareholder Reward?
I compare Monolithic Power Systems (MPWR) and Silicon Laboratories (SLAB) on dividends, payout ratios, and buybacks. MPWR pays a modest dividend yield around 0.65–0.83% with payout ratios near 13–46%, supported by strong free cash flow. SLAB pays no dividends, reinvesting cash into R&D and growth. MPWR maintains a consistent buyback program, enhancing shareholder returns and signaling confidence. SLAB shows no buybacks, relying on growth to create value. Historically, MPWR’s dividend and buyback mix offers more sustainable, immediate shareholder rewards. I conclude MPWR delivers a superior total return profile for 2026 investors.
Comparative Score Analysis: The Strategic Profile
The radar chart reveals the fundamental DNA and trade-offs of Monolithic Power Systems and Silicon Laboratories Inc., highlighting their distinct financial strengths and weaknesses:
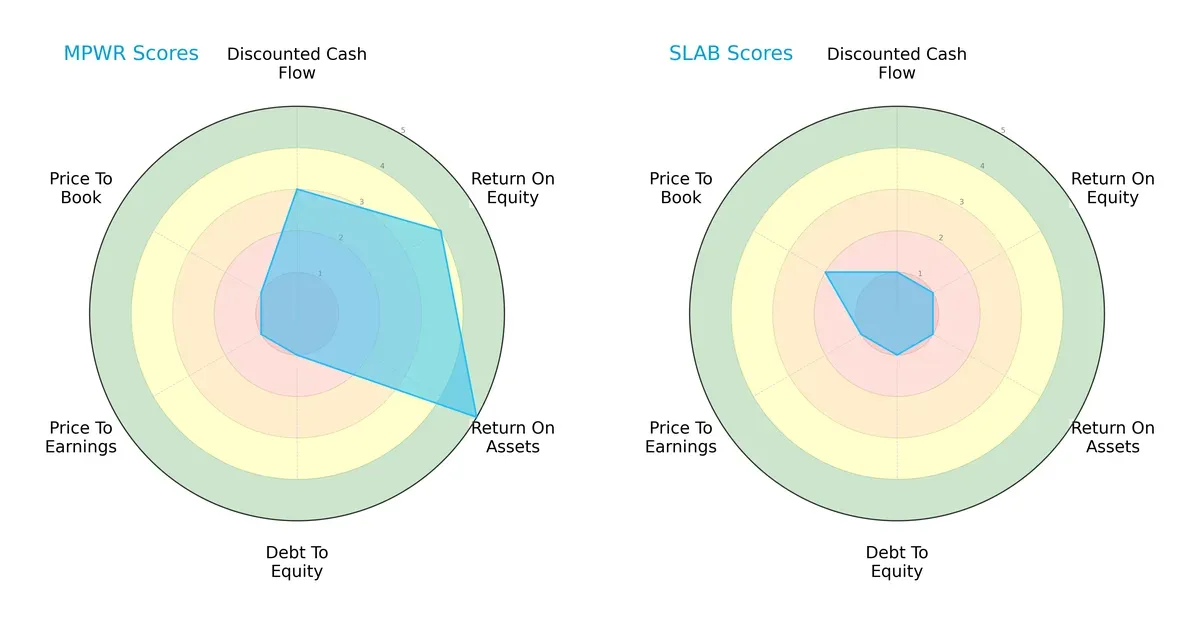
Monolithic Power Systems (MPWR) excels in return on assets (5) and equity (4), showing operational efficiency. Silicon Laboratories (SLAB) lags with scores of 1 across these metrics. Both suffer from high debt-to-equity risk (1), but MPWR’s valuation scores (P/E 1, P/B 1) indicate undervaluation concerns. MPWR’s profile is more balanced, leveraging profitability over valuation, while SLAB depends on a narrow, weak financial base.
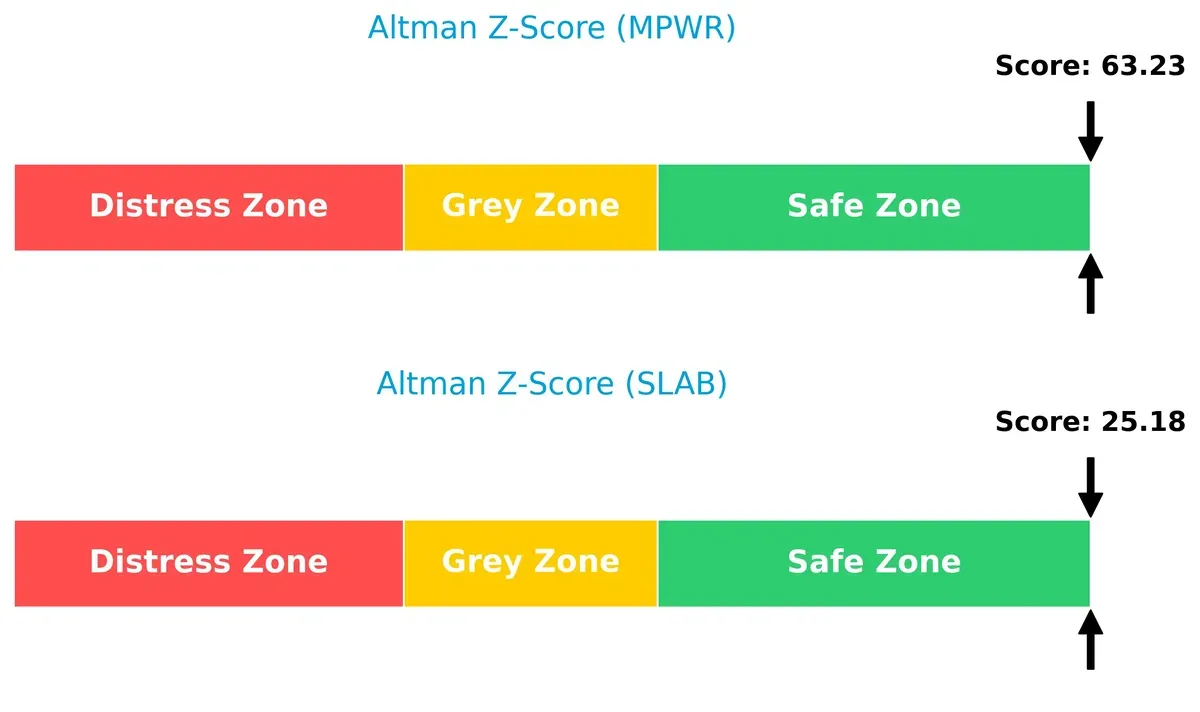
Bankruptcy Risk: Solvency Showdown
The Altman Z-Score gap favors Monolithic Power Systems (63.2) over Silicon Laboratories (25.2), both well within the safe zone, signaling robust long-term survival prospects in this cycle:
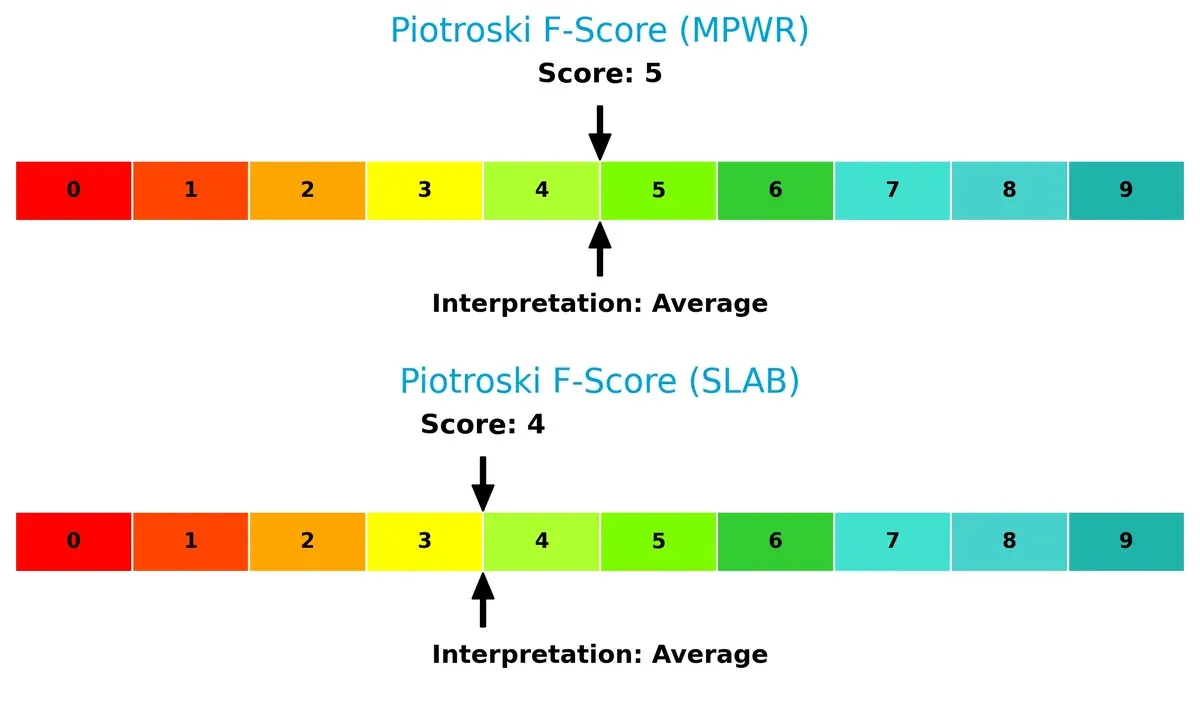
Financial Health: Quality of Operations
Monolithic Power Systems scores a Piotroski 5, slightly edging Silicon Laboratories’ 4, reflecting moderate financial health. Neither shows red flags, but MPWR holds a marginally stronger internal quality:
How are the two companies positioned?
This section dissects the operational DNA of MPWR and SLAB by comparing their revenue distribution by segment alongside their internal strengths and weaknesses. The ultimate goal is to confront their economic moats to reveal which model offers the most resilient and sustainable competitive advantage in today’s semiconductor market.
Revenue Segmentation: The Strategic Mix
The following visual comparison dissects how Monolithic Power Systems and Silicon Laboratories diversify their income streams and where their primary sector bets lie:
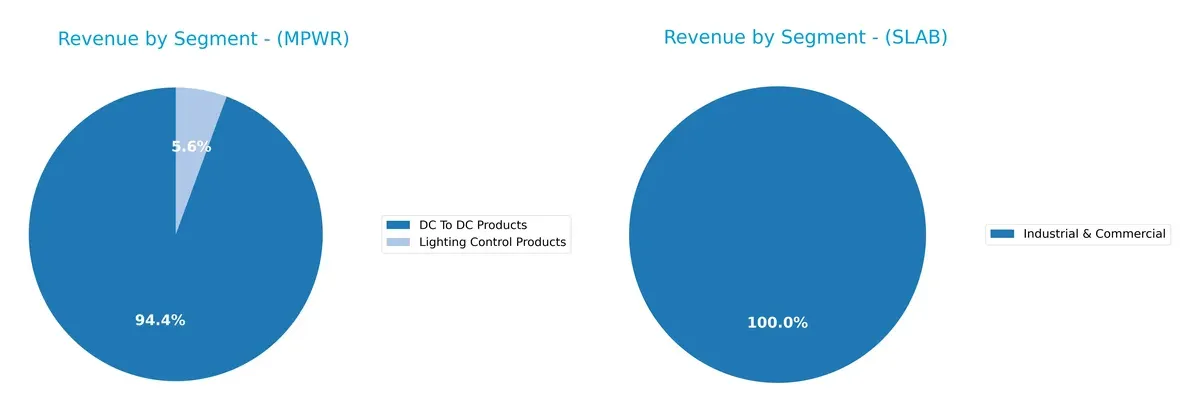
Monolithic Power Systems anchors its revenue heavily on DC To DC Products, generating $1.72B in 2023, with Lighting Control at a modest $102M. In contrast, Silicon Laboratories shows a more diversified portfolio but currently depends primarily on Industrial & Commercial, with $496M in 2023. MPWR’s concentration signals a strong moat in power conversion, while SLAB’s broader mix reduces single-segment risk, though the reliance on Industrial & Commercial demands vigilance.
Strengths and Weaknesses Comparison
This table compares the strengths and weaknesses of Monolithic Power Systems, Inc. and Silicon Laboratories Inc. based on diversification, profitability, financials, innovation, global presence, and market share:
Monolithic Power Systems Strengths
- High net margin at 22.07%
- Strong ROE of 16.55%
- Favorable ROIC of 14.93%
- Zero debt and infinite interest coverage
- Diverse revenue from DC To DC and Lighting Control products
- Broad global presence with significant revenues in China and Taiwan
Silicon Laboratories Strengths
- Possesses favorable PE ratio despite losses
- Maintains zero debt with some favorable coverage ratios
- Revenue spread across Industrial & Commercial segment
- Global sales include China, Taiwan, and Rest of World
- Higher fixed asset turnover indicating efficient asset use
Monolithic Power Systems Weaknesses
- Unfavorable high P/E of 70.69 and P/B of 11.7
- Unfavorable current ratio at 5.91 suggesting potential liquidity management issues
- WACC higher than ROIC, signaling capital cost concerns
- Low dividend yield at 0.65%
Silicon Laboratories Weaknesses
- Negative net margin (-8.27%), ROE (-5.93%), and ROIC (-6.27%) indicate profitability struggles
- Unfavorable interest coverage at -58.4 signals risk
- Unfavorable current ratio of 4.69
- Zero dividend yield
Both companies demonstrate solid global footprints and zero debt, but Monolithic Power leads on profitability and capital efficiency. Silicon Laboratories faces profitability and liquidity challenges despite some operational strengths. These factors could influence each company’s strategic focus on improving financial health and leveraging global markets.
The Moat Duel: Analyzing Competitive Defensibility
A structural moat is the only barrier protecting long-term profits from relentless competition erosion. Let’s dissect the core competitive advantages of these two semiconductor firms:
Monolithic Power Systems, Inc.: Cost Advantage with High ROIC
Monolithic Power leverages a cost advantage through efficient power electronics design, reflected in a robust 26% EBIT margin and 4.3% ROIC premium over WACC. Despite a slight ROIC decline, expanding into automotive and industrial markets in 2026 could deepen its moat.
Silicon Laboratories Inc.: Innovation-Driven Network Effects Under Pressure
Silicon Labs relies on innovation and IoT network effects but suffers from negative EBIT and a steep ROIC shortfall versus WACC. While recent revenue growth is strong, profitability erosion threatens its competitive positioning unless new breakthroughs materialize in 2026.
Sustained Value Creation vs. Profitability Erosion
Monolithic Power holds the wider and deeper moat, consistently creating value with superior margins and capital efficiency. Silicon Labs faces a steep uphill battle defending market share amid persistent value destruction and declining profitability.
Which stock offers better returns?
The past year shows strong price appreciation for both stocks, with Monolithic Power Systems leading in gains and Silicon Laboratories exhibiting steady upward momentum amid rising volumes.
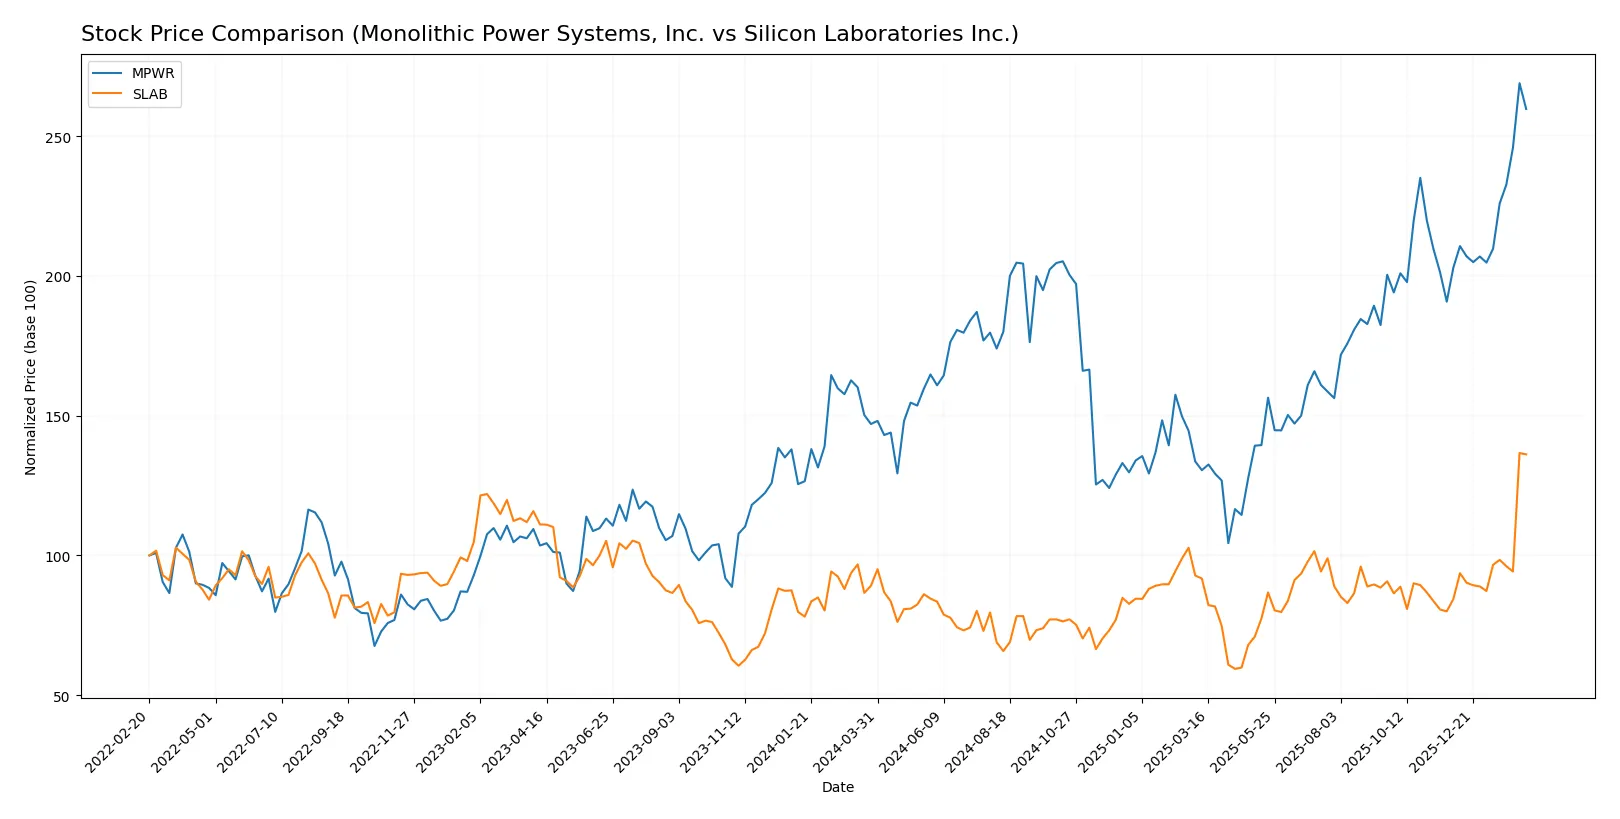
Trend Comparison
Monolithic Power Systems, Inc. (MPWR) posted a 76.66% price increase over the past 12 months, reflecting a bullish trend with accelerating momentum and notable volatility (std dev 155.88). The stock’s price ranged from 477.39 to 1229.82.
Silicon Laboratories Inc. (SLAB) gained 52.73% over the same period, also bullish with acceleration. Its price fluctuated within a tighter band (lowest 89.82, highest 206.5) and showed less volatility (std dev 18.03).
MPWR delivered stronger overall market performance than SLAB, with a higher percentage gain and accelerating trend, despite greater price volatility.
Target Prices
Analysts show a bullish consensus for both Monolithic Power Systems and Silicon Laboratories.
| Company | Target Low | Target High | Consensus |
|---|---|---|---|
| Monolithic Power Systems, Inc. | 1,200 | 1,500 | 1,314 |
| Silicon Laboratories Inc. | 160 | 231 | 212 |
The target consensus for Monolithic Power Systems exceeds its current price of $1,190, signaling upside potential. Silicon Laboratories’ consensus also sits above its $206 price, indicating moderate expected gains.

Don’t Let Luck Decide Your Entry Point
Optimize your entry points with our advanced ProRealTime indicators. You’ll get efficient buy signals with precise price targets for maximum performance. Start outperforming now!
How do institutions grade them?
The following tables summarize recent institutional grades for Monolithic Power Systems, Inc. and Silicon Laboratories Inc.:
Monolithic Power Systems, Inc. Grades
This table shows the latest grades from reputable financial institutions for MPWR:
| Grading Company | Action | New Grade | Date |
|---|---|---|---|
| Rosenblatt | Maintain | Neutral | 2026-02-06 |
| Needham | Maintain | Buy | 2026-02-06 |
| Keybanc | Maintain | Overweight | 2026-02-06 |
| Wells Fargo | Maintain | Overweight | 2026-02-06 |
| Truist Securities | Maintain | Buy | 2026-02-06 |
| Stifel | Maintain | Buy | 2026-02-04 |
| Wells Fargo | Maintain | Overweight | 2026-01-26 |
| Wells Fargo | Upgrade | Overweight | 2026-01-15 |
| Truist Securities | Maintain | Buy | 2025-12-19 |
| Citigroup | Maintain | Buy | 2025-11-03 |
Silicon Laboratories Inc. Grades
This table shows the latest grades from reputable financial institutions for SLAB:
| Grading Company | Action | New Grade | Date |
|---|---|---|---|
| Citigroup | Maintain | Neutral | 2026-02-06 |
| RBC Capital | Maintain | Sector Perform | 2026-02-05 |
| Keybanc | Downgrade | Sector Weight | 2026-02-04 |
| Benchmark | Downgrade | Hold | 2026-02-04 |
| Needham | Downgrade | Hold | 2026-02-04 |
| Susquehanna | Maintain | Neutral | 2025-08-06 |
| Morgan Stanley | Maintain | Equal Weight | 2025-08-06 |
| Barclays | Maintain | Equal Weight | 2025-08-05 |
| Susquehanna | Maintain | Neutral | 2025-07-22 |
| Stifel | Maintain | Buy | 2025-07-18 |
Which company has the best grades?
Monolithic Power Systems consistently receives stronger grades, mainly Buy and Overweight. Silicon Laboratories shows multiple downgrades to Hold and Sector Weight. This grading divergence signals differing institutional confidence levels, impacting investor perception and risk assessment.
Risks specific to each company
The following categories identify the critical pressure points and systemic threats facing both firms in the 2026 market environment:
1. Market & Competition
Monolithic Power Systems, Inc.
- Strong market cap and product diversification support resilience against competition.
Silicon Laboratories Inc.
- Smaller market cap and negative profit margins increase vulnerability in a competitive semiconductor sector.
2. Capital Structure & Debt
Monolithic Power Systems, Inc.
- Zero debt and infinite interest coverage demonstrate a rock-solid balance sheet.
Silicon Laboratories Inc.
- Zero debt but negative interest coverage signals operational losses and financial strain.
3. Stock Volatility
Monolithic Power Systems, Inc.
- Beta of 1.455 indicates moderate volatility, typical for tech growth stocks.
Silicon Laboratories Inc.
- Higher beta of 1.536 suggests greater stock price swings and investor risk.
4. Regulatory & Legal
Monolithic Power Systems, Inc.
- No major regulatory issues noted; semiconductor industry faces ongoing export controls risks.
Silicon Laboratories Inc.
- Exposure to IoT regulations and data security laws may increase compliance costs.
5. Supply Chain & Operations
Monolithic Power Systems, Inc.
- Global sales and diversified supply routes mitigate single-region supply shocks.
Silicon Laboratories Inc.
- Reliance on mixed-signal product segments could amplify disruptions in specialized supply chains.
6. ESG & Climate Transition
Monolithic Power Systems, Inc.
- Limited ESG data but semiconductor firms face increasing pressure to reduce carbon footprint.
Silicon Laboratories Inc.
- Growing IoT product portfolio may face scrutiny over energy use and sustainability practices.
7. Geopolitical Exposure
Monolithic Power Systems, Inc.
- Significant exposure to China and Asia-Pacific markets introduces risks from trade tensions.
Silicon Laboratories Inc.
- Similar geographic exposure with potential impact from US-China tech conflicts on supply and sales.
Which company shows a better risk-adjusted profile?
Monolithic Power Systems’ strongest risk is valuation stretched by a high P/E and P/B ratio. Silicon Laboratories faces the critical threat of sustained unprofitability and weak financial ratios. MPWR’s zero debt and solid Altman Z-score place it in a far safer financial zone. SLAB’s negative margins and interest coverage raise red flags about ongoing viability. MPWR’s robust balance sheet and moderate volatility suggest a better risk-adjusted profile despite valuation concerns, while SLAB requires cautious monitoring due to operational losses and financial instability.
Final Verdict: Which stock to choose?
Monolithic Power Systems, Inc. (MPWR) shines with its superpower: a robust cash-generating engine paired with a strong economic moat. Its ability to consistently create value despite a slightly declining ROIC trend is notable. A point of vigilance remains its high valuation multiples and stretched current ratio. MPWR suits an Aggressive Growth portfolio looking for quality tech exposure.
Silicon Laboratories Inc. (SLAB) leverages a strategic moat rooted in its focused R&D investment and niche market positioning, though it currently sheds value with negative returns on invested capital. SLAB offers a comparatively safer balance sheet than expected given its challenges, fitting more conservative GARP portfolios that can tolerate turnaround stories.
If you prioritize sustained value creation and robust profitability, MPWR is the compelling choice due to its solid moat and strong cash flow despite premium valuation. However, if you seek a potential turnaround with R&D-driven growth and relative balance sheet safety, SLAB offers better stability at a more modest valuation. Both present distinct analytical scenarios based on your risk tolerance and portfolio strategy.
Disclaimer: Investment carries a risk of loss of initial capital. The past performance is not a reliable indicator of future results. Be sure to understand risks before making an investment decision.
Go Further
I encourage you to read the complete analyses of Monolithic Power Systems, Inc. and Silicon Laboratories Inc. to enhance your investment decisions: