In the ever-evolving semiconductor industry, Monolithic Power Systems, Inc. (MPWR) and Qnity Electronics, Inc. (Q) stand out as innovative players shaping the future of electronic solutions. Both companies operate within the technology sector, focusing on advanced semiconductor technologies but with distinct market approaches and product offerings. This article will explore their strengths and strategies to help you decide which company presents the most compelling investment opportunity in 2026.

Table of contents
Companies Overview
I will begin the comparison between Monolithic Power Systems and Qnity Electronics by providing an overview of these two companies and their main differences.
Monolithic Power Systems Overview
Monolithic Power Systems, Inc. designs and markets semiconductor-based power electronics solutions for various markets including computing, automotive, and industrial sectors. The company specializes in DC to DC integrated circuits used for voltage control in devices such as portable electronics and medical equipment. Founded in 1997 and headquartered in Kirkland, Washington, it operates globally with a market capitalization of approximately 48.4B USD.
Qnity Electronics Overview
Qnity Electronics, Inc. provides electronic solutions and advanced materials for semiconductor chip manufacturing. Formerly known as Novus SpinCo 1, it rebranded to Qnity Electronics in April 2025. Based in Wilmington, Delaware, the company focuses on the semiconductor materials industry and has a market capitalization near 19.5B USD. It went public in October 2025 and operates within the technology sector.
Key similarities and differences
Both companies operate in the semiconductor industry within the technology sector and trade on major U.S. exchanges—Monolithic Power Systems on NASDAQ and Qnity Electronics on NYSE. While Monolithic Power develops a broad range of power electronics products sold worldwide, Qnity concentrates on semiconductor manufacturing materials. Their market caps and product focuses differ significantly, reflecting distinct business models within the semiconductor ecosystem.
Income Statement Comparison
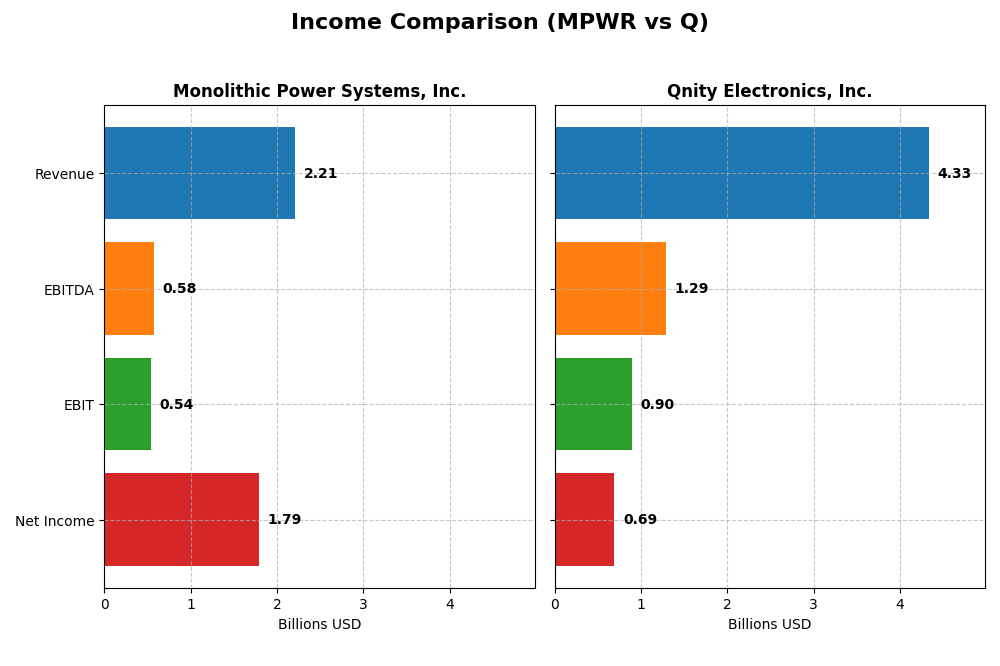
The table below presents a side-by-side comparison of key income statement metrics for Monolithic Power Systems, Inc. and Qnity Electronics, Inc. for the fiscal year 2024.
| Metric | Monolithic Power Systems, Inc. | Qnity Electronics, Inc. |
|---|---|---|
| Market Cap | 48.4B | 19.5B |
| Revenue | 2.21B | 4.34B |
| EBITDA | 576M | 1.29B |
| EBIT | 539M | 898M |
| Net Income | 1.79B | 693M |
| EPS | 36.76 | 3.31 |
| Fiscal Year | 2024 | 2024 |
Income Statement Interpretations
Monolithic Power Systems, Inc.
Monolithic Power Systems showed strong revenue growth from 2020 to 2024, culminating in $2.21B in 2024, with net income surging to $1.79B. Margins improved consistently, with a gross margin of 55.32% and an impressive net margin of 80.95% in 2024. The latest year saw significant net income and EPS growth, although operating expenses grew at the same pace as revenue.
Qnity Electronics, Inc.
Qnity Electronics recorded revenue of $4.34B in 2024, up moderately from prior years, while net income reached $693M. Its gross margin stood at 46.11%, with a net margin of 15.99%. The company experienced favorable EBIT and net margin growth in 2024, but overall revenue and net income declined over the full period from 2022 to 2024, reflecting some challenges in sustaining long-term growth.
Which one has the stronger fundamentals?
Monolithic Power Systems exhibits stronger fundamentals with robust revenue and net income growth over five years, superior margins, and a high percentage of favorable income statement metrics. Qnity Electronics shows recent operational improvements but faces unfavorable long-term revenue and income trends, with lower margins and some neutral to unfavorable financial indicators.
Financial Ratios Comparison
Below is a comparison of key financial ratios for Monolithic Power Systems, Inc. (MPWR) and Qnity Electronics, Inc. (Q) based on their most recent fiscal year data.
| Ratios | Monolithic Power Systems, Inc. (MPWR) | Qnity Electronics, Inc. (Q) |
|---|---|---|
| ROE | 56.8% | 6.5% |
| ROIC | 16.2% | 5.9% |
| P/E | 16.1 | 28.8 |
| P/B | 9.14 | 1.88 |
| Current Ratio | 5.31 | 1.77 |
| Quick Ratio | 3.89 | 1.06 |
| D/E (Debt-to-Equity Ratio) | 0.0050 | 0.018 |
| Debt-to-Assets | 0.44% | 1.56% |
| Interest Coverage | 0 (not available) | 3.03 |
| Asset Turnover | 0.61 | 0.35 |
| Fixed Asset Turnover | 4.17 | 2.59 |
| Payout Ratio | 13.5% | 0% |
| Dividend Yield | 0.84% | 0% |
Interpretation of the Ratios
Monolithic Power Systems, Inc.
Monolithic Power Systems shows predominantly strong ratios, with high net margin (80.95%) and return on equity (56.8%), indicating efficient profitability and shareholder value creation. Some concerns include an unfavorable weighted average cost of capital (10.64%) and a high price-to-book ratio (9.14). The company pays dividends with a modest yield of 0.84%, supported by free cash flow, but the yield is relatively low compared to peers.
Qnity Electronics, Inc.
Qnity Electronics displays moderate profitability with a net margin of 15.99% but a low return on equity of 6.51%, which is unfavorable. The company benefits from a low cost of capital (5.8%) and solid liquidity ratios, yet asset turnover is weak at 0.35. Qnity does not pay dividends, likely reflecting reinvestment in growth or R&D, consistent with its recent IPO and focus on advanced materials.
Which one has the best ratios?
Monolithic Power Systems has a more favorable overall ratio profile, with better profitability and returns despite some valuation and liquidity concerns. Qnity Electronics shows a more cautious picture, with less robust returns and no dividend distribution, but maintains good liquidity and capital structure. The choice depends on investor priorities between profitability and growth potential.
Strategic Positioning
This section compares the strategic positioning of Monolithic Power Systems, Inc. and Qnity Electronics, Inc., including market position, key segments, and exposure to technological disruption:
Monolithic Power Systems, Inc.
- Market leader in semiconductor power electronics with significant competitive pressure in multiple regions.
- Key segments include DC to DC integrated circuits and lighting control ICs driving revenue growth.
- Faces disruption risks from evolving semiconductor technologies but leverages diversified product applications.
Qnity Electronics, Inc.
- Newer market entrant focusing on semiconductor chip materials with emerging competitive dynamics.
- Concentrated on electronic solutions and advanced materials for semiconductor chip manufacturing.
- Exposure to technological change inherent in semiconductor materials but limited diversification.
Monolithic Power Systems, Inc. vs Qnity Electronics, Inc. Positioning
Monolithic Power Systems pursues a diversified strategy across multiple electronic markets, providing resilience and broad business drivers. Qnity Electronics targets a concentrated niche in semiconductor materials, which may limit revenue sources but allows focused specialization.
Which has the best competitive advantage?
Monolithic Power Systems shows a very favorable moat with growing ROIC above WACC, indicating durable competitive advantage and efficient capital use. Qnity Electronics has a neutral moat with stable profitability and no clear competitive edge yet.
Stock Comparison
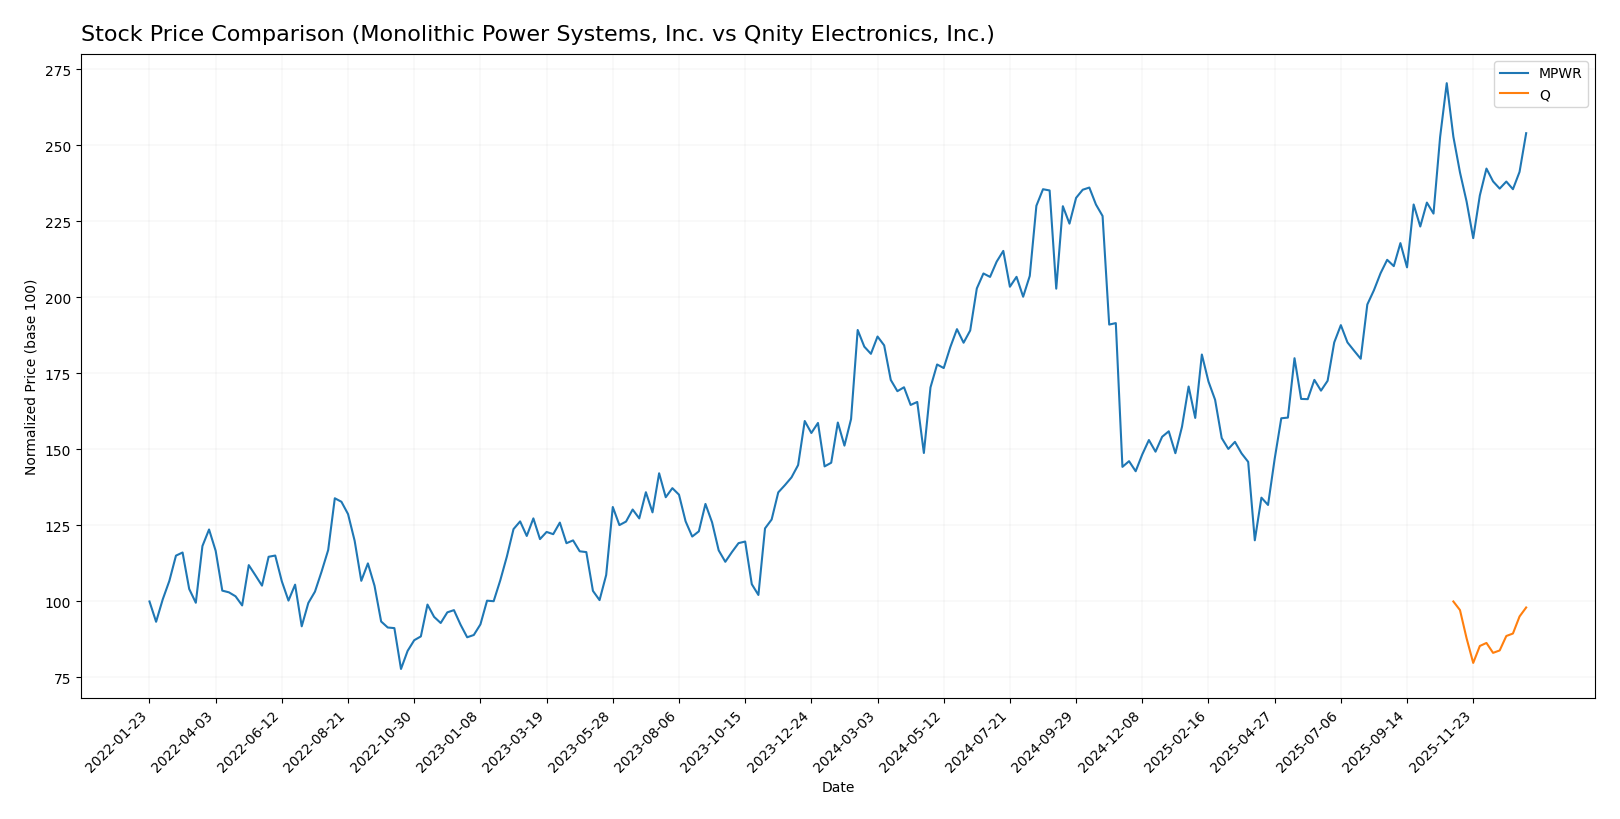
The stock prices of Monolithic Power Systems, Inc. (MPWR) and Qnity Electronics, Inc. (Q) exhibited contrasting dynamics over the past 12 months, with MPWR showing strong gains and Q remaining essentially flat amid stable trading volumes.
Trend Analysis
Monolithic Power Systems, Inc. (MPWR) posted a robust 39.99% price increase over the past year, indicating a clear bullish trend with accelerating momentum and a high volatility level reflected by a 135.81 standard deviation.
Qnity Electronics, Inc. (Q) experienced a -1.98% price change, classified as a bearish trend, although close to neutral territory, with stable trend acceleration and low volatility at a 5.94 standard deviation.
Comparing both, MPWR delivered the highest market performance with a substantial bullish trend, while Q showed a marginal bearish trend with less price movement and volume contraction.
Target Prices
The target price consensus from recognized analysts shows promising upside potential for both companies in the semiconductor sector.
| Company | Target High | Target Low | Consensus |
|---|---|---|---|
| Monolithic Power Systems, Inc. | 1375 | 1025 | 1187.5 |
| Qnity Electronics, Inc. | 117 | 92 | 105.89 |
Analysts expect Monolithic Power Systems to trade significantly above its current price of 1009.54 USD, while Qnity Electronics shows upside from its current 93.12 USD, indicating generally optimistic outlooks.
Analyst Opinions Comparison
This section compares analysts’ ratings and grades for Monolithic Power Systems, Inc. (MPWR) and Qnity Electronics, Inc. (Q):
Rating Comparison
MPWR Rating
- Rating: A-, indicating a very favorable assessment by analysts.
- Discounted Cash Flow Score: Moderate at 3, showing balanced valuation based on cash flows.
- ROE Score: Very favorable at 5, indicating excellent profit generation from equity.
- ROA Score: Very favorable at 5, showing excellent asset utilization.
- Debt To Equity Score: Very favorable at 5, reflecting strong financial stability.
- Overall Score: Favorable at 4, summarizing strong financial standing.
Q Rating
- Rating: B+, also very favorable but lower than MPWR’s rating.
- Discounted Cash Flow Score: Favorable at 4, suggesting better future cash flow valuation.
- ROE Score: Moderate at 3, less efficient profit generation compared to MPWR.
- ROA Score: Favorable at 4, good but lower asset efficiency than MPWR.
- Debt To Equity Score: Moderate at 3, indicating higher financial risk than MPWR.
- Overall Score: Moderate at 3, indicating average overall financial health.
Which one is the best rated?
Based on the provided data, MPWR holds a higher overall rating and superior scores in ROE, ROA, and debt to equity, reflecting stronger financial performance and stability than Q, which has a better discounted cash flow score but overall moderate ratings.
Scores Comparison
Here is a comparison of the Altman Z-Score and Piotroski Score for the companies:
MPWR Scores
- Altman Z-Score: 46.83, indicating a safe zone with low risk.
- Piotroski Score: 4, reflecting average financial strength.
Q Scores
- No data available.
- No data available.
Which company has the best scores?
Based on the available data, MPWR shows a very strong Altman Z-Score in the safe zone and an average Piotroski Score, while Q’s scores are unavailable for comparison. Therefore, MPWR currently holds the best documented scores.
Grades Comparison
Here is the grades comparison of Monolithic Power Systems, Inc. and Qnity Electronics, Inc.:
Monolithic Power Systems, Inc. Grades
The following table shows recent grades from reliable financial institutions for Monolithic Power Systems, Inc.:
| Grading Company | Action | New Grade | Date |
|---|---|---|---|
| Truist Securities | Maintain | Buy | 2025-12-19 |
| Citigroup | Maintain | Buy | 2025-11-03 |
| TD Cowen | Maintain | Buy | 2025-10-31 |
| Keybanc | Maintain | Overweight | 2025-10-31 |
| Rosenblatt | Maintain | Neutral | 2025-10-31 |
| Keybanc | Maintain | Overweight | 2025-10-23 |
| Wells Fargo | Maintain | Equal Weight | 2025-10-20 |
| Stifel | Maintain | Buy | 2025-10-17 |
| Wolfe Research | Upgrade | Outperform | 2025-10-14 |
| Citigroup | Maintain | Buy | 2025-10-03 |
Monolithic Power Systems has a strong consensus with mostly Buy and Overweight ratings, including a recent upgrade to Outperform, indicating steady positive sentiment.
Qnity Electronics, Inc. Grades
Below are the recent grades for Qnity Electronics, Inc. from reputable grading firms:
| Grading Company | Action | New Grade | Date |
|---|---|---|---|
| RBC Capital | Maintain | Outperform | 2025-11-25 |
| Mizuho | Maintain | Outperform | 2025-11-20 |
Qnity Electronics holds a consistent Outperform rating from two respected sources, reflecting positive analyst confidence.
Which company has the best grades?
Monolithic Power Systems shows a broader range of analyst coverage with predominantly Buy and Overweight grades, while Qnity Electronics maintains consistent Outperform ratings but from fewer sources. Investors may view Monolithic Power as having wider market validation, whereas Qnity’s focused positive ratings suggest strong but less diversified analyst support.
Strengths and Weaknesses
Here is a comparative overview of key strengths and weaknesses for Monolithic Power Systems, Inc. (MPWR) and Qnity Electronics, Inc. (Q):
| Criterion | Monolithic Power Systems, Inc. (MPWR) | Qnity Electronics, Inc. (Q) |
|---|---|---|
| Diversification | Focused on power solutions with strong DC to DC product sales (~$1.7B in 2023); relatively narrow product range | Limited diversification; no recent product revenue data available |
| Profitability | High net margin (80.95%), favorable ROE (56.8%) and ROIC (16.22%) | Moderate net margin (15.99%), low ROE (6.51%), neutral ROIC (5.92%) |
| Innovation | Growing ROIC trend (+11.8%), indicating durable competitive advantage and innovation | Stable but neutral ROIC trend; no clear moat or innovation advantage |
| Global presence | Strong global moat status with increasing profitability | Neutral moat status, stable profitability but no clear competitive edge |
| Market Share | Large and growing revenue in key segments, especially DC to DC power products | Market share unclear due to lack of detailed revenue data |
In summary, MPWR shows strong financial health, profitability, and a durable competitive advantage supported by steady innovation and solid market presence. Conversely, Q struggles with lower profitability and lacks clear signs of sustainable competitive strength, warranting cautious consideration.
Risk Analysis
Below is a comparative table highlighting key risks for Monolithic Power Systems, Inc. (MPWR) and Qnity Electronics, Inc. (Q) based on the most recent data from 2024 and market context in 2026:
| Metric | Monolithic Power Systems, Inc. (MPWR) | Qnity Electronics, Inc. (Q) |
|---|---|---|
| Market Risk | Beta 1.456 indicating higher volatility | Beta 0, implying low market volatility but limited trading history risks |
| Debt level | Very low debt/equity ratio (0.01) and debt to assets 0.44% | Low debt ratio (0.02), manageable financial risk |
| Regulatory Risk | Exposure to international markets with complex semiconductor regulations | Newly public with evolving regulatory compliance post-IPO |
| Operational Risk | Established supply chain but semiconductor industry cyclicality | Early-stage operational risks due to recent IPO and scaling challenges |
| Environmental Risk | Moderate, with increasing industry focus on energy-efficient semiconductors | Potential risks from materials sourcing and manufacturing processes |
| Geopolitical Risk | Significant exposure to Asia-Pacific markets with ongoing trade tensions | Moderate exposure, focused on US market but dependent on global supply chain |
The most impactful and likely risks for MPWR are market volatility amplified by a high beta and geopolitical tensions affecting supply chains in Asia. For Q, operational and regulatory risks linked to its recent market debut and scaling are critical. Both companies maintain low debt, mitigating financial distress risk.
Which Stock to Choose?
Monolithic Power Systems, Inc. (MPWR) shows strong income growth with a 21.2% revenue increase in 2024 and favorable profitability metrics, including an 80.95% net margin and a 56.8% ROE. Its debt levels are low, and its overall financial ratios are mostly favorable, supported by a very favorable A- rating and a very favorable economic moat indicating durable competitive advantage.
Qnity Electronics, Inc. (Q) experienced moderate revenue growth at 7.43% in 2024 with a 15.99% net margin but lower profitability ratios such as 6.51% ROE. Debt levels remain manageable, and its financial ratios are slightly favorable overall. The company holds a very favorable B+ rating but displays a neutral economic moat, suggesting stable profitability without a strong competitive edge.
Investors focused on growth and strong profitability may find MPWR’s favorable rating and robust income statement metrics more appealing, while those seeking moderate growth with stable fundamentals might consider Q’s slightly favorable rating and steadier income trends. The choice could depend on the investor’s tolerance for risk and preference for economic moat strength.
Disclaimer: Investment carries a risk of loss of initial capital. The past performance is not a reliable indicator of future results. Be sure to understand risks before making an investment decision.
Go Further
I encourage you to read the complete analyses of Monolithic Power Systems, Inc. and Qnity Electronics, Inc. to enhance your investment decisions: