Home > Comparison > Technology > NXPI vs MPWR
The strategic rivalry between NXP Semiconductors N.V. and Monolithic Power Systems, Inc. shapes the semiconductor sector’s future. NXP operates as a broad-based semiconductor giant with diversified product lines, while Monolithic Power focuses on high-margin power electronics ICs. This head-to-head pits scale and diversification against specialized innovation. This analysis will assess which corporate trajectory offers superior risk-adjusted returns for a diversified portfolio in a volatile tech landscape.
Table of contents
Companies Overview
NXP Semiconductors and Monolithic Power Systems both wield strong influence in the competitive semiconductor market.
NXP Semiconductors N.V.: Global Semiconductor Innovator
NXP dominates as a leading semiconductor supplier with a broad product portfolio including microcontrollers, application processors, and wireless connectivity solutions. Its core revenue stems from supplying automotive, industrial, and IoT sectors globally. In 2026, NXP focuses strategically on expanding secure connectivity and integrated sensor technologies to capture growth in automotive and communication infrastructure.
Monolithic Power Systems, Inc.: Power Electronics Specialist
Monolithic Power excels as a designer of power electronics ICs, particularly DC to DC converters and lighting control chips. Its revenue primarily comes from serving computing, automotive, and industrial markets. The company’s 2026 strategy emphasizes innovation in energy-efficient power solutions and deepening direct OEM relationships to enhance its footprint in portable and industrial electronics.
Strategic Collision: Similarities & Divergences
Both companies operate in semiconductors yet diverge sharply in focus: NXP pursues a broad product ecosystem while Monolithic Power specializes in power management solutions. They compete mainly in automotive and industrial applications but target different technological niches. NXP’s scale contrasts with Monolithic’s innovation-driven agility, defining distinct investment profiles rooted in breadth versus specialization.
Income Statement Comparison
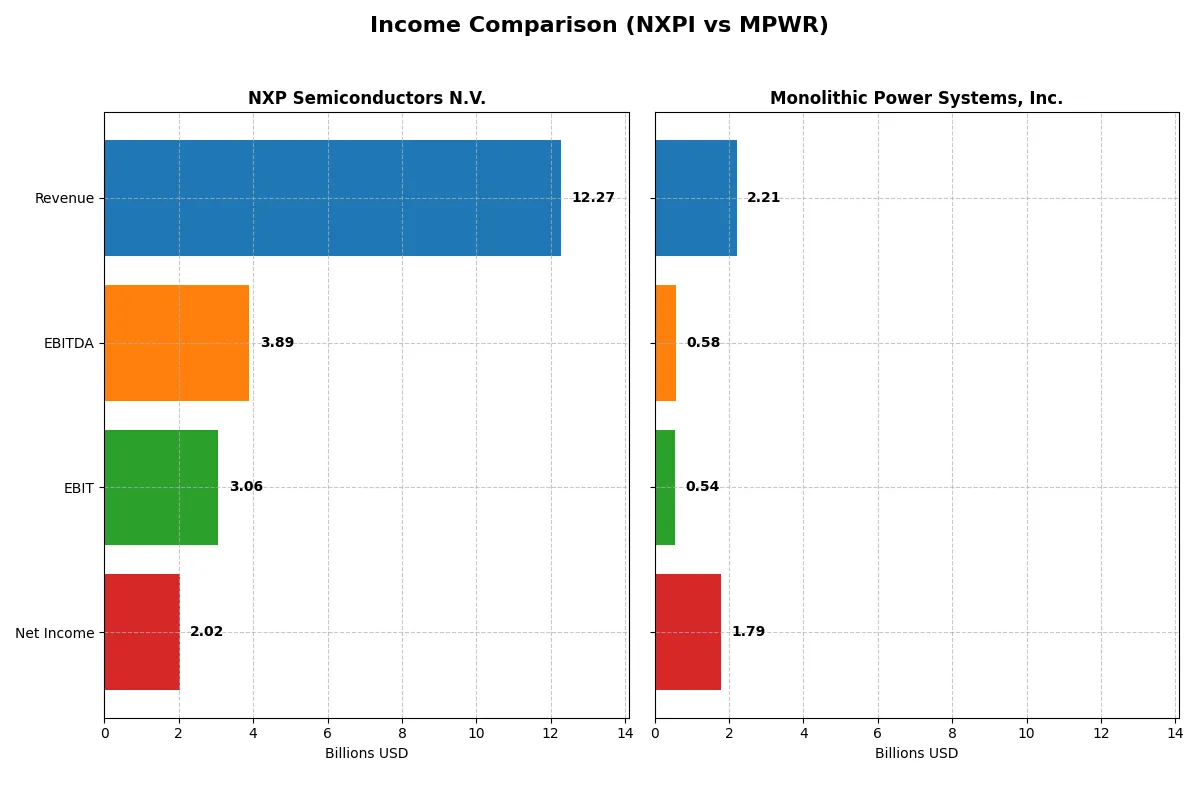
The following data dissects the core profitability and scalability of both corporate engines to reveal who dominates the bottom line:
| Metric | NXP Semiconductors N.V. (NXPI) | Monolithic Power Systems, Inc. (MPWR) |
|---|---|---|
| Revenue | 12.3B | 2.2B |
| Cost of Revenue | 5.6B | 986M |
| Operating Expenses | 3.4B | 682M |
| Gross Profit | 6.7B | 1.2B |
| EBITDA | 3.9B | 576M |
| EBIT | 3.1B | 539M |
| Interest Expense | 384M | 0 |
| Net Income | 2.0B | 1.8B |
| EPS | 8.00 | 36.76 |
| Fiscal Year | 2025 | 2024 |
Income Statement Analysis: The Bottom-Line Duel
This income statement comparison reveals the true operational efficiency and growth trajectories of two semiconductor firms.
NXP Semiconductors N.V. Analysis
NXP’s revenue grew modestly by 10.9% over five years but declined 2.74% from 2024 to 2025 to $12.3B. Net income increased 8% overall but dropped 17% in the last year to $2B. Gross margin holds strong at 54.4%, while net margin slipped to 16.5%, signaling recent margin pressure despite solid operating efficiency.
Monolithic Power Systems, Inc. Analysis
Monolithic Power exhibits robust growth, with revenue surging 21% to $2.2B in 2024 and a stunning 161% rise over five years. Net income skyrocketed nearly tenfold to $1.79B, driven by an extraordinary 81% net margin. Its gross margin at 55.3% and EBIT margin at 24.4% confirm healthy profitability and efficient expense management.
Margin Power vs. Growth Momentum
Monolithic Power outpaces NXP in both revenue and earnings growth, boasting superior net margins and rapid margin expansion. NXP shows steadier scale and reasonable margins but faces recent declines in top-line and profitability. For investors, Monolithic Power’s dynamic growth profile offers compelling upside, while NXP’s larger base reflects more established but challenged efficiency.
Financial Ratios Comparison
These vital ratios act as a diagnostic tool to expose the underlying fiscal health, valuation premiums, and capital efficiency of the companies analyzed:
| Ratios | NXP Semiconductors N.V. (NXPI) | Monolithic Power Systems, Inc. (MPWR) |
|---|---|---|
| ROE | 27.3% | 56.8% |
| ROIC | 12.9% | 16.2% |
| P/E | 21.1 | 16.1 |
| P/B | 5.78 | 9.14 |
| Current Ratio | 2.36 | 5.31 |
| Quick Ratio | 1.60 | 3.89 |
| D/E (Debt-to-Equity) | 1.18 | 0.005 |
| Debt-to-Assets | 44.5% | 0.4% |
| Interest Coverage | 8.59 | 0 |
| Asset Turnover | 0.52 | 0.61 |
| Fixed Asset Turnover | 3.86 | 4.17 |
| Payout Ratio | 41.4% | 13.5% |
| Dividend Yield | 1.96% | 0.84% |
| Fiscal Year | 2024 | 2024 |
Efficiency & Valuation Duel: The Vital Signs
Ratios act as a company’s DNA, revealing hidden risks and operational excellence that numbers alone cannot fully capture.
NXP Semiconductors N.V.
NXP delivers solid profitability with a 27.33% ROE and a 19.9% net margin, signaling efficient core operations. Its valuation at a 21.13 P/E is neutral, though a 5.78 P/B raises caution. Dividend yield at 1.96% provides moderate shareholder returns, balancing income with reinvestment in R&D.
Monolithic Power Systems, Inc.
Monolithic Power impresses with a stellar 56.8% ROE and an 80.95% net margin, showcasing exceptional profitability. The 16.09 P/E suggests reasonable valuation amid a high 9.14 P/B ratio. The company favors growth over dividends, reflected in a low 0.84% yield and strong capital reinvestment.
Premium Valuation vs. Operational Safety
Monolithic Power boasts superior profitability but carries higher valuation risk and lower dividend income. NXP offers a more balanced risk-reward profile with steady returns and prudent valuation. Investors seeking growth may prefer Monolithic Power; those valuing operational stability lean toward NXP.
Which one offers the Superior Shareholder Reward?
I compare NXP Semiconductors (NXPI) and Monolithic Power Systems (MPWR) on their dividend yields, payout ratios, and share buyback intensity. NXPI offers a higher dividend yield near 2%, with payout ratios around 35–41%, supported by solid free cash flow coverage above 70%. MPWR yields under 1%, with more modest payout ratios around 13–44%, but boasts stronger free cash flow conversion and minimal debt. Both companies execute share buybacks, yet NXPI’s leverage and consistent dividends suggest a balanced distribution model. MPWR reinvests heavily in growth, reflected by higher price multiples and cash reserves. Historically, dividend sustainability favors NXPI, but MPWR’s growth focus may yield higher long-term returns. In 2026, I find NXPI’s shareholder rewards more dependable for conservative total return, while MPWR suits growth-seeking investors willing to accept valuation risk.
Comparative Score Analysis: The Strategic Profile
The radar chart reveals the fundamental DNA and trade-offs of NXP Semiconductors and Monolithic Power Systems, highlighting their distinct financial strengths and risks:
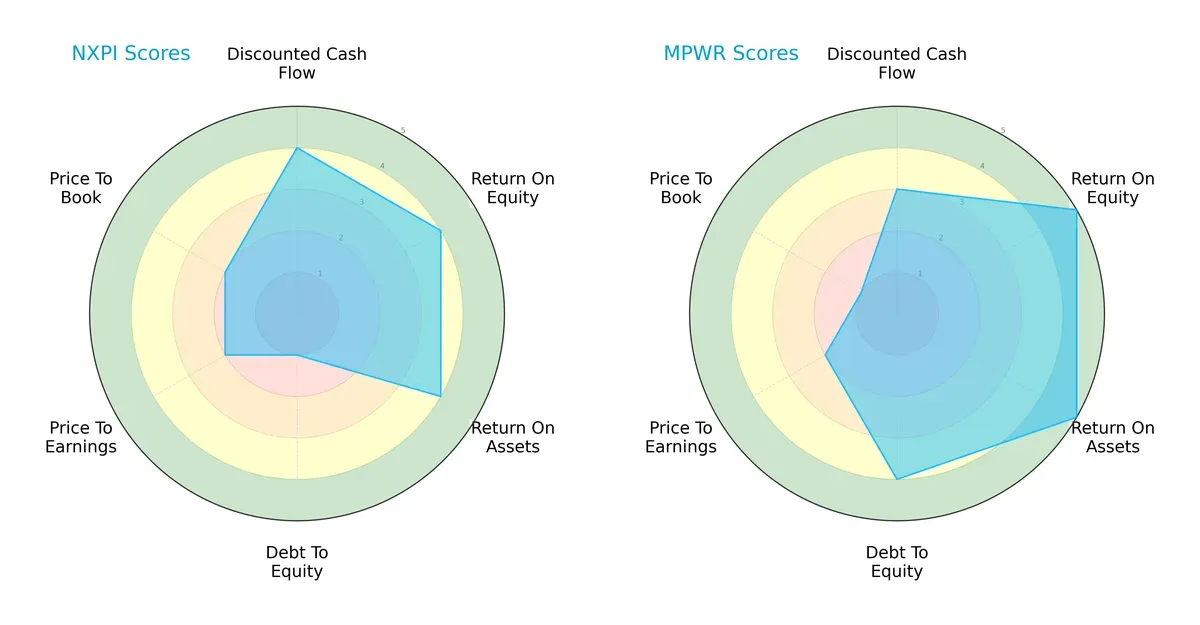
NXP Semiconductors shows a favorable edge in discounted cash flow and returns (ROE, ROA), but its very unfavorable debt-to-equity score signals financial risk. Monolithic Power Systems presents a more balanced profile with top ROE/ROA scores and a strong debt position, though it trades at a premium on book value. MPWR’s overall score reflects steadier capital allocation, while NXPI relies heavily on operational profitability but carries higher leverage risk.
Bankruptcy Risk: Solvency Showdown
The Altman Z-Scores place both firms safely above distress thresholds, but the vast delta suggests differing risk profiles:
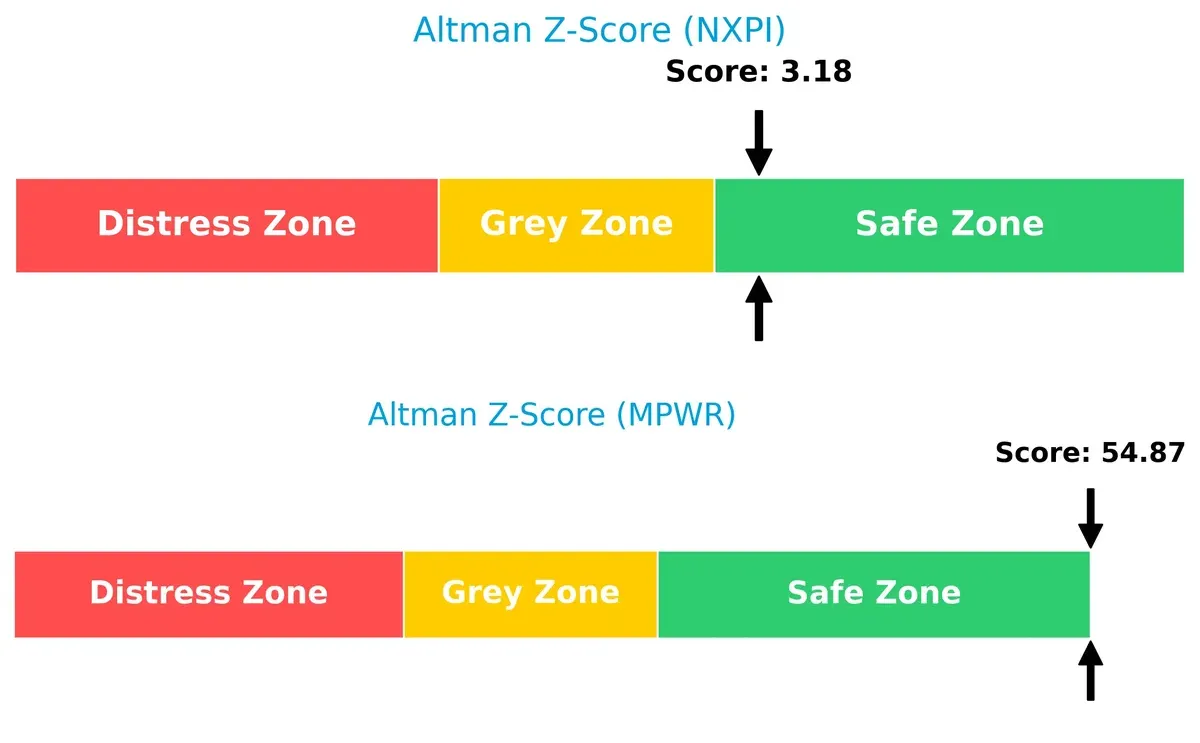
Monolithic Power’s exceptional Z-Score (54.9) signals robust solvency and near-zero bankruptcy risk. NXP’s score (3.18), though in the safe zone, is closer to cautionary levels, indicating moderate vulnerability in turbulent cycles.
Financial Health: Quality of Operations
Piotroski F-Scores reflect internal financial quality, with both companies in an average health range but notable differences:
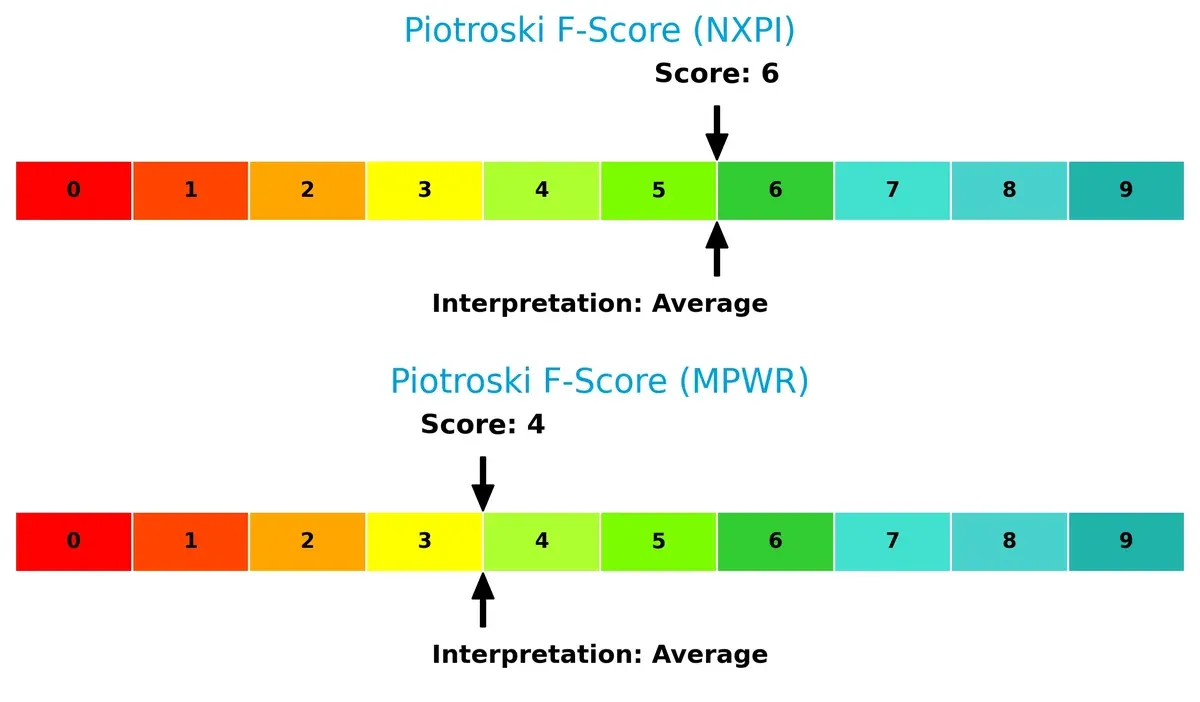
NXP leads with a score of 6, suggesting stronger operational efficiency and profitability metrics. Monolithic Power’s 4 signals some red flags in internal controls or asset management. Investors should weigh these nuances when considering resilience against sector volatility.
How are the two companies positioned?
This section dissects NXPI and MPWR’s operational DNA by comparing their revenue distribution and internal dynamics of strengths and weaknesses. The goal is to confront their economic moats and identify which business model offers the most resilient, sustainable competitive advantage today.
Revenue Segmentation: The Strategic Mix
This visual comparison dissects how NXP Semiconductors and Monolithic Power Systems diversify their income streams and where their primary sector bets lie:
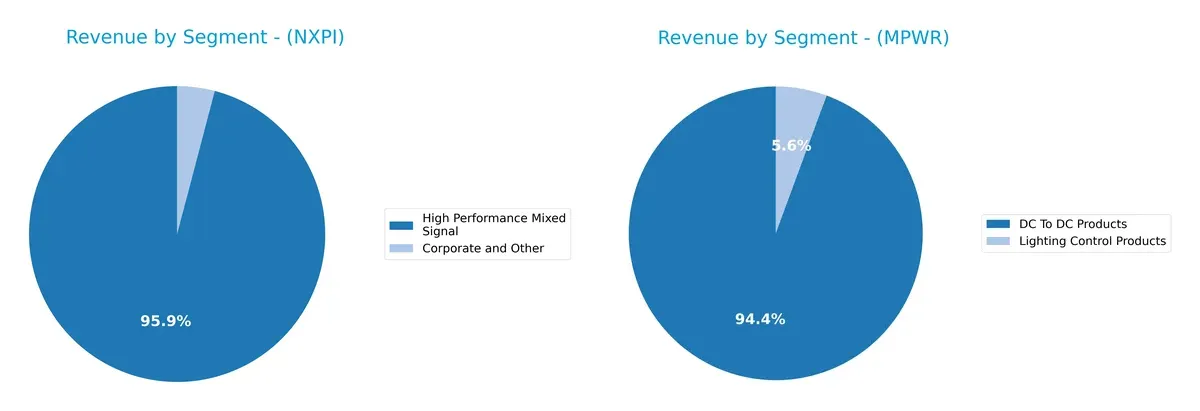
NXP Semiconductors dwarfs Monolithic Power with $9B in High Performance Mixed Signal, anchoring its revenue on this dominant segment. Its smaller Corporate and Other segment adds limited diversification. Conversely, Monolithic Power pivots on DC To DC Products ($1.7B) but maintains a meaningful Lighting Control Products segment (~$100M), showing a more balanced mix. NXP’s reliance signals concentration risk; Monolithic’s segmentation fosters resilience through product ecosystem breadth.
Strengths and Weaknesses Comparison
This table compares the Strengths and Weaknesses of NXP Semiconductors N.V. and Monolithic Power Systems, Inc.:
NXP Semiconductors N.V. Strengths
- Diversified revenue from high performance mixed signal and corporate segments
- Favorable net margin at 19.9%
- Strong ROE at 27.33%
- Healthy current and quick ratios above 1.5
- Global sales presence across China, US, Europe, and Asia
- Favorable fixed asset turnover at 3.86
Monolithic Power Systems, Inc. Strengths
- Exceptionally high net margin at 80.95%
- ROE of 56.8% reflecting strong profitability
- Very low debt-to-equity ratio at 0.01
- Favorable interest coverage with infinite value
- Growing revenue in DC to DC products segment
- Strong fixed asset turnover at 4.17
NXP Semiconductors N.V. Weaknesses
- Debt-to-equity ratio at 1.18 is relatively high
- Price-to-book ratio unfavorable at 5.78
- Debt-to-assets ratio moderately high at 44.51%
- ROIC only slightly above WACC at 12.91% vs 9.41%
- Moderate asset turnover at 0.52
Monolithic Power Systems, Inc. Weaknesses
- WACC higher than ROIC at 10.7% vs 16.22%
- Unfavorable price-to-book ratio at 9.14
- Current ratio unusually high at 5.31 indicating inefficient asset use
- Dividend yield low at 0.84%
- Higher proportion of revenue concentrated in DC To DC products
NXP shows a balanced global footprint and solid financial health but carries higher leverage and valuation concerns. Monolithic Power excels in profitability and low leverage but faces risks from concentrated product reliance and inefficient current assets. Both firms reflect strategic trade-offs in growth and financial management.
The Moat Duel: Analyzing Competitive Defensibility
A structural moat is the only true shield preserving long-term profits from relentless competitive pressure. Let’s dissect the core moats of these semiconductor players:
NXP Semiconductors N.V.: Intangible Assets and Broad Market Reach
NXP’s moat stems from deep intangible assets and diversified solutions in automotive and IoT sectors. Its financials show a rising ROIC 3.5% above WACC, signaling sustained value creation and margin resilience. Expansion in automotive processors could further entrench this advantage in 2026.
Monolithic Power Systems, Inc.: Cost Advantage with Focused Product Leadership
Monolithic Power leverages a cost advantage in power electronics, reflected in an ROIC 5.5% above WACC and explosive net margin growth. Unlike NXP’s broad portfolio, MPWR’s focused innovation drives efficient capital use. New markets in energy-efficient computing offer robust growth prospects.
Durable Innovation vs. Focused Efficiency: The Moat Showdown
Both firms boast very favorable moats with growing ROIC trends. MPWR’s higher ROIC premium and exceptional margin expansion point to a deeper moat. I see MPWR better positioned to defend and expand its niche, while NXP’s wider portfolio faces more complex competitive dynamics.
Which stock offers better returns?
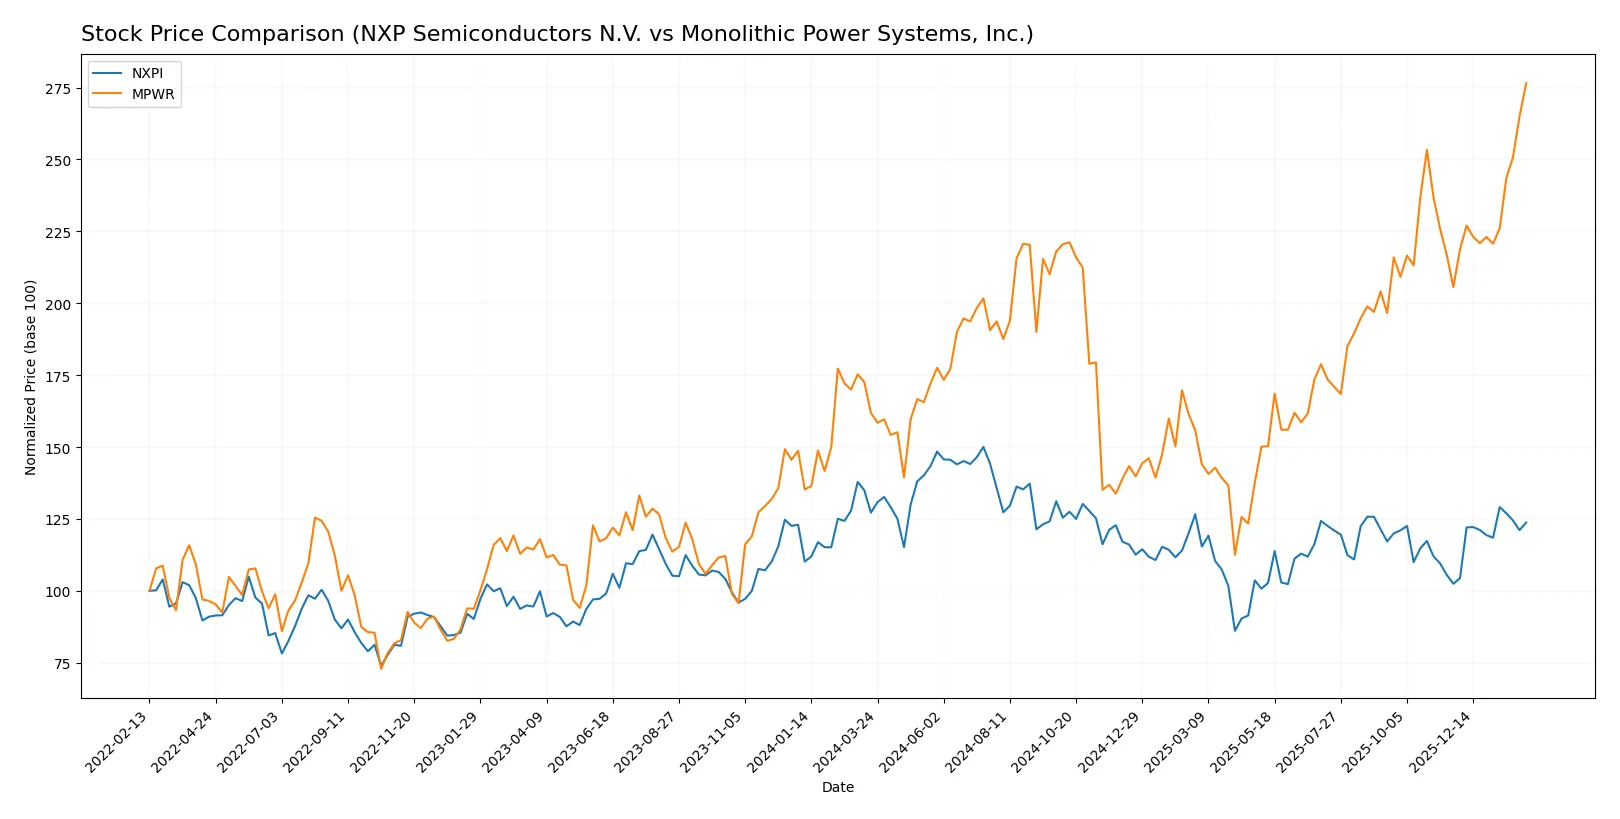
The stock price movements over the past year reveal contrasting dynamics, with NXP Semiconductors showing a bearish trend and Monolithic Power Systems exhibiting significant bullish momentum.
Trend Comparison
NXP Semiconductors’ stock declined 2.72% over the past year, marking a bearish trend with accelerating downward momentum. It reached a high of 280.19 and a low of 160.81, reflecting moderate volatility (std dev 24.1).
Monolithic Power Systems’ stock surged 70.78% in the same period, confirming a bullish trend with accelerating gains. The price fluctuated between 477.39 and 1173.22, showing high volatility (std dev 149.13).
Comparing both, Monolithic Power Systems delivered far superior market performance, outperforming NXP Semiconductors by a wide margin in the last year.
Target Prices
Analysts set a bullish consensus for NXP Semiconductors N.V. and Monolithic Power Systems, Inc.
| Company | Target Low | Target High | Consensus |
|---|---|---|---|
| NXP Semiconductors N.V. | 215 | 280 | 242.5 |
| Monolithic Power Systems, Inc. | 1025 | 1375 | 1214.29 |
The consensus target for NXP trades roughly 5% above its current price of $231, signaling moderate upside. Monolithic Power’s target consensus stands about 3.5% above its $1173 price, reflecting cautious optimism.

Don’t Let Luck Decide Your Entry Point
Optimize your entry points with our advanced ProRealTime indicators. You’ll get efficient buy signals with precise price targets for maximum performance. Start outperforming now!
How do institutions grade them?
The following tables summarize recent institutional grades for NXP Semiconductors N.V. and Monolithic Power Systems, Inc.:
NXP Semiconductors N.V. Grades
This table shows the latest available grades from respected institutions for NXP Semiconductors N.V.
| Grading Company | Action | New Grade | Date |
|---|---|---|---|
| Wells Fargo | Maintain | Overweight | 2026-01-15 |
| Citigroup | Maintain | Buy | 2026-01-15 |
| Truist Securities | Maintain | Buy | 2025-12-19 |
| JP Morgan | Maintain | Neutral | 2025-10-29 |
| Truist Securities | Maintain | Buy | 2025-10-29 |
| Wells Fargo | Maintain | Overweight | 2025-07-23 |
| Truist Securities | Maintain | Buy | 2025-07-23 |
| Susquehanna | Maintain | Neutral | 2025-07-23 |
| JP Morgan | Maintain | Neutral | 2025-07-23 |
| Barclays | Maintain | Overweight | 2025-07-22 |
Monolithic Power Systems, Inc. Grades
This table presents the most recent institutional grades for Monolithic Power Systems, Inc.
| Grading Company | Action | New Grade | Date |
|---|---|---|---|
| Wells Fargo | Maintain | Overweight | 2026-01-26 |
| Wells Fargo | Upgrade | Overweight | 2026-01-15 |
| Truist Securities | Maintain | Buy | 2025-12-19 |
| Citigroup | Maintain | Buy | 2025-11-03 |
| Keybanc | Maintain | Overweight | 2025-10-31 |
| TD Cowen | Maintain | Buy | 2025-10-31 |
| Rosenblatt | Maintain | Neutral | 2025-10-31 |
| Keybanc | Maintain | Overweight | 2025-10-23 |
| Wells Fargo | Maintain | Equal Weight | 2025-10-20 |
| Stifel | Maintain | Buy | 2025-10-17 |
Which company has the best grades?
Monolithic Power Systems, Inc. holds a slight edge with recent upgrades and multiple “Buy” and “Overweight” ratings. NXP Semiconductors N.V. primarily maintains “Buy” and “Overweight” grades but also features several “Neutral” ratings. Investors may interpret Monolithic Power’s stronger recent momentum as a positive signal, while NXP’s more mixed grades suggest cautious optimism.
Risks specific to each company
The following categories identify the critical pressure points and systemic threats facing both firms in the 2026 market environment:
1. Market & Competition
NXP Semiconductors N.V.
- Faces intense competition in automotive and IoT semiconductors, requiring constant innovation.
Monolithic Power Systems, Inc.
- Operates in niche power electronics with high margins but faces competition from larger diversified players.
2. Capital Structure & Debt
NXP Semiconductors N.V.
- Leverage ratio (D/E 1.18) is high, a red flag on financial risk despite solid interest coverage.
Monolithic Power Systems, Inc.
- Extremely low debt (D/E 0.01) signals a very conservative capital structure and low financial risk.
3. Stock Volatility
NXP Semiconductors N.V.
- Beta of 1.458 indicates above-market volatility, typical for semiconductor cyclical exposure.
Monolithic Power Systems, Inc.
- Beta very similar at 1.455, also reflecting sensitivity to tech sector swings.
4. Regulatory & Legal
NXP Semiconductors N.V.
- Global operations expose NXP to complex regulatory environments, especially in China and Europe.
Monolithic Power Systems, Inc.
- U.S.-based with international sales, faces fewer regulatory complexities but must monitor export controls.
5. Supply Chain & Operations
NXP Semiconductors N.V.
- Large scale and multiple manufacturing hubs create supply chain complexity and risk.
Monolithic Power Systems, Inc.
- Smaller scale but concentrated production might increase vulnerability to supplier disruptions.
6. ESG & Climate Transition
NXP Semiconductors N.V.
- Strong pressure to improve ESG disclosures and reduce carbon footprint due to European base.
Monolithic Power Systems, Inc.
- ESG efforts growing but lag behind larger peers; climate transition risks remain material.
7. Geopolitical Exposure
NXP Semiconductors N.V.
- Significant exposure to China and Asia-Pacific geopolitical tensions impacts operations and sales.
Monolithic Power Systems, Inc.
- U.S. headquarters reduce some risks, but supply chain and sales in Asia remain exposed.
Which company shows a better risk-adjusted profile?
Monolithic Power Systems exhibits a superior risk-adjusted profile thanks to its minimal leverage and robust profitability. NXP’s higher debt and broader geopolitical exposure increase its risk footprint. However, NXP benefits from scale and diversified product lines, cushioning some sector cyclicality. The most critical risk for NXP is its elevated leverage amid a volatile semiconductor cycle. For Monolithic Power, supply chain concentration poses the greatest threat. Recent data underline NXP’s unfavorable debt-to-equity score (1.18) versus MPWR’s 0.01, justifying my caution on NXP’s financial risk.
Final Verdict: Which stock to choose?
NXP Semiconductors stands out as a cash-generating engine with a durable competitive edge, efficiently turning invested capital into value. Its point of vigilance lies in its moderate debt levels and recent earnings softness. It suits investors targeting steady growth with a tolerance for cyclical fluctuations.
Monolithic Power Systems commands a strategic moat through exceptional profitability and balance sheet strength, underpinned by a rare combination of high returns and minimal leverage. Compared to NXP, it offers a safer profile but trades at a premium. It fits well in portfolios seeking growth at a reasonable price with lower risk exposure.
If you prioritize capital efficiency and value creation in a cyclical semiconductor environment, NXP Semiconductors is the compelling choice due to its proven ROIC expansion and solid cash flow. However, if you seek superior profitability coupled with financial conservatism, Monolithic Power Systems offers better stability and a stronger safety margin, despite its higher valuation.
Disclaimer: Investment carries a risk of loss of initial capital. The past performance is not a reliable indicator of future results. Be sure to understand risks before making an investment decision.
Go Further
I encourage you to read the complete analyses of NXP Semiconductors N.V. and Monolithic Power Systems, Inc. to enhance your investment decisions: