In the rapidly evolving semiconductor industry, NVIDIA Corporation and Monolithic Power Systems, Inc. stand out as key players with distinct yet overlapping market focuses. NVIDIA leads in graphics processing and AI-driven computing, while Monolithic Power excels in power electronics for diverse applications. Their innovation strategies and market presence make them compelling subjects for comparison. Join me as we analyze which company offers the more attractive investment opportunity in 2026.

Table of contents
Companies Overview
I will begin the comparison between NVIDIA Corporation and Monolithic Power Systems, Inc. by providing an overview of these two companies and their main differences.
NVIDIA Overview
NVIDIA Corporation, headquartered in Santa Clara, California, specializes in graphics, compute, and networking solutions. It serves markets including gaming, professional visualization, datacenters, and automotive sectors. With a market cap of 4.46T USD and 36K employees, NVIDIA offers GPUs, AI platforms, and software for virtual computing and autonomous vehicles, positioning itself as a leading innovator in semiconductor technology.
Monolithic Power Systems Overview
Monolithic Power Systems, Inc., based in Kirkland, Washington, designs and markets semiconductor power electronics solutions. It focuses on DC to DC integrated circuits and lighting control ICs used in computing, automotive, industrial, and consumer electronics. The company has a 47.1B USD market cap and employs about 4K people, emphasizing efficient power management technologies distributed globally.
Key similarities and differences
Both companies operate in the semiconductor industry and serve diverse technology markets worldwide. NVIDIA concentrates on high-performance graphics, AI, and networking platforms, while Monolithic Power Systems specializes in power management ICs. NVIDIA’s scale is significantly larger with a broader product range and market cap, whereas Monolithic Power focuses more narrowly on power electronics solutions for various electronic systems.
Income Statement Comparison
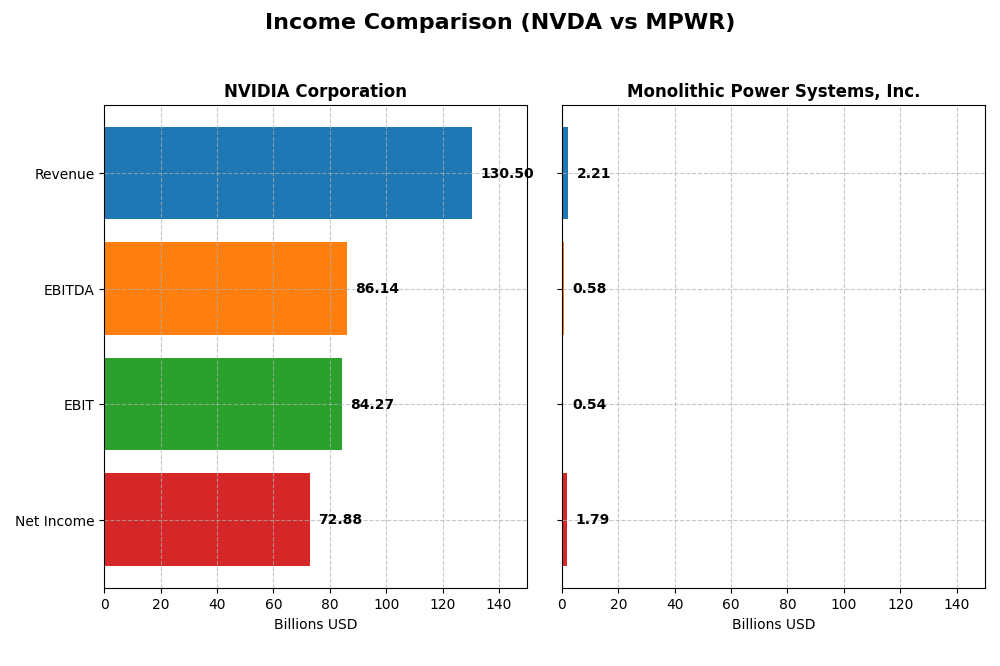
The table below compares the latest fiscal year income statement metrics for NVIDIA Corporation and Monolithic Power Systems, Inc., highlighting key financial figures for investors.
| Metric | NVIDIA Corporation | Monolithic Power Systems, Inc. |
|---|---|---|
| Market Cap | 4.46T | 47.1B |
| Revenue | 130.5B | 2.21B |
| EBITDA | 86.1B | 576M |
| EBIT | 84.3B | 539M |
| Net Income | 72.9B | 1.79B |
| EPS | 2.97 | 36.76 |
| Fiscal Year | 2025 | 2024 |
Income Statement Interpretations
NVIDIA Corporation
NVIDIA’s revenue and net income demonstrated a strong upward trend from 2021 to 2025, with revenue soaring from $16.7B to $130.5B and net income rising from $4.3B to $72.9B. Margins remained robust, with gross margin near 75% and net margin above 55%. The latest year showed exceptional growth, with revenue more than doubling and margins improving further.
Monolithic Power Systems, Inc.
Monolithic Power Systems exhibited steady revenue growth from $844M in 2020 to $2.2B in 2024, accompanied by net income increasing from $164M to $1.79B. Margins were favorable, with a strong gross margin above 55% and an impressive net margin near 81%. The most recent year showed moderate revenue growth, but net margin expanded significantly.
Which one has the stronger fundamentals?
Both companies show favorable income statement fundamentals, yet NVIDIA’s scale and accelerated growth in revenue and net income outpace Monolithic Power’s more modest expansion. NVIDIA maintains consistently high margins and superior growth rates overall. Monolithic Power reports a higher net margin but faces slight unfavorable operational expense growth, contrasting with NVIDIA’s uniformly favorable metrics.
Financial Ratios Comparison
The table below presents a side-by-side comparison of key financial ratios for NVIDIA Corporation and Monolithic Power Systems, Inc., based on their most recent fiscal year data.
| Ratios | NVIDIA Corporation (2025) | Monolithic Power Systems, Inc. (2024) |
|---|---|---|
| ROE | 91.9% | 56.8% |
| ROIC | 75.3% | 16.2% |
| P/E | 39.9 | 16.1 |
| P/B | 36.7 | 9.14 |
| Current Ratio | 4.44 | 5.31 |
| Quick Ratio | 3.88 | 3.89 |
| D/E | 0.13 | 0.005 |
| Debt-to-Assets | 9.2% | 0.44% |
| Interest Coverage | 330 | 0 |
| Asset Turnover | 1.17 | 0.61 |
| Fixed Asset Turnover | 16.16 | 4.17 |
| Payout ratio | 1.14% | 13.5% |
| Dividend yield | 0.029% | 0.84% |
Interpretation of the Ratios
NVIDIA Corporation
NVIDIA shows strong profitability with a net margin of 55.85%, an exceptionally high ROE of 91.87%, and a robust ROIC of 75.28%, indicating efficient capital use. However, the company faces concerns with a high P/E ratio of 39.9, elevated price-to-book at 36.66, and a high current ratio of 4.44, which is marked unfavorable. Dividend yield is low at 0.03%, with a small recent dividend of $0.04 per share, suggesting limited shareholder returns through dividends.
Monolithic Power Systems, Inc.
Monolithic Power Systems demonstrates very high net margin at 80.95% and a solid ROE of 56.8%, alongside a more moderate ROIC of 16.22%. While the company has a favorable debt profile and interest coverage, it displays a neutral P/E of 16.09 and an unfavorable price-to-book ratio of 9.14. The current ratio is also high at 5.31. Dividend yield stands at 0.84%, higher than NVIDIA, indicating somewhat better income return for shareholders.
Which one has the best ratios?
Both companies exhibit favorable overall financial health, with NVIDIA scoring 64.29% favorable ratios versus Monolithic Power’s 57.14%. NVIDIA excels in profitability and capital returns but carries higher valuation multiples and liquidity concerns. Monolithic Power offers strong margins and a better dividend yield but shows mixed signals in asset efficiency and valuation. Each presents a balanced profile with distinct strengths and weaknesses.
Strategic Positioning
This section compares the strategic positioning of NVIDIA and Monolithic Power Systems, focusing on Market position, Key segments, and Exposure to technological disruption:
NVIDIA Corporation
- Market leader in semiconductors with very high market cap and strong competitive pressure.
- Diverse segments: Data Center ($115B), Gaming ($11.35B), Automotive, Professional Visualization.
- High exposure to disruption with AI, HPC, autonomous driving, and cloud computing technologies.
Monolithic Power Systems, Inc.
- Smaller market cap with moderate competitive pressure in power electronics niche.
- Focused on DC to DC products ($1.72B) and lighting control, serving multiple industries.
- Exposure limited to power electronics innovation for computing, automotive, and industrial sectors.
NVIDIA vs Monolithic Power Systems Positioning
NVIDIA pursues a highly diversified strategy across high-growth tech segments, leveraging large-scale innovation and market presence. Monolithic Power Systems concentrates on specialized power electronics markets, offering focused but smaller scale growth opportunities.
Which has the best competitive advantage?
Both companies show a very favorable moat with value creation and growing ROIC. NVIDIA’s significantly higher ROIC compared to WACC and broader market segments indicate a stronger and more durable competitive advantage.
Stock Comparison
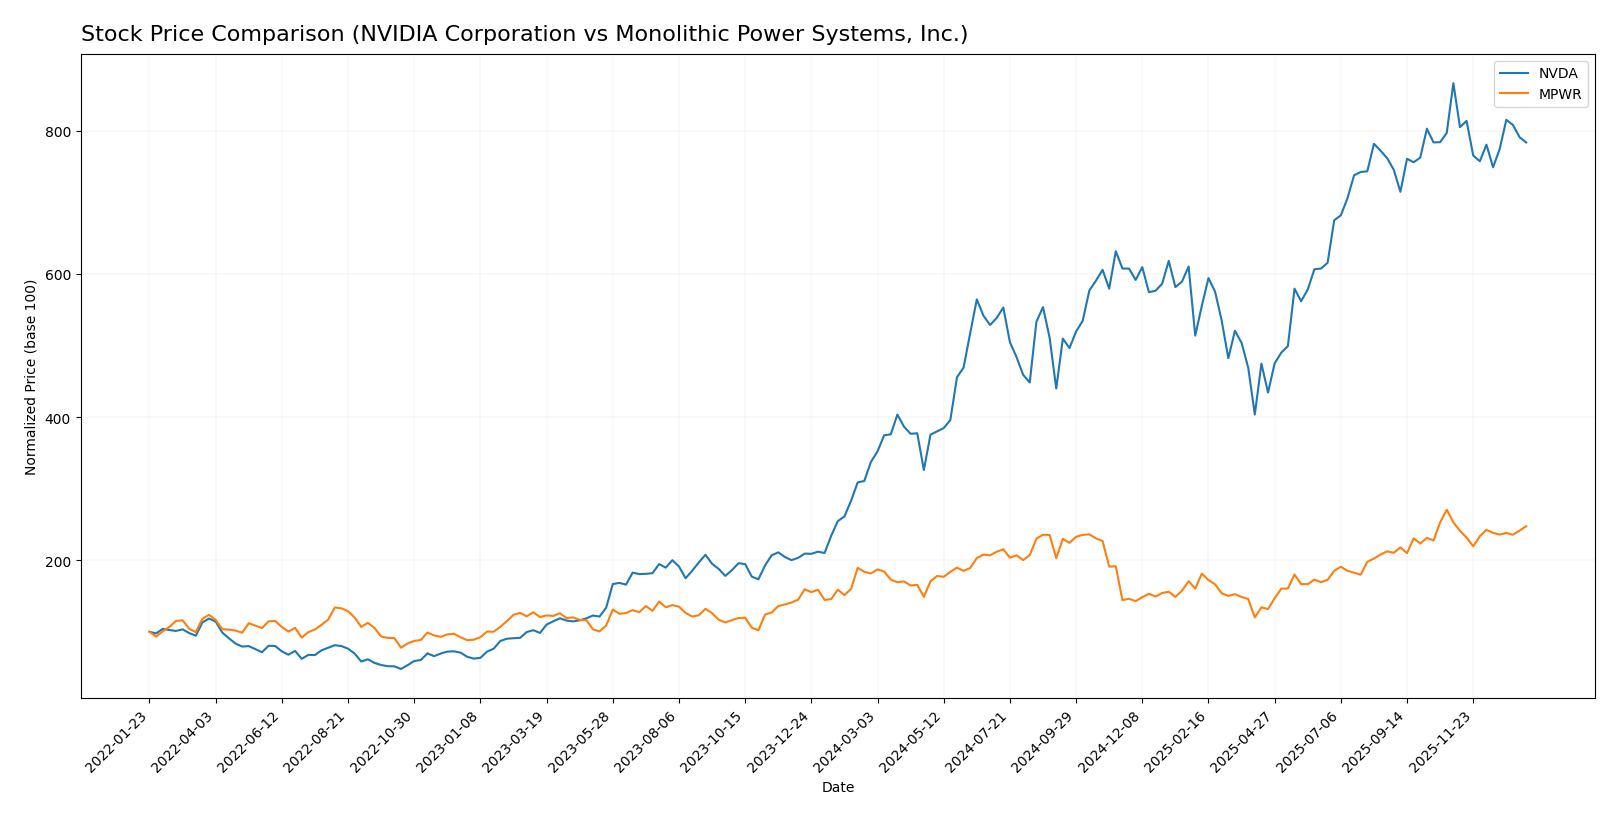
The stock prices of NVIDIA Corporation and Monolithic Power Systems, Inc. have shown significant bullish trends over the past 12 months, with NVIDIA exhibiting a notably stronger price increase despite recent deceleration and Monolithic Power Systems experiencing higher volatility and a less pronounced rise.
Trend Analysis
NVIDIA Corporation’s stock price increased by 132.35% over the past year, indicating a bullish trend with deceleration in growth. The price ranged from a low of 76.2 to a high of 202.49, with a recent downward trend of -9.56%.
Monolithic Power Systems, Inc. showed a 36.4% price increase over the same period, also bullish but with deceleration and higher volatility. The stock ranged between 477.39 and 1074.91, with a slight recent upward slope despite a -2.13% price change.
Comparatively, NVIDIA delivered the highest market performance with a substantially greater overall price increase, while Monolithic Power Systems showed moderate gains and higher price volatility.
Target Prices
The target price consensus for NVIDIA Corporation and Monolithic Power Systems, Inc. indicates positive analyst expectations.
| Company | Target High | Target Low | Consensus |
|---|---|---|---|
| NVIDIA Corporation | 352 | 140 | 264.34 |
| Monolithic Power Systems, Inc. | 1375 | 970 | 1161.67 |
Analysts expect NVIDIA’s stock to rise significantly from its current price of 183.14 USD, while Monolithic Power Systems shows a strong upside potential compared to its 983.6 USD market price.
Analyst Opinions Comparison
This section compares analysts’ ratings and grades for NVIDIA Corporation and Monolithic Power Systems, Inc.:
Rating Comparison
NVIDIA Corporation Rating
- Rating: B+, considered very favorable by analysts.
- Discounted Cash Flow Score: Moderate at 3, indicating average valuation based on cash flow.
- ROE Score: Very favorable at 5, showing strong profit generation from equity.
- ROA Score: Very favorable at 5, reflecting efficient asset utilization.
- Debt To Equity Score: Moderate at 3, suggesting medium financial risk.
- Overall Score: Moderate at 3, reflecting an average overall financial standing.
Monolithic Power Systems, Inc. Rating
- Rating: A-, also regarded as very favorable by analysts.
- Discounted Cash Flow Score: Moderate at 3, similar valuation outlook.
- ROE Score: Very favorable at 5, equally strong in profit efficiency.
- ROA Score: Very favorable at 5, also indicating excellent asset use.
- Debt To Equity Score: Very favorable at 5, indicating low financial risk.
- Overall Score: Favorable at 4, showing stronger overall financial health.
Which one is the best rated?
Based on the data, Monolithic Power Systems, Inc. holds a superior overall rating (A-) and a higher overall score (4) compared to NVIDIA’s B+ rating and score of 3. MPWR’s debt-to-equity score notably outperforms NVDA’s, contributing to its better financial profile.
Scores Comparison
Here is a comparison of the Altman Z-Score and Piotroski Score for NVIDIA and Monolithic Power Systems:
NVIDIA Scores
- Altman Z-Score: 68.04, indicating a safe financial zone with very low bankruptcy risk.
- Piotroski Score: 6, reflecting average financial strength and investment quality.
Monolithic Power Systems Scores
- Altman Z-Score: 46.83, indicating a safe financial zone with very low bankruptcy risk.
- Piotroski Score: 4, reflecting average financial strength and investment quality.
Which company has the best scores?
NVIDIA has higher Altman Z-Score and Piotroski Score values than Monolithic Power Systems, indicating stronger financial stability and a better average strength rating based on the provided data.
Grades Comparison
Here is a comparison of the recent grades assigned to NVIDIA Corporation and Monolithic Power Systems, Inc.:
NVIDIA Corporation Grades
The table below shows NVIDIA’s latest grades from reputable financial institutions.
| Grading Company | Action | New Grade | Date |
|---|---|---|---|
| Mizuho | Maintain | Outperform | 2026-01-09 |
| Truist Securities | Maintain | Buy | 2025-12-29 |
| Stifel | Maintain | Buy | 2025-12-29 |
| B of A Securities | Maintain | Buy | 2025-12-26 |
| Baird | Maintain | Outperform | 2025-12-26 |
| Bernstein | Maintain | Outperform | 2025-12-26 |
| Truist Securities | Maintain | Buy | 2025-12-19 |
| Tigress Financial | Maintain | Strong Buy | 2025-12-18 |
| Morgan Stanley | Maintain | Overweight | 2025-12-01 |
| Deutsche Bank | Maintain | Hold | 2025-11-20 |
NVIDIA’s ratings predominantly maintain a “Buy” or better consensus, with several “Outperform” and one “Strong Buy,” indicating a strong confidence trend.
Monolithic Power Systems, Inc. Grades
The table below presents Monolithic Power Systems’ recent grades from recognized grading companies.
| Grading Company | Action | New Grade | Date |
|---|---|---|---|
| Truist Securities | Maintain | Buy | 2025-12-19 |
| Citigroup | Maintain | Buy | 2025-11-03 |
| TD Cowen | Maintain | Buy | 2025-10-31 |
| Keybanc | Maintain | Overweight | 2025-10-31 |
| Rosenblatt | Maintain | Neutral | 2025-10-31 |
| Keybanc | Maintain | Overweight | 2025-10-23 |
| Wells Fargo | Maintain | Equal Weight | 2025-10-20 |
| Stifel | Maintain | Buy | 2025-10-17 |
| Wolfe Research | Upgrade | Outperform | 2025-10-14 |
| Citigroup | Maintain | Buy | 2025-10-03 |
Monolithic Power Systems’ grades mostly range from “Buy” to “Overweight,” with a recent upgrade to “Outperform,” reflecting a positive but slightly more mixed outlook compared to NVIDIA.
Which company has the best grades?
NVIDIA has received a higher number of “Outperform” and “Strong Buy” ratings, indicating stronger analyst confidence than Monolithic Power Systems, whose ratings include “Neutral” and “Equal Weight.” This difference may impact investors by reflecting greater growth expectations and perceived stability for NVIDIA.
Strengths and Weaknesses
Below is a comparison of key strengths and weaknesses of NVIDIA Corporation (NVDA) and Monolithic Power Systems, Inc. (MPWR) based on their latest financial and operational data.
| Criterion | NVIDIA Corporation (NVDA) | Monolithic Power Systems, Inc. (MPWR) |
|---|---|---|
| Diversification | Highly diversified revenue streams: Data Center $115B, Gaming $11.35B, Automotive $1.69B, Professional Visualization $1.88B (2025) | Less diversified, focused mainly on DC to DC products $1.72B and Lighting Control $102M (2023) |
| Profitability | Very high net margin 55.85%, ROE 91.87%, ROIC 75.28% (2025) | Exceptionally high net margin 80.95%, ROE 56.8%, ROIC 16.22% (2024) |
| Innovation | Strong innovation with growing ROIC trend (+339%), large R&D investments | Steady innovation with growing ROIC trend (+11.8%), niche semiconductor technology focus |
| Global presence | Extensive global presence in data centers, gaming, automotive sectors | Moderate global footprint focused on power management solutions |
| Market Share | Leading position in GPU and AI chips market | Strong position in power management semiconductor niche |
Key takeaways: NVIDIA excels in diversification, profitability, and innovation with a very favorable economic moat and global reach. MPWR shows excellent profitability and a durable niche moat but with less diversification and smaller scale. Both present favorable investment profiles, with NVIDIA offering broader exposure and MPWR focused on specialized power solutions.
Risk Analysis
Below is a comparative risk assessment table for NVIDIA Corporation (NVDA) and Monolithic Power Systems, Inc. (MPWR) based on the most recent data from 2025 and 2024 respectively:
| Metric | NVIDIA Corporation (NVDA) | Monolithic Power Systems, Inc. (MPWR) |
|---|---|---|
| Market Risk | High beta of 2.314 indicates higher volatility and sensitivity to market swings. | Moderate beta of 1.456 suggests moderate market risk exposure. |
| Debt level | Low debt-to-equity ratio (0.13) and debt-to-assets (9.2%) show strong balance sheet with low leverage. | Very low debt-to-equity ratio (0.01) and debt-to-assets (0.44%) indicate minimal financial risk. |
| Regulatory Risk | Exposure to international markets including China may increase regulatory and trade risks. | Also exposed globally but with smaller scale, regulatory risk is moderate. |
| Operational Risk | Large scale and diverse product portfolio with 36K employees; complexity may increase operational risk. | Smaller scale (4K employees) but specialized in power electronics, operational risks are more focused but contained. |
| Environmental Risk | Semiconductor manufacturing has notable environmental impact; increasing focus on sustainability. | Similar industry environmental footprint but smaller scale reduces absolute risk. |
| Geopolitical Risk | Significant international exposure, especially in Asia-Pacific, heightens geopolitical risk. | International sales but less exposed than NVDA, moderate geopolitical risk. |
Synthesis: NVIDIA’s most significant risks are market volatility and geopolitical exposure, amplified by its global footprint and regulatory challenges, despite a strong financial position. Monolithic Power Systems shows lower market and geopolitical risks with very low leverage, but both face typical semiconductor industry environmental and operational risks. Investors should weigh NVDA’s higher beta and geopolitical sensitivity against MPWR’s smaller scale but robust financial health.
Which Stock to Choose?
NVIDIA Corporation (NVDA) shows strong income growth with a 114.2% revenue increase in 2025 and a favorable net margin of 55.85%. Its financial ratios indicate solid profitability, low debt (debt-to-equity 0.13), and a very favorable rating of B+, reflecting robust operational efficiency and value creation.
Monolithic Power Systems, Inc. (MPWR) exhibits steady income growth with a 21.2% revenue rise in 2024 and a high net margin of 80.95%. Its financial ratios reveal strong profitability, minimal debt (debt-to-equity 0.01), and a very favorable rating of A-, suggesting efficient capital use and financial stability.
For investors focused on growth, NVDA’s exceptional income growth and strong profitability might appear attractive, while those prioritizing financial stability and consistent returns could find MPWR’s solid margins and favorable rating more aligned with their profile. Each stock’s appeal could therefore depend on the investor’s risk tolerance and investment strategy.
Disclaimer: Investment carries a risk of loss of initial capital. The past performance is not a reliable indicator of future results. Be sure to understand risks before making an investment decision.
Go Further
I encourage you to read the complete analyses of NVIDIA Corporation and Monolithic Power Systems, Inc. to enhance your investment decisions: