In the fast-evolving world of software infrastructure, Oracle Corporation and MongoDB, Inc. represent two influential players shaping enterprise technology. Oracle, a long-established giant, offers comprehensive cloud and database solutions, while MongoDB, a dynamic disruptor, specializes in modern, flexible database platforms. Their shared industry and innovation focus make them ideal for comparison. Join me as we explore which company holds the greatest promise for your investment portfolio in 2026.

Table of contents
Companies Overview
I will begin the comparison between Oracle Corporation and MongoDB, Inc. by providing an overview of these two companies and their main differences.
Oracle Overview
Oracle Corporation focuses on delivering products and services for enterprise IT environments globally. Its offerings include cloud software applications such as Oracle Fusion ERP, supply chain, human capital management, and NetSuite suites. Oracle also provides cloud infrastructure technologies, database solutions like Oracle Database and MySQL HeatWave, along with hardware products and consulting services. Founded in 1977, Oracle is headquartered in Austin, Texas, and supports a broad range of industries.
MongoDB Overview
MongoDB, Inc. provides a general-purpose database platform designed to operate in cloud, on-premise, or hybrid environments. The company offers MongoDB Enterprise Advanced for enterprises, MongoDB Atlas as a multi-cloud database-as-a-service, and a free Community Server for developers. Founded in 2007 and based in New York City, MongoDB also delivers professional consulting and training services to support its database solutions.
Key similarities and differences
Both Oracle and MongoDB operate in the software infrastructure sector, focusing on database technologies and cloud services. Oracle offers a broader portfolio including enterprise applications, hardware, and consulting, serving diverse industries with a large workforce. In contrast, MongoDB specializes specifically in database platforms with a smaller team and a focus on flexible deployment models, emphasizing cloud and developer-friendly solutions.
Income Statement Comparison
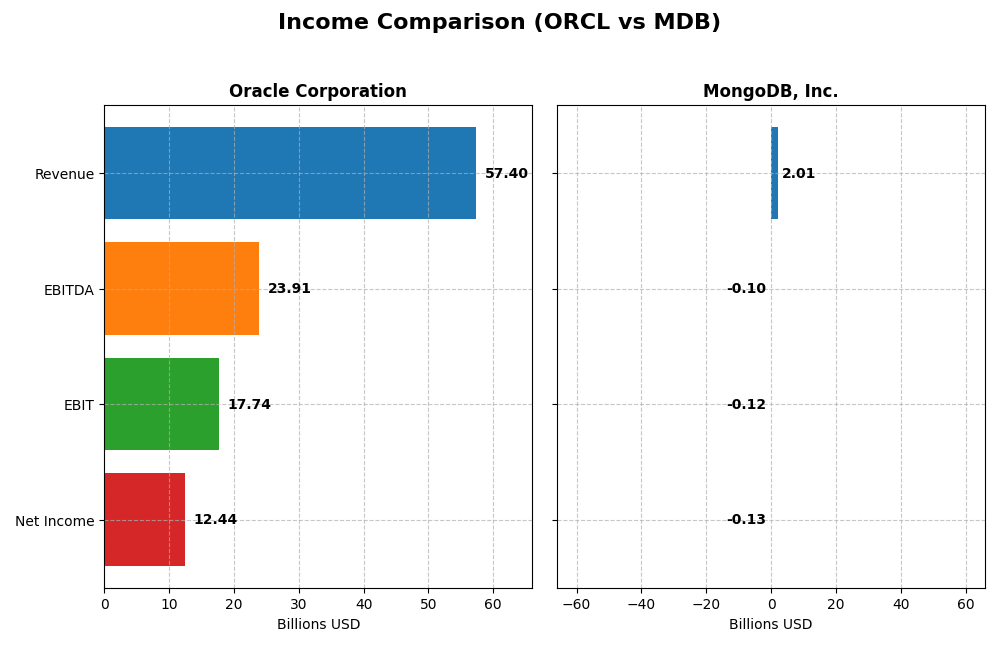
This table presents a side-by-side comparison of the most recent fiscal year income statement metrics for Oracle Corporation and MongoDB, Inc., providing a clear overview of their financial performance.
| Metric | Oracle Corporation | MongoDB, Inc. |
|---|---|---|
| Market Cap | 549B | 33B |
| Revenue | 57.4B | 2.01B |
| EBITDA | 23.9B | -97M |
| EBIT | 17.7B | -124M |
| Net Income | 12.4B | -129M |
| EPS | 4.46 | -1.73 |
| Fiscal Year | 2025 | 2025 |
Income Statement Interpretations
Oracle Corporation
Oracle showed consistent revenue growth from $40.5B in 2021 to $57.4B in 2025, with gross margins stable around 70%. Net income peaked at $13.7B in 2021 but declined to $12.4B in 2025, reflecting some margin pressures. The latest year indicated favorable revenue and EBIT growth, with net margin improving by 9.7%, signaling operational strength despite overall net income decline over five years.
MongoDB, Inc.
MongoDB’s revenue surged from $590M in 2021 to $2.0B in 2025, with gross margins improving to 73.3%. The company remained unprofitable but reduced net losses from -$267M to -$129M. EBIT margin and net margin are negative but showed marked improvement in 2025, with net margin growing by 38.7%. The firm’s rapid growth is reflected in strong gains in revenue and EPS over the period.
Which one has the stronger fundamentals?
Oracle demonstrates strong profitability with favorable margins and solid operating income, though net income declined overall, signaling some challenges. MongoDB excels in growth metrics and margin improvement but remains unprofitable. Oracle’s established earnings contrast with MongoDB’s expansion and improving losses, highlighting a trade-off between stable profits and rapid growth fundamentals.
Financial Ratios Comparison
The table below presents the most recent key financial ratios for Oracle Corporation and MongoDB, Inc. as of their latest fiscal years, offering a snapshot of profitability, liquidity, leverage, and efficiency metrics.
| Ratios | Oracle Corporation (2025) | MongoDB, Inc. (2025) |
|---|---|---|
| ROE | 60.8% | -4.6% |
| ROIC | 10.9% | -7.4% |
| P/E | 37.1 | -158 |
| P/B | 22.6 | 7.3 |
| Current Ratio | 0.75 | 5.20 |
| Quick Ratio | 0.75 | 5.20 |
| D/E (Debt to Equity) | 5.09 | 0.013 |
| Debt-to-Assets | 61.8% | 1.1% |
| Interest Coverage | 4.94 | -26.7 |
| Asset Turnover | 0.34 | 0.58 |
| Fixed Asset Turnover | 1.32 | 24.8 |
| Payout Ratio | 38.1% | 0% |
| Dividend Yield | 1.03% | 0% |
Interpretation of the Ratios
Oracle Corporation
Oracle displays strong profitability ratios with a net margin of 21.68% and an exceptional return on equity of 60.84%, indicating efficient capital use. However, liquidity and leverage ratios are weak, with a low current ratio of 0.75 and a high debt-to-equity ratio of 5.09, raising concerns about short-term solvency and financial risk. Oracle pays dividends, yielding 1.03%, supported by a stable payout, though cash flow coverage is negative, which could signal sustainability risks.
MongoDB, Inc.
MongoDB’s financial ratios reveal challenges, including negative net margin (-6.43%) and return on equity (-4.64%), reflecting ongoing losses and inefficiency. The company has a very strong liquidity position with a current ratio of 5.2 and minimal debt (debt-to-equity 0.01), highlighting low financial risk and ample short-term assets. MongoDB does not pay dividends, consistent with its high-growth phase and reinvestment strategy prioritizing R&D.
Which one has the best ratios?
Both companies present unfavorable overall ratio profiles, with Oracle suffering from liquidity and leverage concerns despite strong profitability, while MongoDB struggles with negative profitability but maintains a robust liquidity and low debt position. Oracle’s dividend payout contrasts with MongoDB’s growth-focused approach. Investors must weigh profitability against financial stability in their assessment.
Strategic Positioning
This section compares the strategic positioning of Oracle Corporation and MongoDB, Inc. in terms of market position, key segments, and exposure to technological disruption:
Oracle Corporation
- Large market cap of 549B with significant competitive pressure in enterprise IT infrastructure sector
- Diverse revenue from cloud & license (49B), hardware (2.9B), and services (5.2B) segments
- Exposed to disruption through cloud software, autonomous databases, IoT, digital assistant, blockchain
MongoDB, Inc.
- Smaller market cap of 32.5B, operating in cloud and hybrid database platforms with NASDAQ listing
- Mainly subscription-based database services, with Atlas cloud platform leading at 1.4B revenue
- Focused on cloud-native, multi-cloud database services, adapting to flexible deployment models
Oracle Corporation vs MongoDB, Inc. Positioning
Oracle pursues a diversified approach, spanning cloud software, hardware, and services, offering scale and broad industry coverage. MongoDB concentrates on cloud database solutions with a narrower product line, emphasizing innovation in multi-cloud flexibility but with less revenue scale.
Which has the best competitive advantage?
Both companies currently shed value with slightly unfavorable moats. Oracle has declining profitability despite scale, while MongoDB shows improving profitability but remains value destructive, indicating risks in maintaining sustainable competitive advantages.
Stock Comparison
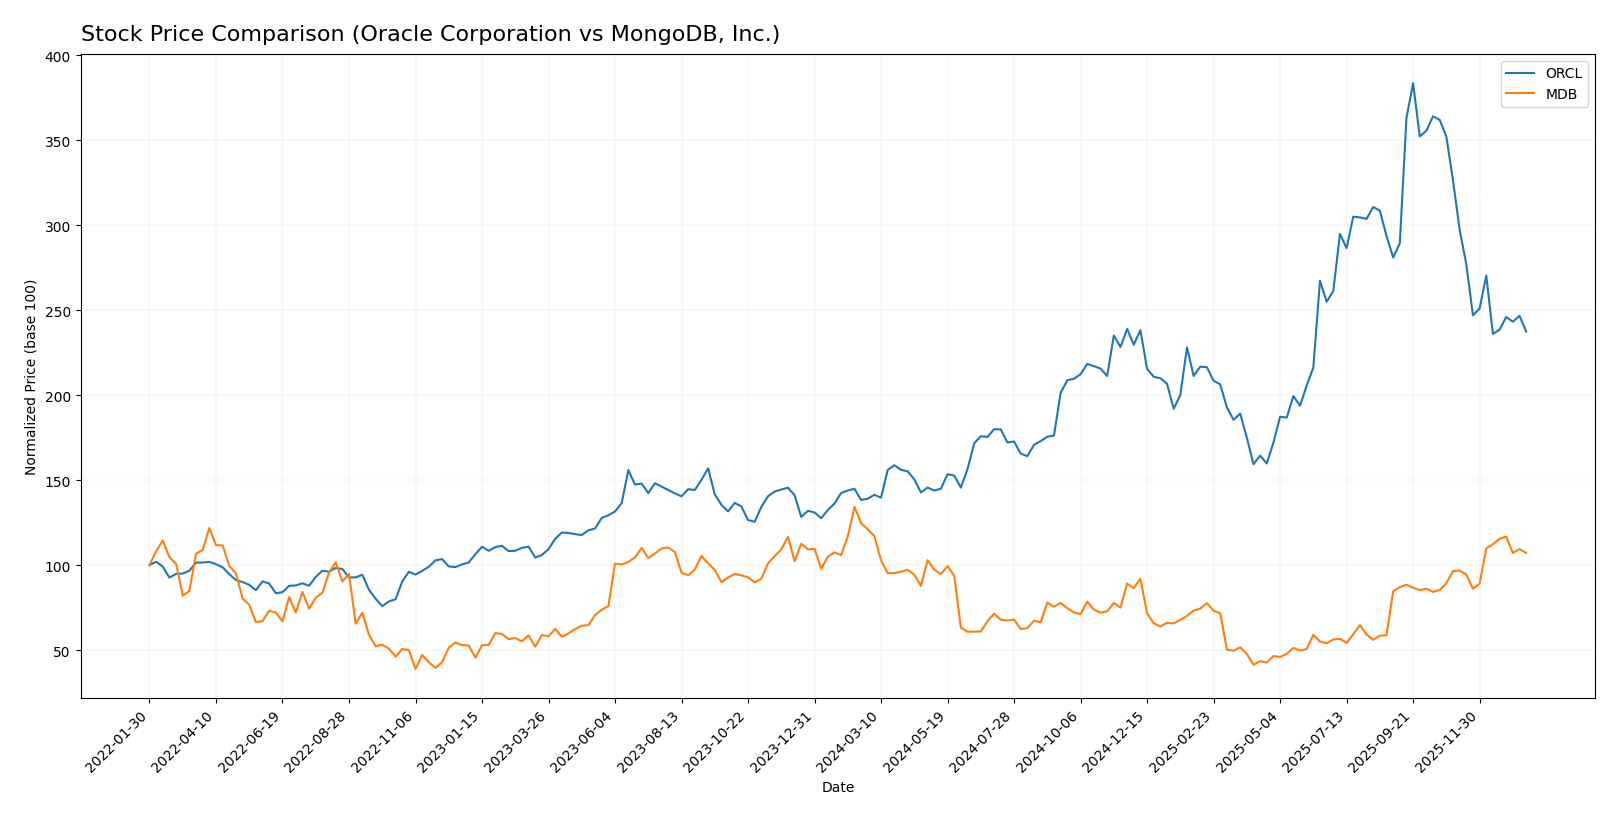
The stock price movements over the past year display a strong bullish trend for Oracle Corporation, contrasted by a bearish trend for MongoDB, Inc., with distinct trading volume dynamics influencing recent price behavior.
Trend Analysis
Oracle Corporation experienced a 70.69% price increase over the past 12 months, indicating a bullish trend with deceleration in momentum. The stock ranged from a low of 111.95 to a high of 308.66, with notable volatility at a 49.0 standard deviation.
MongoDB, Inc. showed an 11.46% price decline over the same period, reflecting a bearish trend with accelerating downward pressure. The stock fluctuated between 154.39 and 451.52, exhibiting higher volatility at a 72.49 standard deviation.
Oracle’s stock delivered the highest market performance with a significant price gain, while MongoDB’s stock experienced a notable decline despite recent bullish momentum.
Target Prices
The consensus target prices for Oracle Corporation and MongoDB, Inc. suggest attractive upside potential from current levels.
| Company | Target High | Target Low | Consensus |
|---|---|---|---|
| Oracle Corporation | 400 | 175 | 314.08 |
| MongoDB, Inc. | 500 | 375 | 445.2 |
Oracle’s target consensus of 314.08 significantly exceeds its current price near 191, indicating robust analyst confidence. MongoDB’s consensus target of 445.2 is also well above its current price around 400, reflecting positive expectations for growth.
Analyst Opinions Comparison
This section compares analysts’ ratings and grades for Oracle Corporation and MongoDB, Inc.:
Rating Comparison
Oracle Corporation Rating
- Rating: B, considered Very Favorable
- Discounted Cash Flow Score: 3, indicating Moderate value
- ROE Score: 5, rated Very Favorable for profit efficiency
- ROA Score: 4, Favorable asset utilization
- Debt To Equity Score: 1, Very Unfavorable, higher risk
- Overall Score: 3, Moderate overall financial standing
MongoDB, Inc. Rating
- Rating: C, considered Very Favorable
- Discounted Cash Flow Score: 2, indicating Moderate value
- ROE Score: 1, rated Very Unfavorable for profit efficiency
- ROA Score: 1, Very Unfavorable asset utilization
- Debt To Equity Score: 4, Favorable, lower financial risk
- Overall Score: 2, Moderate overall financial standing
Which one is the best rated?
Oracle holds a higher rating of B compared to MongoDB’s C. Oracle scores better on ROE, ROA, and overall financial standing, while MongoDB shows a more favorable debt-to-equity score. Overall, Oracle is the better-rated company based on these metrics.
Scores Comparison
Here is a comparison of the Altman Z-Score and Piotroski Score for Oracle Corporation and MongoDB, Inc.:
Oracle Corporation Scores
- Altman Z-Score: 2.43, placing Oracle in the grey zone indicating moderate bankruptcy risk.
- Piotroski Score: 5, categorized as average financial strength.
MongoDB, Inc. Scores
- Altman Z-Score: 30.24, placing MongoDB in the safe zone, indicating low bankruptcy risk.
- Piotroski Score: 4, categorized as average financial strength.
Which company has the best scores?
MongoDB has a significantly higher Altman Z-Score indicating stronger financial stability compared to Oracle, though both companies have similar average Piotroski Scores. Based strictly on these scores, MongoDB shows lower bankruptcy risk.
Grades Comparison
Here is a detailed comparison of the recent grades assigned to Oracle Corporation and MongoDB, Inc.:
Oracle Corporation Grades
This table summarizes the latest grades assigned by reputable grading companies for Oracle Corporation.
| Grading Company | Action | New Grade | Date |
|---|---|---|---|
| UBS | Maintain | Buy | 2026-01-05 |
| RBC Capital | Maintain | Sector Perform | 2026-01-05 |
| Jefferies | Maintain | Buy | 2026-01-05 |
| Goldman Sachs | Maintain | Neutral | 2025-12-12 |
| Keybanc | Maintain | Overweight | 2025-12-11 |
| UBS | Maintain | Buy | 2025-12-11 |
| Citigroup | Maintain | Buy | 2025-12-11 |
| JP Morgan | Maintain | Neutral | 2025-12-11 |
| DA Davidson | Maintain | Neutral | 2025-12-11 |
| Scotiabank | Maintain | Sector Outperform | 2025-12-11 |
Oracle Corporation’s grades show a mixed but generally positive trend with multiple “Buy,” “Overweight,” and “Sector Outperform” ratings alongside several “Neutral” and “Sector Perform” evaluations.
MongoDB, Inc. Grades
This table summarizes the latest grades assigned by reputable grading companies for MongoDB, Inc.
| Grading Company | Action | New Grade | Date |
|---|---|---|---|
| Needham | Maintain | Buy | 2026-01-12 |
| Barclays | Maintain | Overweight | 2026-01-12 |
| Truist Securities | Maintain | Buy | 2026-01-07 |
| Needham | Maintain | Buy | 2026-01-06 |
| RBC Capital | Maintain | Outperform | 2026-01-05 |
| Argus Research | Maintain | Buy | 2025-12-04 |
| Citigroup | Maintain | Buy | 2025-12-03 |
| Goldman Sachs | Maintain | Buy | 2025-12-03 |
| Canaccord Genuity | Maintain | Buy | 2025-12-02 |
| Morgan Stanley | Maintain | Overweight | 2025-12-02 |
MongoDB, Inc. consistently receives strong positive grades, predominantly “Buy,” “Overweight,” and “Outperform,” indicating a notably bullish consensus among grading firms.
Which company has the best grades?
MongoDB, Inc. holds a stronger overall rating profile compared to Oracle Corporation, with a larger proportion of “Buy” and “Outperform” grades. This suggests that investors may perceive greater growth potential or favorable prospects in MongoDB, while Oracle’s more mixed grades reflect a balanced risk-return profile.
Strengths and Weaknesses
Below is a comparison of Oracle Corporation (ORCL) and MongoDB, Inc. (MDB) based on key investment criteria.
| Criterion | Oracle Corporation (ORCL) | MongoDB, Inc. (MDB) |
|---|---|---|
| Diversification | Highly diversified: Cloud & License $49.2B, Services $5.2B, Hardware $2.9B (2025) | Less diversified: MongoDB Atlas $1.4B, Other Subscription $539M, Services $63M (2025) |
| Profitability | Strong profitability: Net margin 21.7%, ROE 60.8%, ROIC 10.9% (2025) | Negative profitability: Net margin -6.4%, ROE -4.6%, ROIC -7.4% (2025) but improving ROIC trend |
| Innovation | Moderate innovation; declining ROIC trend, slightly unfavorable moat | High innovation focus; growing ROIC trend but still value-destroying, slightly unfavorable moat |
| Global presence | Extensive global footprint with broad enterprise adoption | Growing global presence focused on cloud database services |
| Market Share | Large, established market share in enterprise software and cloud | Smaller, rapidly growing market share in modern database solutions |
Key takeaways: Oracle offers strong profitability and diversification but faces a declining profitability trend. MongoDB shows rapid growth and innovation with improving profitability, though it remains unprofitable overall. Investors should weigh Oracle’s stability against MongoDB’s high-growth potential and risk.
Risk Analysis
Below is a comparative table highlighting key risk factors for Oracle Corporation (ORCL) and MongoDB, Inc. (MDB) based on the most recent fiscal year 2025 data.
| Metric | Oracle Corporation (ORCL) | MongoDB, Inc. (MDB) |
|---|---|---|
| Market Risk | Beta 1.65 (higher volatility) | Beta 1.38 (moderate volatility) |
| Debt level | High leverage: Debt/Equity 5.09, Debt to Assets 61.8% (unfavorable) | Very low debt: Debt/Equity 0.01, Debt to Assets 1.06% (favorable) |
| Regulatory Risk | Moderate, tech industry compliance | Moderate, cloud data regulations |
| Operational Risk | Large scale operations with 159K employees; risk in integration and legacy systems | Smaller scale, 5.5K employees; risk in scaling cloud services |
| Environmental Risk | Moderate; hardware manufacturing impact | Low; primarily software services |
| Geopolitical Risk | Exposure to global markets; US base | US-focused but with global cloud presence |
Oracle’s most significant risk lies in its high debt level combined with a beta above 1.6, indicating vulnerability to market swings and financial leverage risks. MongoDB, while less leveraged and in the “safe zone” for bankruptcy risk, faces operational scaling challenges and negative profitability metrics that could impact long-term stability. Both companies face moderate regulatory risks typical of the software infrastructure sector.
Which Stock to Choose?
Oracle Corporation (ORCL) shows consistent revenue growth of 8.38% in 2025 with favorable profitability and net margin at 21.68%. Despite a high debt level and a slightly unfavorable financial ratio profile, its overall rating is very favorable, reflecting solid return on equity and assets, though it faces a declining ROIC trend.
MongoDB, Inc. (MDB) reports strong revenue growth of 19.22% and improving profitability metrics, yet its net margin remains negative at -6.43%. Financial ratios present a mixed picture with favorable leverage but unfavorable profitability measures, accompanied by a very favorable rating, while its ROIC is growing but still below WACC, indicating value destruction.
Investors prioritizing stable profitability and return metrics might find Oracle’s profile more aligned with their goals, whereas those focusing on growth potential and improving profitability trends could see MongoDB as more appealing, acknowledging the higher risk associated with its current financial condition.
Disclaimer: Investment carries a risk of loss of initial capital. The past performance is not a reliable indicator of future results. Be sure to understand risks before making an investment decision.
Go Further
I encourage you to read the complete analyses of Oracle Corporation and MongoDB, Inc. to enhance your investment decisions: