In the rapidly evolving software infrastructure sector, MongoDB, Inc. and Nutanix, Inc. stand out as key innovators shaping enterprise cloud and database solutions. Both companies offer cutting-edge technology platforms that support hybrid and multi-cloud environments, addressing overlapping market needs. This comparison aims to highlight their strategic strengths and growth potential, helping you determine which company presents the most compelling investment opportunity in 2026.
Table of contents
Companies Overview
I will begin the comparison between MongoDB and Nutanix by providing an overview of these two companies and their main differences.
MongoDB Overview
MongoDB, Inc. provides a general-purpose database platform globally, offering solutions such as MongoDB Enterprise Advanced, MongoDB Atlas cloud service, and a free Community Server. Founded in 2007 and headquartered in New York City, MongoDB focuses on database technology for enterprise and developer use, supporting cloud, on-premise, and hybrid environments. The company operates in the Software – Infrastructure industry with a market cap of 32.5B USD.
Nutanix Overview
Nutanix, Inc. delivers an enterprise cloud platform catering to multiple regions worldwide, including North America, Europe, and Asia Pacific. The company offers virtualization, storage, Kubernetes management, and cloud governance solutions alongside application lifecycle automation. Founded in 2009 and based in San Jose, California, Nutanix serves diverse industries and holds a market cap of 12.4B USD in the Software – Infrastructure sector.
Key similarities and differences
Both MongoDB and Nutanix operate in the Software – Infrastructure industry, focusing on cloud-related technology solutions and addressing enterprise clients globally. MongoDB specializes primarily in database platforms supporting various deployment models, while Nutanix provides a broader enterprise cloud platform including virtualization, cloud management, and automation services. Their market capitalizations and employee counts differ, reflecting distinct scales and operational scopes within the same sector.
Income Statement Comparison
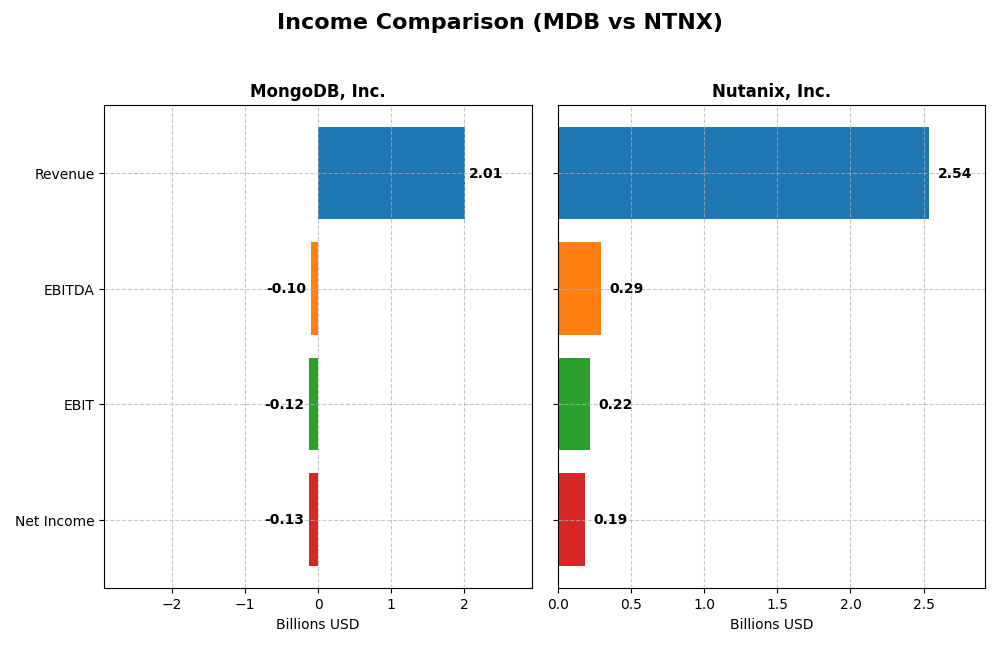
This table compares the key income statement metrics of MongoDB, Inc. and Nutanix, Inc. for the most recent fiscal year available, providing a snapshot of their financial performance.
| Metric | MongoDB, Inc. (MDB) | Nutanix, Inc. (NTNX) |
|---|---|---|
| Market Cap | 32.5B | 12.4B |
| Revenue | 2.01B | 2.54B |
| EBITDA | -97M | 293M |
| EBIT | -124M | 220M |
| Net Income | -129M | 188M |
| EPS | -1.73 | 0.70 |
| Fiscal Year | 2025 | 2025 |
Income Statement Interpretations
MongoDB, Inc.
MongoDB’s revenue rose significantly from $590M in 2021 to $2.01B in 2025, reflecting strong top-line growth. However, net income remained negative throughout, though losses narrowed from -$267M in 2021 to -$129M in 2025. Gross margin was stable at 73.3%, but EBIT margin stayed negative at -6.16%. The 2025 year showed improved revenue growth of 19.2% and better net margin performance.
Nutanix, Inc.
Nutanix increased revenue from $1.39B in 2021 to $2.54B in 2025, showing steady growth. Net income fluctuated but turned positive at $188M in 2025 after previous losses, with net margin rising to 7.42%. Gross margin improved to 86.8%, while EBIT margin moved from negative to a positive 8.67%. The latest year saw strong EBIT growth of 223% and marked net margin improvement.
Which one has the stronger fundamentals?
Nutanix demonstrates stronger fundamentals with consistent revenue growth, positive net income in 2025, and expanding margins including a healthy gross margin of 86.8%. MongoDB shows impressive revenue growth but remains unprofitable with negative EBIT and net margins. Both show favorable growth trends, yet Nutanix’s profitability and margin improvements suggest a more robust income statement profile.
Financial Ratios Comparison
The table below presents the latest key financial ratios for MongoDB, Inc. (MDB) and Nutanix, Inc. (NTNX) based on their most recent fiscal year data, facilitating a straightforward comparison.
| Ratios | MongoDB, Inc. (2025) | Nutanix, Inc. (2025) |
|---|---|---|
| ROE | -4.64% | -27.12% |
| ROIC | -7.36% | 8.11% |
| P/E | -158x | 107x |
| P/B | 7.32 | -28.95 |
| Current Ratio | 5.20 | 1.72 |
| Quick Ratio | 5.20 | 1.72 |
| D/E | 0.013 | -2.14 |
| Debt-to-Assets | 1.06% | 45.16% |
| Interest Coverage | -26.7x | 8.75x |
| Asset Turnover | 0.58 | 0.77 |
| Fixed Asset Turnover | 24.78 | 9.15 |
| Payout ratio | 0 | 0 |
| Dividend yield | 0% | 0% |
Interpretation of the Ratios
MongoDB, Inc.
MongoDB shows mostly unfavorable ratios, with negative net margin (-6.43%), ROE (-4.64%), and ROIC (-7.36%), indicating profitability and efficiency challenges. Its very high current ratio (5.2) suggests excess liquidity but is marked unfavorable, while debt levels are low and favorable. The company does not pay dividends, reflecting a focus on reinvestment and growth rather than shareholder returns.
Nutanix, Inc.
Nutanix displays a mixed ratio profile with a neutral net margin (7.42%) and ROIC (8.11%), but an unfavorable ROE (-27.12%), suggesting profitability concerns. It benefits from a favorable WACC (5.89%) and strong liquidity (current ratio 1.72). Like MongoDB, Nutanix does not pay dividends, likely prioritizing reinvestment and development over distributions to shareholders.
Which one has the best ratios?
Nutanix holds a more balanced and slightly favorable ratio profile with 50% favorable metrics, compared to MongoDB’s predominantly unfavorable standing at 57%. Nutanix’s stronger liquidity and interest coverage, alongside lower unfavorable ratios, position it ahead in terms of ratio strength, though both companies face profitability and return challenges to monitor closely.
Strategic Positioning
This section compares the strategic positioning of MongoDB, Inc. and Nutanix, Inc. based on market position, key segments, and exposure to technological disruption:
MongoDB, Inc.
- Market cap of 32.5B, operates globally in software infrastructure with moderate competitive pressure.
- Key segments include MongoDB Atlas multi-cloud DBaaS, enterprise subscriptions, and professional services.
- Focus on database platform technology; potential disruption from shifts in cloud and hybrid data solutions.
Nutanix, Inc.
- Market cap of 12.4B, strong presence in enterprise cloud platforms across multiple global regions.
- Key segments cover enterprise cloud platform products, virtualization, cloud governance, and automation services.
- Exposure to cloud-native technologies and hybrid cloud orchestration, facing evolving virtualization and cloud trends.
MongoDB, Inc. vs Nutanix, Inc. Positioning
MongoDB concentrates on database solutions with a significant cloud-based DBaaS offering, while Nutanix pursues a broader enterprise cloud platform approach including virtualization and automation. MongoDB’s focus offers depth, Nutanix’s breadth spans diverse IT infrastructure needs.
Which has the best competitive advantage?
Nutanix shows a very favorable moat with ROIC exceeding WACC and strong growth, indicating durable competitive advantage. MongoDB’s moat is slightly unfavorable despite improving ROIC, reflecting current value destruction but potential profitability growth.
Stock Comparison
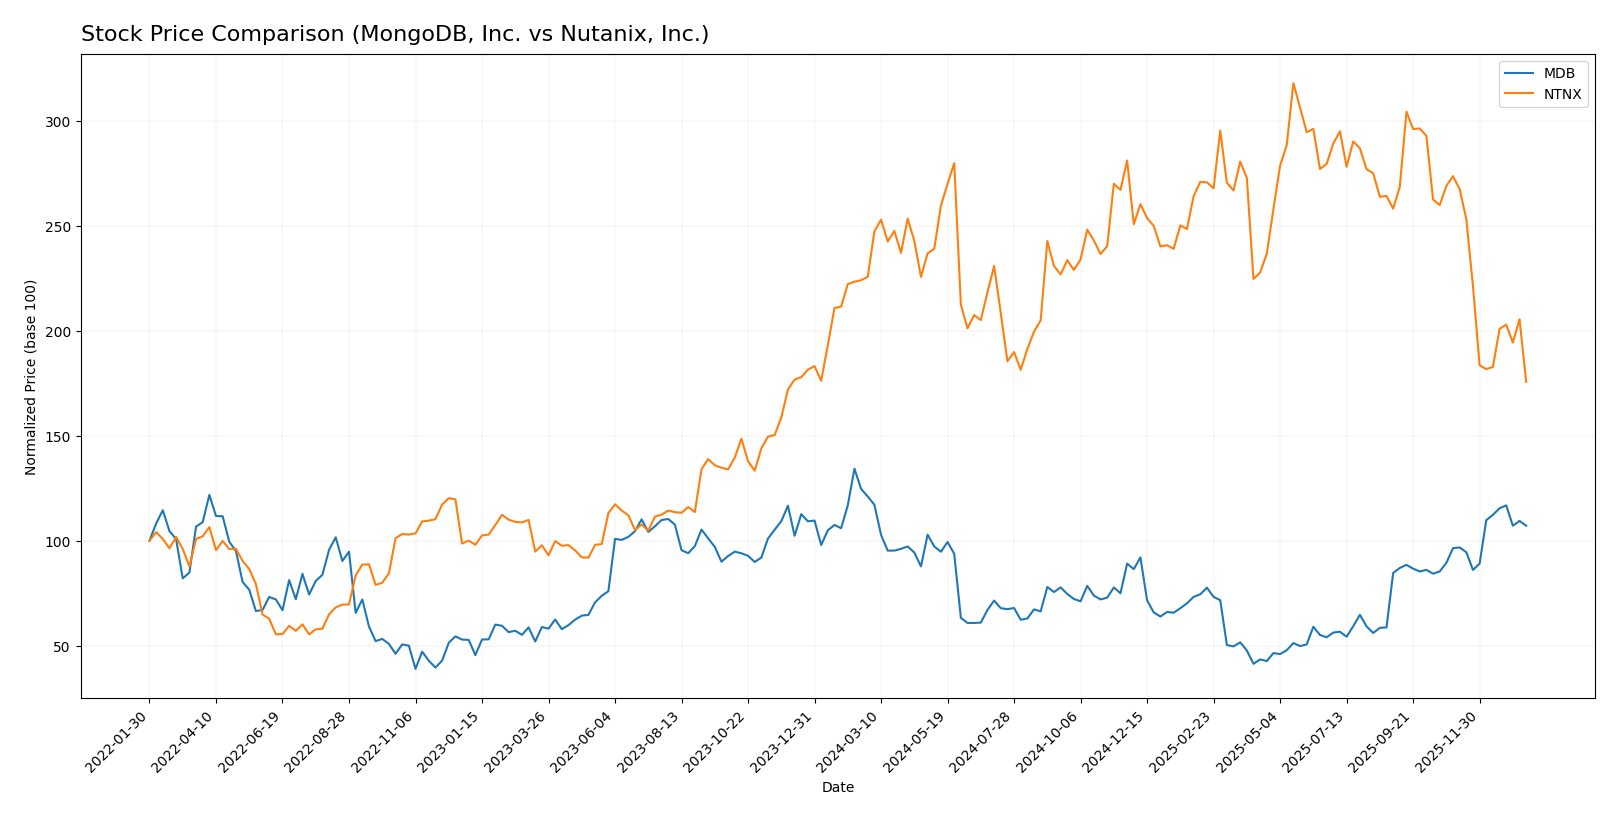
The stock prices of MongoDB, Inc. (MDB) and Nutanix, Inc. (NTNX) exhibited notable bearish trends over the past 12 months, with divergent recent trading dynamics reflecting contrasting investor sentiment.
Trend Analysis
MongoDB, Inc. experienced an overall bearish trend with a price drop of 11.46% over the past year, accompanied by accelerating downward momentum and high volatility (std. dev. 72.49). Recently, it reversed, gaining 11.1% from November 2025 to January 2026.
Nutanix, Inc. showed a stronger bearish trend, declining 22.16% over the year, but its decelerating trend and lower volatility (std. dev. 8.67) contrast with a sharp recent drop of 35.79% within the same recent period.
Comparing both, MongoDB outperformed Nutanix over the past year, showing less severe losses and a recent positive price recovery, while Nutanix posted deeper declines and continued weakness recently.
Target Prices
Analysts provide a bullish consensus on MongoDB, Inc. and a moderately optimistic outlook for Nutanix, Inc.
| Company | Target High | Target Low | Consensus |
|---|---|---|---|
| MongoDB, Inc. | 500 | 375 | 445.2 |
| Nutanix, Inc. | 90 | 53 | 64.67 |
The consensus target price of 445.2 for MongoDB suggests potential upside from its current price near 400 USD, while Nutanix’s target of 64.67 indicates room to grow from around 45.7 USD. Both stocks show promising analyst expectations relative to market prices.
Analyst Opinions Comparison
This section compares analysts’ ratings and grades for MongoDB, Inc. and Nutanix, Inc.:
Rating Comparison
MDB Rating
- Rating: C with a very favorable status.
- Discounted Cash Flow Score: 2, moderate valuation assessment.
- ROE Score: 1, very unfavorable efficiency in generating profit from equity.
- ROA Score: 1, very unfavorable asset utilization.
- Debt To Equity Score: 4, favorable financial risk profile with low leverage.
- Overall Score: 2, moderate financial standing.
NTNX Rating
- Rating: C+ with a very favorable status.
- Discounted Cash Flow Score: 4, favorable valuation assessment.
- ROE Score: 1, very unfavorable efficiency in generating profit from equity.
- ROA Score: 4, favorable asset utilization.
- Debt To Equity Score: 1, very unfavorable financial risk profile with high leverage.
- Overall Score: 2, moderate financial standing.
Which one is the best rated?
Based on the provided data, Nutanix has a higher rating (C+) and superior discounted cash flow and ROA scores, while MongoDB benefits from a stronger debt-to-equity score. Overall, Nutanix is slightly better rated.
Scores Comparison
Here is the comparison of the Altman Z-Score and Piotroski Score for MongoDB, Inc. and Nutanix, Inc.:
MDB Scores
- Altman Z-Score: 30.24, indicating a safe zone, very low bankruptcy risk.
- Piotroski Score: 4, reflecting average financial strength.
NTNX Scores
- Altman Z-Score: 1.48, indicating distress zone, high bankruptcy risk.
- Piotroski Score: 6, reflecting average financial strength.
Which company has the best scores?
MongoDB has a significantly higher Altman Z-Score, placing it in the safe zone, while Nutanix falls in the distress zone. Nutanix has a slightly better Piotroski Score, but both remain average. Overall, MongoDB’s scores indicate stronger financial stability.
Grades Comparison
The grades assigned to MongoDB, Inc. and Nutanix, Inc. by recognized grading companies are as follows:
MongoDB, Inc. Grades
The following table summarizes recent grades from reputable financial institutions for MongoDB, Inc.:
| Grading Company | Action | New Grade | Date |
|---|---|---|---|
| Barclays | Maintain | Overweight | 2026-01-12 |
| Needham | Maintain | Buy | 2026-01-12 |
| Truist Securities | Maintain | Buy | 2026-01-07 |
| Needham | Maintain | Buy | 2026-01-06 |
| RBC Capital | Maintain | Outperform | 2026-01-05 |
| Argus Research | Maintain | Buy | 2025-12-04 |
| Goldman Sachs | Maintain | Buy | 2025-12-03 |
| Citigroup | Maintain | Buy | 2025-12-03 |
| Canaccord Genuity | Maintain | Buy | 2025-12-02 |
| Piper Sandler | Maintain | Overweight | 2025-12-02 |
The overall trend for MongoDB, Inc. is consistently positive with majority buy and overweight ratings from top-tier financial institutions.
Nutanix, Inc. Grades
The following table summarizes recent grades from reputable financial institutions for Nutanix, Inc.:
| Grading Company | Action | New Grade | Date |
|---|---|---|---|
| Barclays | Downgrade | Equal Weight | 2026-01-15 |
| Morgan Stanley | Downgrade | Equal Weight | 2026-01-12 |
| RBC Capital | Maintain | Outperform | 2026-01-05 |
| Goldman Sachs | Maintain | Buy | 2025-11-28 |
| JP Morgan | Maintain | Overweight | 2025-11-26 |
| Needham | Maintain | Buy | 2025-11-26 |
| Wells Fargo | Maintain | Equal Weight | 2025-11-26 |
| Morgan Stanley | Maintain | Overweight | 2025-11-26 |
| Keybanc | Maintain | Overweight | 2025-11-26 |
| Piper Sandler | Maintain | Overweight | 2025-11-26 |
Nutanix, Inc. shows a mixed pattern with recent downgrades by Barclays and Morgan Stanley, offset by several buy and overweight ratings from other respected firms.
Which company has the best grades?
MongoDB, Inc. has received consistently stronger buy and overweight ratings compared to Nutanix, Inc., which experienced recent downgrades to equal weight. Investors may interpret MongoDB’s steadier positive consensus as a sign of stronger analyst confidence relative to Nutanix.
Strengths and Weaknesses
Below is a comparison table summarizing the strengths and weaknesses of MongoDB, Inc. (MDB) and Nutanix, Inc. (NTNX) based on their latest financial and strategic data.
| Criterion | MongoDB, Inc. (MDB) | Nutanix, Inc. (NTNX) |
|---|---|---|
| Diversification | Moderate: Mainly driven by MongoDB Atlas (1.4B) and other subscriptions (539M) | High: Strong subscription base (2B) plus professional services (101M) |
| Profitability | Unfavorable: Negative net margin (-6.43%), ROIC -7.36%, shedding value | Neutral to slightly favorable: Positive net margin (7.42%), ROIC 8.11%, creating value |
| Innovation | Growing ROIC trend indicates improving operational efficiency but still value destructive | Very favorable moat with durable competitive advantage and growing ROIC |
| Global presence | Strong cloud presence with Atlas platform growth | Well-established hybrid cloud and subscription services globally |
| Market Share | Growing but currently smaller scale compared to NTNX | Larger market share with diversified offerings and stable revenue streams |
Key takeaways: Nutanix demonstrates a stronger and more sustainable competitive position with profitable operations and a diverse revenue base. MongoDB shows promising growth and innovation but currently struggles with profitability and value creation, signaling higher risk for investors.
Risk Analysis
Below is a comparative risk table for MongoDB, Inc. (MDB) and Nutanix, Inc. (NTNX) based on the most recent financial and market data from 2025.
| Metric | MongoDB, Inc. (MDB) | Nutanix, Inc. (NTNX) |
|---|---|---|
| Market Risk | High beta 1.38; volatile price range (140.78-444.72) | Low beta 0.49; less volatile but recent 6% decline |
| Debt level | Very low debt-to-equity 0.01; low debt to assets 1.06% | Moderate debt-to-assets 45.16%; negative debt/equity ratio |
| Regulatory Risk | Moderate; operates globally with cloud data regulations | Moderate; global presence with data compliance requirements |
| Operational Risk | Negative net margin (-6.43%) and ROE (-4.64%) indicate operational challenges | Mixed profitability with 7.42% net margin but negative ROE (-27.12%) |
| Environmental Risk | Moderate; technology sector with limited direct impact | Moderate; similar sector exposure to environmental factors |
| Geopolitical Risk | Exposure to US and international markets; potential cloud service restrictions | Similar global exposure; risks from geopolitical tensions affecting cloud infrastructure |
The most impactful risk for MongoDB is operational, with persistent negative profitability and return metrics despite strong liquidity and low debt, signaling challenges in scaling profitably. Nutanix faces a notable financial distress risk, reflected in its Altman Z-score in the distress zone and negative equity returns, compounded by moderate leverage. Market volatility is higher for MongoDB, increasing investor risk exposure. Both companies have moderate regulatory and geopolitical risks typical for global cloud infrastructure providers. Caution and active risk management are advised.
Which Stock to Choose?
MongoDB, Inc. (MDB) shows favorable income growth with a 19.22% revenue increase in 2025 and strong gross margin at 73.32%, but suffers from negative profitability ratios, high net margin losses (-6.43%), and an unfavorable overall financial ratio assessment. Its debt levels are low, and it holds a very favorable rating despite a slightly unfavorable MOAT due to value destruction, though ROIC is improving.
Nutanix, Inc. (NTNX) also demonstrates favorable income growth with 18.11% revenue growth and a higher gross margin of 86.81%. Profitability ratios are mixed, with a neutral net margin of 7.42% but an unfavorable ROE. Financial ratios are slightly favorable overall, supported by a very favorable MOAT indicating value creation and sustained profitability, though it carries higher debt levels and a moderate rating.
For investors prioritizing growth and improving profitability, MDB’s strong income trends and improving ROIC might appear attractive despite weaker financial ratios. Conversely, NTNX could be viewed as more suitable for those seeking companies with a durable competitive advantage and slightly favorable financial health, balancing growth with value creation. The choice may depend on the investor’s risk tolerance and strategy focus.
Disclaimer: Investment carries a risk of loss of initial capital. The past performance is not a reliable indicator of future results. Be sure to understand risks before making an investment decision.
Go Further
I encourage you to read the complete analyses of MongoDB, Inc. and Nutanix, Inc. to enhance your investment decisions: