Home > Comparison > Consumer Defensive > MDLZ vs HSY
The strategic rivalry between Mondelez International, Inc. and The Hershey Company shapes the competitive landscape of the food confectioners industry. Mondelez operates as a global snack powerhouse with a broad product portfolio and extensive distribution. In contrast, Hershey focuses on North American confectionery leadership with a diversified snack segment. This analysis will assess which company offers the superior risk-adjusted investment profile amid evolving consumer preferences and sector dynamics.
Table of contents
Companies Overview
Mondelez International and The Hershey Company dominate the global food confectioners market with distinct scale and reach.
Mondelez International, Inc.: Global Snack Food Powerhouse
Mondelez International leads as a global snack food manufacturer. Its core revenue stems from biscuits, chocolates, and powdered beverages sold across multiple continents. In 2026, Mondelez focuses on expanding its footprint through direct store delivery and e-commerce, leveraging a broad brand portfolio including Oreo and Cadbury to maintain global market relevance.
The Hershey Company: Iconic U.S. Confectionery Leader
The Hershey Company commands the North American market with a strong presence in confectionery and salty snacks. It generates revenue from diverse segments, including chocolate products and pantry items, emphasizing iconic brands like Reese’s and Hershey’s. Hershey’s 2026 strategy targets innovation within snack categories and expansion in international markets, backed by a streamlined portfolio and focused distribution.
Strategic Collision: Similarities & Divergences
Mondelez pursues a broad global scale with a diversified product lineup and multi-channel distribution. Hershey concentrates on a focused North American base and selective international growth. Both battle fiercely in confectionery, but Mondelez’s vast geographic reach contrasts with Hershey’s deep brand loyalty. Investors face a choice between Mondelez’s scale-driven growth and Hershey’s focused, innovation-led resilience.
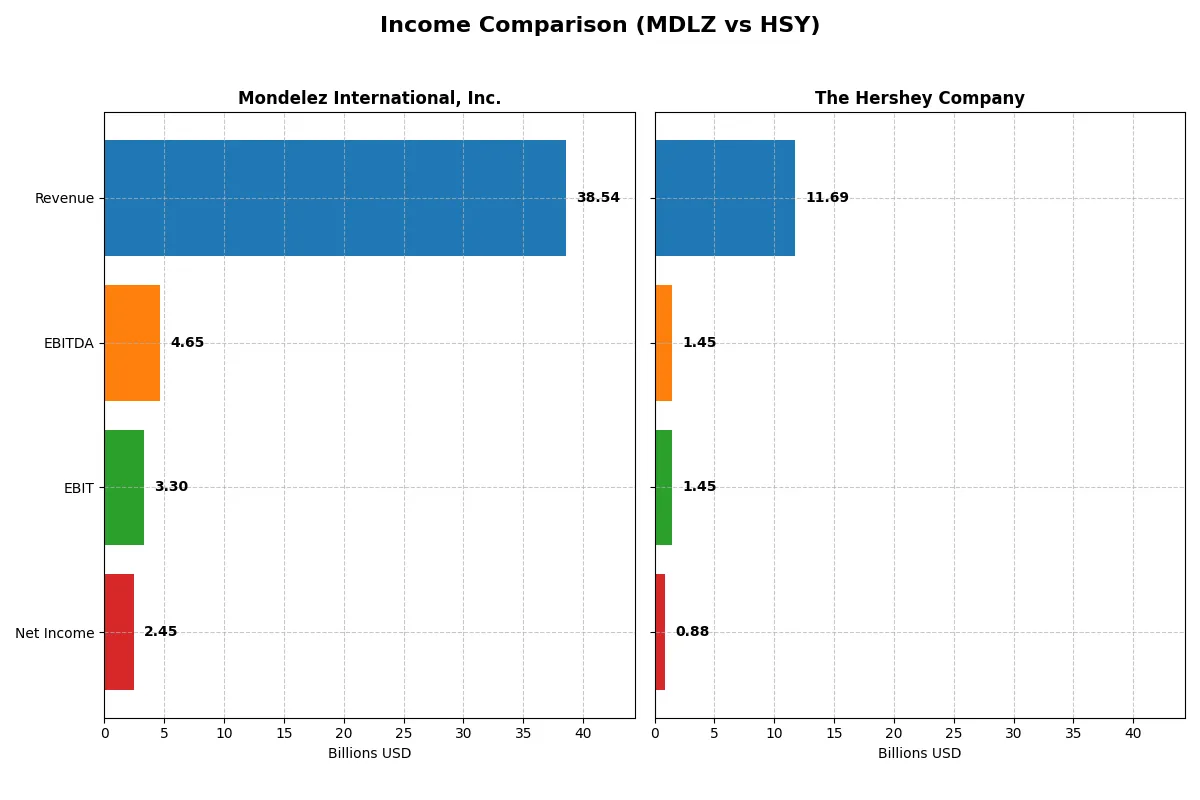
Income Statement Comparison
This data dissects the core profitability and scalability of both corporate engines to reveal who dominates the bottom line:
| Metric | Mondelez International, Inc. (MDLZ) | The Hershey Company (HSY) |
|---|---|---|
| Revenue | 38.5B | 11.7B |
| Cost of Revenue | 27.7B | 7.8B |
| Operating Expenses | 7.2B | 2.5B |
| Gross Profit | 10.8B | 3.9B |
| EBITDA | 4.7B | 1.4B |
| EBIT | 3.3B | 1.4B |
| Interest Expense | 282M | 207M |
| Net Income | 2.5B | 883M |
| EPS | 1.89 | 4.4 |
| Fiscal Year | 2025 | 2025 |
Income Statement Analysis: The Bottom-Line Duel
This income statement comparison reveals how efficiently each company converts sales into profit and manages expenses in a competitive market.
Mondelez International, Inc. Analysis
Mondelez’s revenue grew steadily from $28.7B in 2021 to $38.5B in 2025, showing solid top-line momentum. However, net income declined significantly from $4.3B to $2.5B, reflecting margin compression. Gross margin dropped sharply to 28.0%, and EBIT margin softened to 8.5%, signaling weakened operational efficiency in 2025.
The Hershey Company Analysis
Hershey’s revenue increased from $8.97B in 2021 to $11.7B in 2025, maintaining consistent growth. Net income followed a similar pattern, rising until 2024 but falling to $883M in 2025. Margins remain healthier than Mondelez’s, with a gross margin of 33.3% and EBIT margin of 12.4% in 2025, though recent declines suggest cost pressures and margin erosion.
Margin Strength vs. Profit Scale
Hershey sustains higher margins, reflecting stronger operational control and pricing power. Mondelez, despite larger revenue and scale, faces sharper margin deterioration and net income declines. For investors, Hershey’s profile offers superior profitability resilience, while Mondelez’s scale comes with greater margin risk.
Financial Ratios Comparison
These vital ratios act as a diagnostic tool to expose the underlying fiscal health, valuation premiums, and capital efficiency of the companies analyzed:
| Ratios | Mondelez International, Inc. (MDLZ) | The Hershey Company (HSY) |
|---|---|---|
| ROE | 9.5% | 19.0% |
| ROIC | 5.1% | 9.0% |
| P/E | 28.4 | 30.5 |
| P/B | 2.7 | 5.8 |
| Current Ratio | 0.59 | 1.19 |
| Quick Ratio | 0.39 | 0.72 |
| D/E | 0.87 | 1.17 |
| Debt-to-Assets | 31.3% | 39.3% |
| Interest Coverage | 12.8 | 6.8 |
| Asset Turnover | 0.54 | 0.85 |
| Fixed Asset Turnover | 3.38 | 3.31 |
| Payout Ratio | 101.5% | 91.8% |
| Dividend Yield | 3.57% | 3.01% |
| Fiscal Year | 2025 | 2025 |
Efficiency & Valuation Duel: The Vital Signs
Ratios act as a company’s DNA, exposing hidden risks and operational strengths that shape investment outcomes beyond surface numbers.
Mondelez International, Inc.
Mondelez posts a modest 9.5% ROE with neutral net margin at 6.36%, signaling moderate profitability. Its P/E of 28.4 suggests a stretched valuation, while a 3.57% dividend yield rewards shareholders. The firm balances reinvestment with stable payouts despite a weak current ratio at 0.59, flagging liquidity concerns.
The Hershey Company
Hershey outperforms with a strong 19.1% ROE and a slightly higher net margin of 7.55%. The valuation appears expensive with a P/E of 30.5 and a lofty PB of 5.81. It offers a 3.01% dividend yield, sustaining shareholder returns amid elevated debt levels and a solid current ratio of 1.19.
Premium Valuation vs. Operational Safety
Hershey delivers superior profitability but at a higher valuation and leverage risk. Mondelez trades cheaper with better liquidity concerns. Investors prioritizing operational strength may prefer Mondelez, while those seeking growth and return might lean toward Hershey.
Which one offers the Superior Shareholder Reward?
I observe Mondelez International (MDLZ) and The Hershey Company (HSY) both prioritize shareholder return but with distinct approaches. MDLZ offers a 3.57% dividend yield with a payout ratio slightly over 100%, signaling aggressive distributions funded by free cash flow (2.5/share). Its buyback program is steady but moderate. HSY delivers a 3.01% dividend yield with a high payout ratio near 92%, indicating solid dividend coverage despite elevated debt levels. HSY’s buybacks appear less transparent but free cash flow per share is robust. MDLZ’s reinvestment and buyback balance seem more sustainable long term. Therefore, I conclude MDLZ offers a superior total return profile in 2026 due to sustainable dividends complemented by disciplined buybacks and consistent free cash flow generation.
Comparative Score Analysis: The Strategic Profile
The radar chart reveals the fundamental DNA and trade-offs of Mondelez International and The Hershey Company, highlighting their core financial strengths and weaknesses:
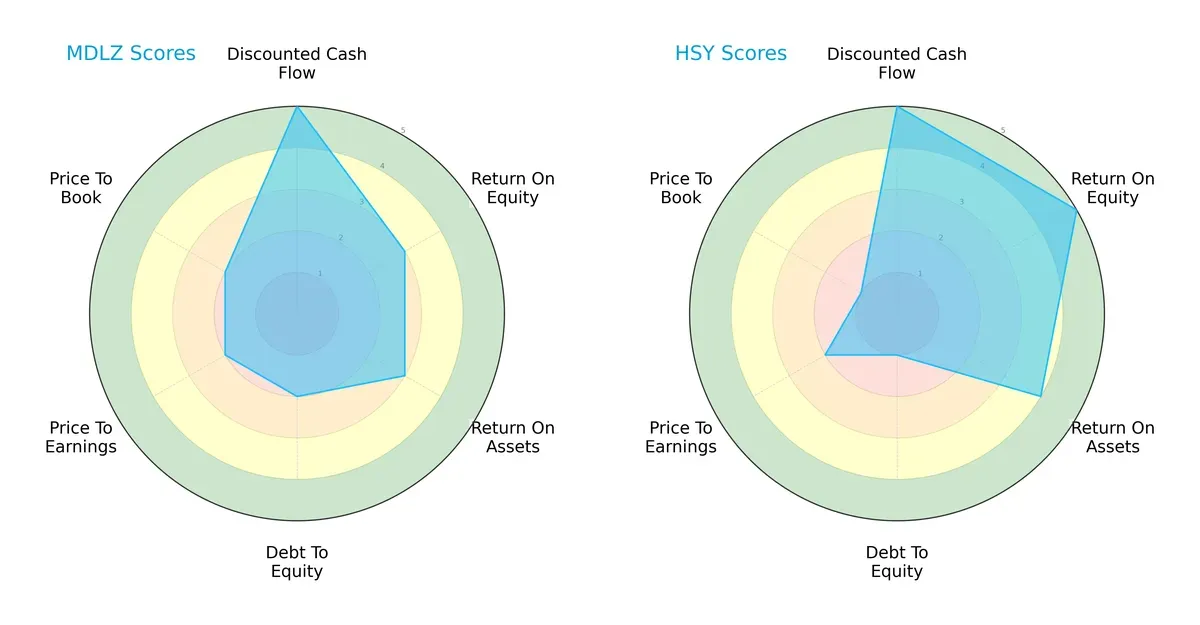
Both firms score equally on overall financial health and discounted cash flow, showing strong cash generation. Hershey excels in return on equity (5 vs. 3) and return on assets (4 vs. 3), indicating superior operational efficiency. Mondelez holds a slight advantage in debt management (2 vs. 1), though both show concerning valuation scores (P/E and P/B) signaling potential overvaluation. Hershey’s profile is more skewed toward profitability, while Mondelez presents a more balanced but modestly weaker risk-return trade-off.
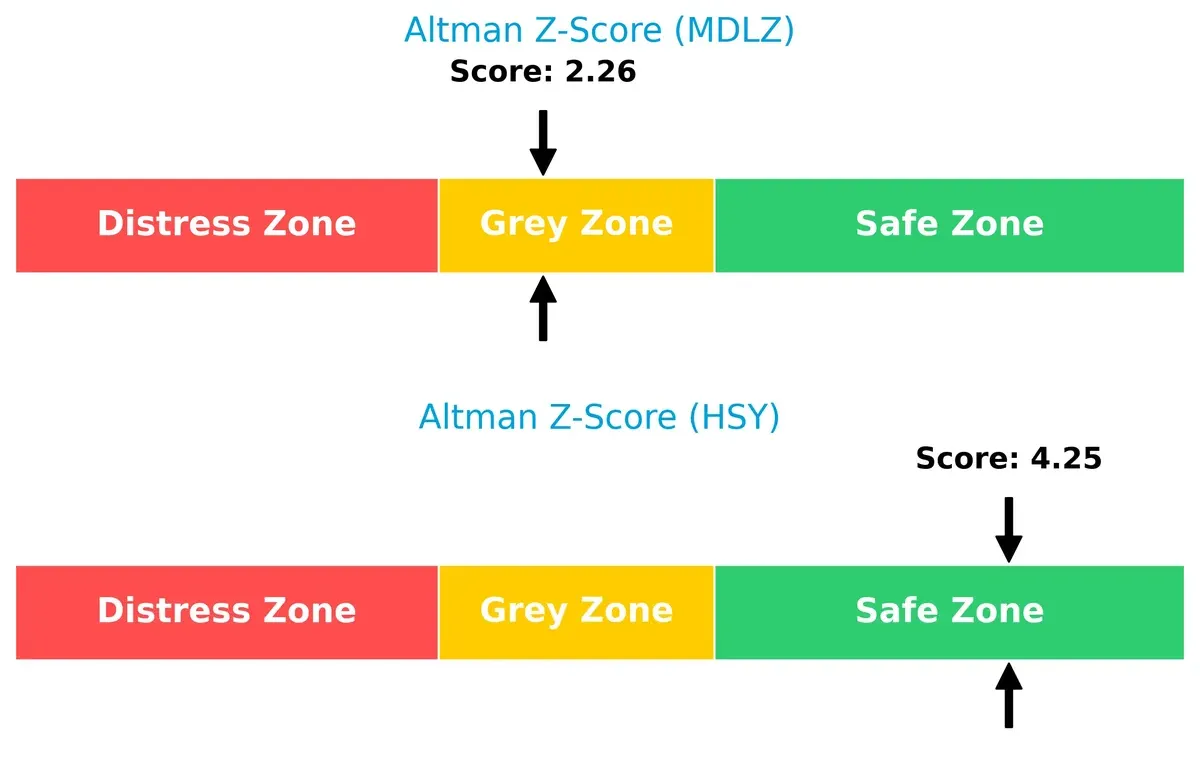
Bankruptcy Risk: Solvency Showdown
Mondelez’s Altman Z-Score of 2.26 places it in the grey zone, suggesting moderate bankruptcy risk. Hershey’s strong 4.25 score in the safe zone indicates robust solvency and lower default risk in this cycle:
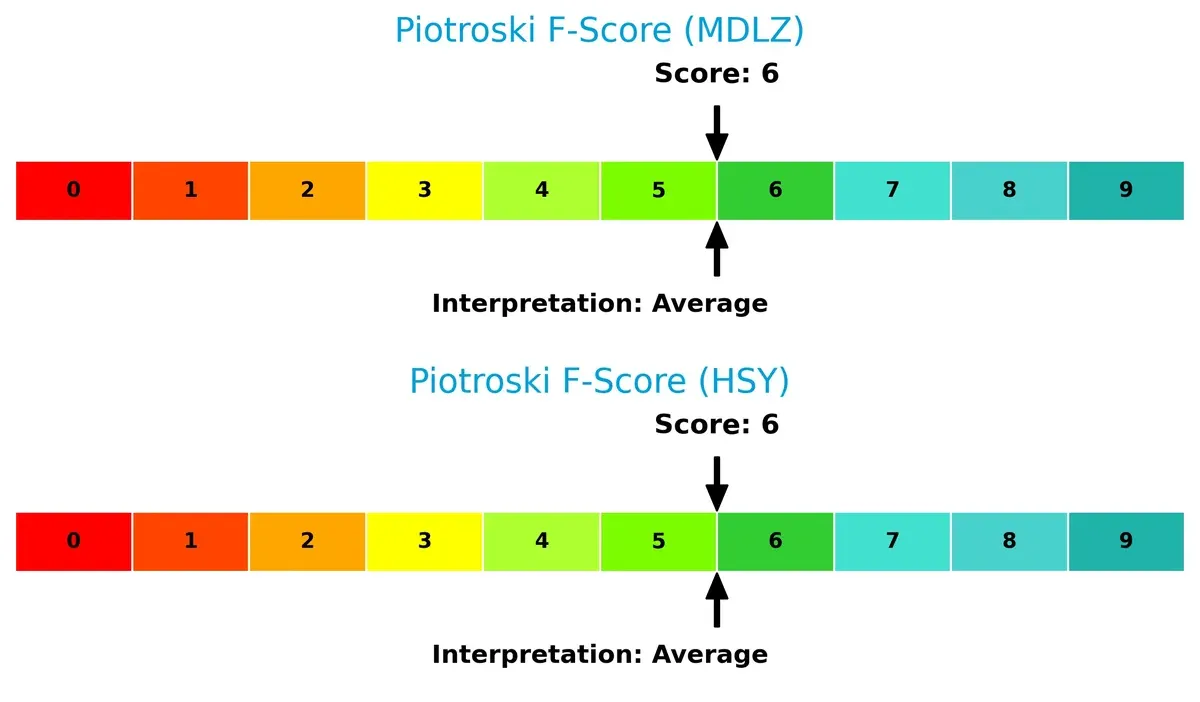
Financial Health: Quality of Operations
Both companies share an average Piotroski F-Score of 6, reflecting solid but not peak financial health. Neither shows immediate internal red flags, but there is room for improvement in operational efficiency and balance sheet strength:
How are the two companies positioned?
This section dissects the operational DNA of MDLZ and HSY by comparing revenue distribution and internal dynamics. The final goal confronts their economic moats to reveal the most resilient and sustainable competitive advantage today.
Revenue Segmentation: The Strategic Mix
This visual comparison dissects how Mondelez International and The Hershey Company diversify their income streams and where their primary sector bets lie:
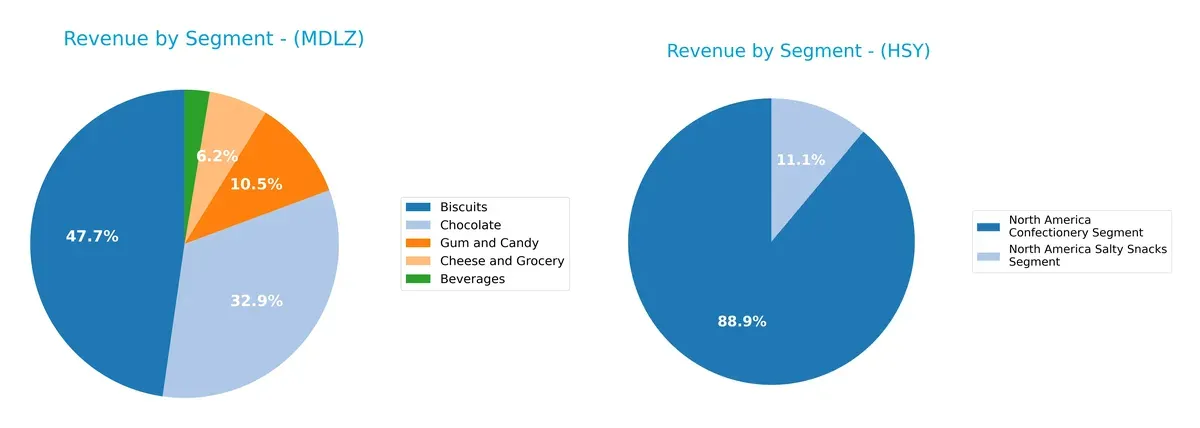
Mondelez’s revenue pivots around Biscuits at $18.4B, anchoring its diverse portfolio that includes Chocolate ($12.7B) and Gum and Candy ($4.1B). Hershey dwarfs Mondelez in North America Confectionery at $9.1B but relies heavily on this single segment, with Salty Snacks contributing just $1.1B. Mondelez’s broad mix reduces concentration risk, while Hershey’s focus signals strong ecosystem lock-in but exposes it to sector-specific volatility.
Strengths and Weaknesses Comparison
This table compares the strengths and weaknesses of Mondelez International and The Hershey Company:
Mondelez International Strengths
- Diversified product mix including biscuits, chocolate, gum, cheese, and beverages
- Significant global presence with strong revenues in Europe, Asia, Latin America, and North America
- Favorable interest coverage and fixed asset turnover ratios
- Attractive dividend yield at 3.57%
The Hershey Company Strengths
- Higher return on equity at 19.05% indicating efficient capital use
- Strong North American confectionery segment dominance
- Favorable weighted average cost of capital and fixed asset turnover
- Solid dividend yield at 3.01%
Mondelez International Weaknesses
- Below-par current and quick ratios indicating liquidity concerns
- Unfavorable return on equity and elevated price-to-earnings ratio at 28.42
- Moderate net margin at 6.36%
- Neutral debt-to-assets but slightly high debt/equity ratio
The Hershey Company Weaknesses
- Relatively high price-to-book ratio at 5.81 and price-to-earnings at 30.49
- Elevated debt/equity ratio at 1.17
- Quick ratio below 1 signals liquidity risk
- Geographic revenue heavily concentrated in North America
Mondelez benefits from broad product and geographic diversification, which supports resilience across markets. Hershey’s strengths lie in profitability and capital efficiency, albeit with concentration risks and higher valuation multiples. Both companies face liquidity and leverage challenges that could influence their strategic flexibility.
The Moat Duel: Analyzing Competitive Defensibility
A structural moat alone shields long-term profits from relentless competition and margin erosion. Let’s dissect how these firms defend their turf:
Mondelez International, Inc.: Global Brand Portfolio with Geographic Diversification
Mondelez’s moat stems from its vast brand portfolio and broad geographic reach, supporting stable margins near 28%. However, declining ROIC signals weakening capital efficiency in 2026. Expansion in emerging markets could deepen this moat, but margin pressure is a threat.
The Hershey Company: Premium Brand Loyalty Anchored in North America
Hershey’s moat relies on strong brand loyalty and premium product positioning, reflected in superior 33% gross margins and a ROIC well above WACC. Despite a declining ROIC trend, Hershey’s focused North American market and innovation pipeline sustain its competitive edge into 2026.
Global Brand Reach vs. Premium Loyalty: The Moat Face-off
Hershey’s premium brand loyalty creates a deeper economic moat than Mondelez’s broad but less efficient global footprint. I see Hershey better positioned to defend market share despite both firms facing profitability headwinds.
Which stock offers better returns?
Over the past 12 months, Mondelez International, Inc. and The Hershey Company exhibited contrasting price dynamics, with notable shifts in trend trajectories and trading volumes.
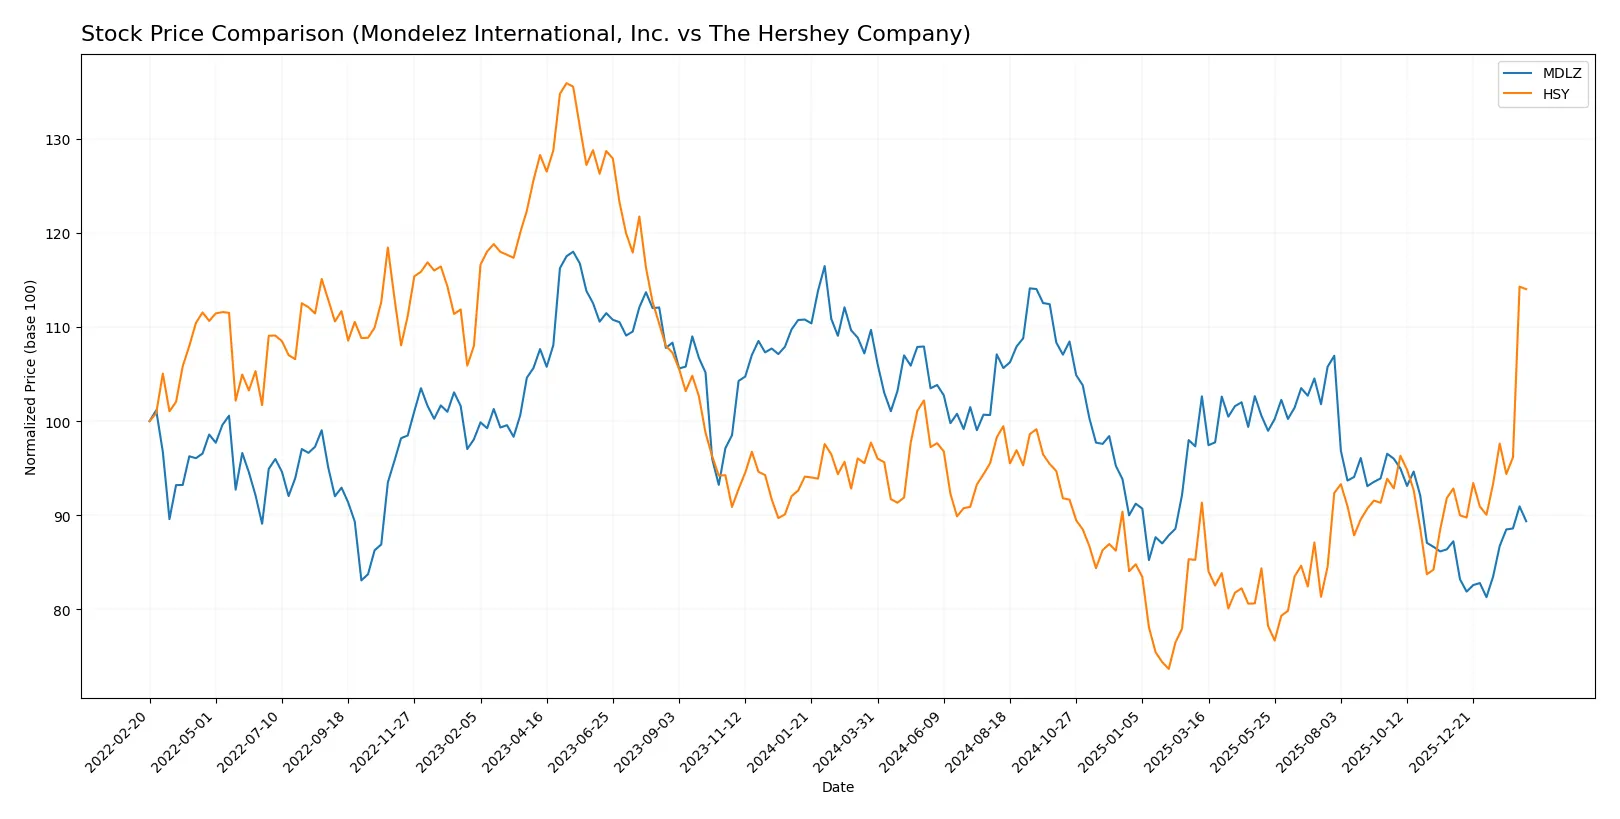
Trend Comparison
Mondelez International, Inc. showed a bearish trend with an 18.54% price decline over the last year, despite recent acceleration and a modest 2.45% rebound since November 2025.
The Hershey Company recorded a bullish 16.67% price gain over the same period, accelerating further with a 22.82% increase since late 2025 amid higher volatility.
The Hershey Company outperformed Mondelez significantly, delivering strong positive returns while Mondelez experienced a substantial annual decline.
Target Prices
Analysts present a cautiously optimistic consensus on Mondelez International and The Hershey Company.
| Company | Target Low | Target High | Consensus |
|---|---|---|---|
| Mondelez International, Inc. | 61 | 84 | 67.5 |
| The Hershey Company | 181 | 267 | 226.5 |
The consensus target for Mondelez exceeds its current price of 59.34, suggesting moderate upside potential. Hershey’s target consensus closely aligns with its current price of 231.52, indicating a fairly valued stock with mixed near-term expectations.

Don’t Let Luck Decide Your Entry Point
Optimize your entry points with our advanced ProRealTime indicators. You’ll get efficient buy signals with precise price targets for maximum performance. Start outperforming now!
How do institutions grade them?
Mondelez International, Inc. Grades
The following table summarizes recent grades from reputable institutions for Mondelez International, Inc.:
| Grading Company | Action | New Grade | Date |
|---|---|---|---|
| Piper Sandler | Maintain | Neutral | 2026-02-04 |
| JP Morgan | Maintain | Overweight | 2026-02-04 |
| Wells Fargo | Maintain | Overweight | 2026-02-04 |
| Stifel | Maintain | Buy | 2026-02-04 |
| DA Davidson | Maintain | Neutral | 2026-02-04 |
| DA Davidson | Maintain | Neutral | 2026-01-29 |
| JP Morgan | Maintain | Overweight | 2026-01-21 |
| UBS | Maintain | Neutral | 2026-01-14 |
| TD Cowen | Maintain | Buy | 2026-01-08 |
| Mizuho | Maintain | Outperform | 2026-01-08 |
The Hershey Company Grades
This table details recent institutional grades for The Hershey Company from verified sources:
| Grading Company | Action | New Grade | Date |
|---|---|---|---|
| Stifel | Maintain | Hold | 2026-02-06 |
| DA Davidson | Maintain | Neutral | 2026-02-06 |
| Wells Fargo | Maintain | Equal Weight | 2026-02-06 |
| RBC Capital | Maintain | Sector Perform | 2026-02-03 |
| DA Davidson | Maintain | Neutral | 2026-02-02 |
| Jefferies | Maintain | Neutral | 2026-02-02 |
| UBS | Maintain | Neutral | 2026-01-14 |
| Piper Sandler | Upgrade | Overweight | 2026-01-07 |
| Wells Fargo | Upgrade | Equal Weight | 2026-01-05 |
| Piper Sandler | Maintain | Neutral | 2025-12-19 |
Which company has the best grades?
Mondelez consistently receives higher grades including Buy and Outperform ratings from multiple firms. Hershey’s grades predominantly range from Hold to Neutral, with fewer upgrades. Investors may interpret Mondelez’s stronger grades as greater institutional confidence.
Risks specific to each company
The following categories pinpoint the critical pressure points and systemic threats facing Mondelez International, Inc. and The Hershey Company in the 2026 market environment:
1. Market & Competition
Mondelez International, Inc.
- Faces intense global competition with diversified snack brands across multiple regions.
The Hershey Company
- Operates in a highly competitive U.S.-centric market with strong brand loyalty but less geographic diversity.
2. Capital Structure & Debt
Mondelez International, Inc.
- Maintains moderate debt levels (D/E 0.87) with favorable interest coverage (11.69x). Current ratio at 0.59 signals liquidity concerns.
The Hershey Company
- Exhibits higher leverage (D/E 1.17) and lower interest coverage (6.99x). Current ratio is healthier at 1.19, but quick ratio remains below 1.
3. Stock Volatility
Mondelez International, Inc.
- Beta of 0.40 suggests low market volatility, offering more stability.
The Hershey Company
- Even lower beta of 0.17 indicates very low stock volatility, appealing for risk-averse investors.
4. Regulatory & Legal
Mondelez International, Inc.
- Global footprint exposes it to varied regulatory regimes and compliance costs.
The Hershey Company
- Primarily U.S.-focused, facing fewer international regulatory complexities but strict domestic food safety laws.
5. Supply Chain & Operations
Mondelez International, Inc.
- Complex global supply chain increases operational risk amid geopolitical tensions.
The Hershey Company
- More concentrated supply network reduces complexity but less flexibility in disruptions.
6. ESG & Climate Transition
Mondelez International, Inc.
- Faces significant pressure to improve sustainability across multiple markets and supply chains.
The Hershey Company
- Stronger focus on U.S. sustainability initiatives but still exposed to climate risks in raw material sourcing.
7. Geopolitical Exposure
Mondelez International, Inc.
- High geopolitical exposure due to diversified international operations, increasing risk from trade tensions.
The Hershey Company
- Limited geopolitical risk due to primarily domestic operations but vulnerable to U.S. policy changes.
Which company shows a better risk-adjusted profile?
Mondelez’s biggest risk is liquidity weakness amid moderate leverage and global geopolitical exposure. Hershey’s key risk is higher debt and valuation multiples despite strong profitability and liquidity. Hershey’s safer Altman Z-Score and stable beta indicate a slightly better risk-adjusted profile. Hershey’s recent Altman Z-Score of 4.25, in the safe zone, contrasts with Mondelez’s 2.26 in the grey zone, justifying cautious optimism for Hershey.
Final Verdict: Which stock to choose?
Mondelez International’s superpower lies in its vast global reach and efficient asset utilization, driving consistent revenue growth. However, its declining profitability and weak liquidity ratios signal a point of vigilance. It fits best within aggressive growth portfolios willing to tolerate operational and margin pressures for scale.
The Hershey Company’s strategic moat is its strong brand loyalty and superior return on equity, reflecting disciplined capital allocation. It offers better financial stability and less leverage risk compared to Mondelez. Hershey suits GARP investors seeking steady growth with a margin of safety in a competitive sector.
If you prioritize aggressive expansion and global scale, Mondelez International stands out despite margin headwinds. However, if you seek more stable returns with superior capital efficiency, Hershey offers better stability and a defensible market position, albeit at a premium valuation. Both choices demand careful risk assessment given recent earnings headwinds.
Disclaimer: Investment carries a risk of loss of initial capital. The past performance is not a reliable indicator of future results. Be sure to understand risks before making an investment decision.
Go Further
I encourage you to read the complete analyses of Mondelez International, Inc. and The Hershey Company to enhance your investment decisions: