In today’s fast-evolving tech landscape, monday.com Ltd. and Asana, Inc. stand out as prominent players in the software application industry, both specializing in work management platforms. These companies compete directly by offering innovative solutions that enhance productivity across diverse sectors worldwide. Comparing their market presence, innovation strategies, and growth potential helps investors identify which stock may best complement their portfolio. Let’s explore which company presents the most compelling investment opportunity.

Table of contents
Companies Overview
I will begin the comparison between monday.com Ltd. and Asana, Inc. by providing an overview of these two companies and their main differences.
monday.com Ltd. Overview
monday.com Ltd. develops cloud-based software applications, primarily offering Work OS, a visual work operating system designed to create customizable work management tools. Headquartered in Tel Aviv, Israel, the company serves various sectors including marketing, CRM, and project management, targeting organizations, educational institutions, and government entities. Founded in 2012, monday.com operates internationally with a workforce of 2,508 employees.
Asana, Inc. Overview
Asana, Inc. operates a work management platform that supports individuals and teams in orchestrating tasks and strategic initiatives, such as product launches and marketing campaigns. Based in San Francisco, California, Asana serves a broad customer base across industries like technology, retail, healthcare, and finance. Established in 2008, the company employs 1,819 people and focuses on enhancing team productivity worldwide.
Key similarities and differences
Both monday.com and Asana operate in the software application industry, offering cloud-based platforms to improve work management and collaboration. They target diverse sectors and international markets, emphasizing project and task coordination. However, monday.com’s platform is modular and highly customizable, while Asana emphasizes structured orchestration of daily tasks and strategic goals. Their geographic headquarters and employee scale also differ, with monday.com being larger and based in Israel.
Income Statement Comparison
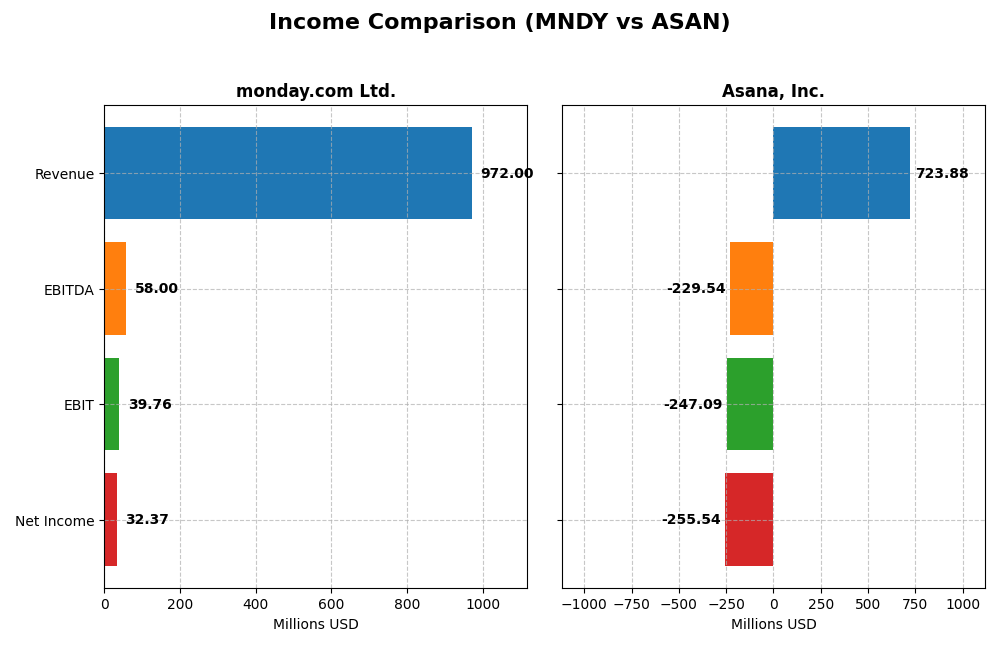
The table below presents a side-by-side comparison of the most recent fiscal year income statement metrics for monday.com Ltd. and Asana, Inc., highlighting key financial performance indicators.
| Metric | monday.com Ltd. (MNDY) | Asana, Inc. (ASAN) |
|---|---|---|
| Market Cap | 7.34B | 3.07B |
| Revenue | 972M | 724M |
| EBITDA | 58M | -230M |
| EBIT | 40M | -247M |
| Net Income | 32M | -256M |
| EPS | 0.65 | -1.11 |
| Fiscal Year | 2024 | 2025 |
Income Statement Interpretations
monday.com Ltd.
monday.com Ltd. exhibited strong revenue growth from 2020 to 2024, increasing from 161M to 972M USD, with net income improving from a loss of 152M to a positive 32M USD. Gross margins remained robust at 89.33%, while EBIT and net margins showed neutral to favorable trends. The 2024 fiscal year marked a notable recovery with a 33% revenue increase and a return to profitability.
Asana, Inc.
Asana, Inc. reported steady revenue growth over 2021-2025, rising from 227M to 724M USD, yet net income remained negative, though losses narrowed from -212M to -256M USD in 2025. Gross margin stayed favorable at 89.34%, but EBIT and net margins were significantly negative. The latest year saw moderate revenue growth of 11% and slight improvements in net margin and EPS.
Which one has the stronger fundamentals?
monday.com shows stronger fundamentals with consistent revenue growth, positive net income in 2024, and largely favorable margin trends. Asana demonstrates solid revenue increases but continues to report net losses and unfavorable EBIT and net margins. Both companies maintain high gross margins, yet monday.com’s recent profitability and margin improvements suggest a more favorable income statement profile.
Financial Ratios Comparison
The following table presents a side-by-side comparison of key financial ratios for monday.com Ltd. and Asana, Inc. based on their most recent fiscal year 2024 (monday.com) and fiscal year 2025 (Asana).
| Ratios | monday.com Ltd. (MNDY) | Asana, Inc. (ASAN) |
|---|---|---|
| ROE | 3.14% | -112.31% |
| ROIC | -1.73% | -54.04% |
| P/E | 363 | -19.16 |
| P/B | 11.41 | 21.52 |
| Current Ratio | 2.66 | 1.44 |
| Quick Ratio | 2.66 | 1.44 |
| D/E (Debt-to-Equity) | 0.10 | 1.18 |
| Debt-to-Assets | 6.29% | 30.11% |
| Interest Coverage | 0 | -72.42 |
| Asset Turnover | 0.58 | 0.81 |
| Fixed Asset Turnover | 7.13 | 2.76 |
| Payout ratio | 0 | 0 |
| Dividend yield | 0 | 0 |
All metrics use reported fiscal year data: 2024 for monday.com Ltd. and 2025 for Asana, Inc.
Interpretation of the Ratios
monday.com Ltd.
monday.com Ltd. shows a mixed ratio profile, with strong liquidity indicated by a current ratio of 2.66 and low debt levels, but weak profitability metrics including a net margin of 3.33% and a negative return on invested capital of -1.73%. Its high P/E of 363 and P/B of 11.41 suggest overvaluation concerns. The company does not pay dividends, likely prioritizing reinvestment and growth.
Asana, Inc.
Asana, Inc. displays several unfavorable profitability ratios, such as a net margin of -35.3% and ROE of -112.31%, alongside elevated debt-to-equity at 1.18 and negative interest coverage, signaling financial stress. However, it benefits from a favorable WACC of 7.76% and a neutral current ratio of 1.44. Asana also pays no dividends, consistent with reinvestment during its growth phase.
Which one has the best ratios?
Comparing both, monday.com Ltd. presents a more balanced financial profile with stronger liquidity and lower leverage, despite weak profitability. Asana’s ratios are more challenged by significant losses and higher debt, leading to a slightly unfavorable overall assessment. Thus, monday.com holds a relatively stronger ratio position based on this data.
Strategic Positioning
This section compares the strategic positioning of monday.com Ltd. and Asana, Inc., focusing on market position, key segments, and exposure to technological disruption:
monday.com Ltd.
- Positioned in software application industry with a $7.3B market cap, facing competitive pressure globally.
- Offers a Work OS platform with modular building blocks for marketing, CRM, project management, and more.
- Focuses on cloud-based visual work operating system, potentially exposed to evolving software tech shifts.
Asana, Inc.
- Operates in software applications with a $3.1B market cap, competing internationally.
- Provides a work management platform for teams across industries like tech, retail, and healthcare.
- Platform enables orchestration of work tasks and strategic initiatives, exposed to software innovation risks.
monday.com Ltd. vs Asana, Inc. Positioning
monday.com Ltd. adopts a more diversified approach with multiple product solutions spanning marketing, CRM, and project management, while Asana, Inc. concentrates on team work orchestration across various industries. monday.com’s broader targeting contrasts with Asana’s focused platform scope.
Which has the best competitive advantage?
Both companies are currently shedding value relative to their cost of capital. monday.com Ltd. shows improving profitability trends, while Asana, Inc. faces declining returns, suggesting monday.com holds a comparatively more favorable economic moat position.
Stock Comparison
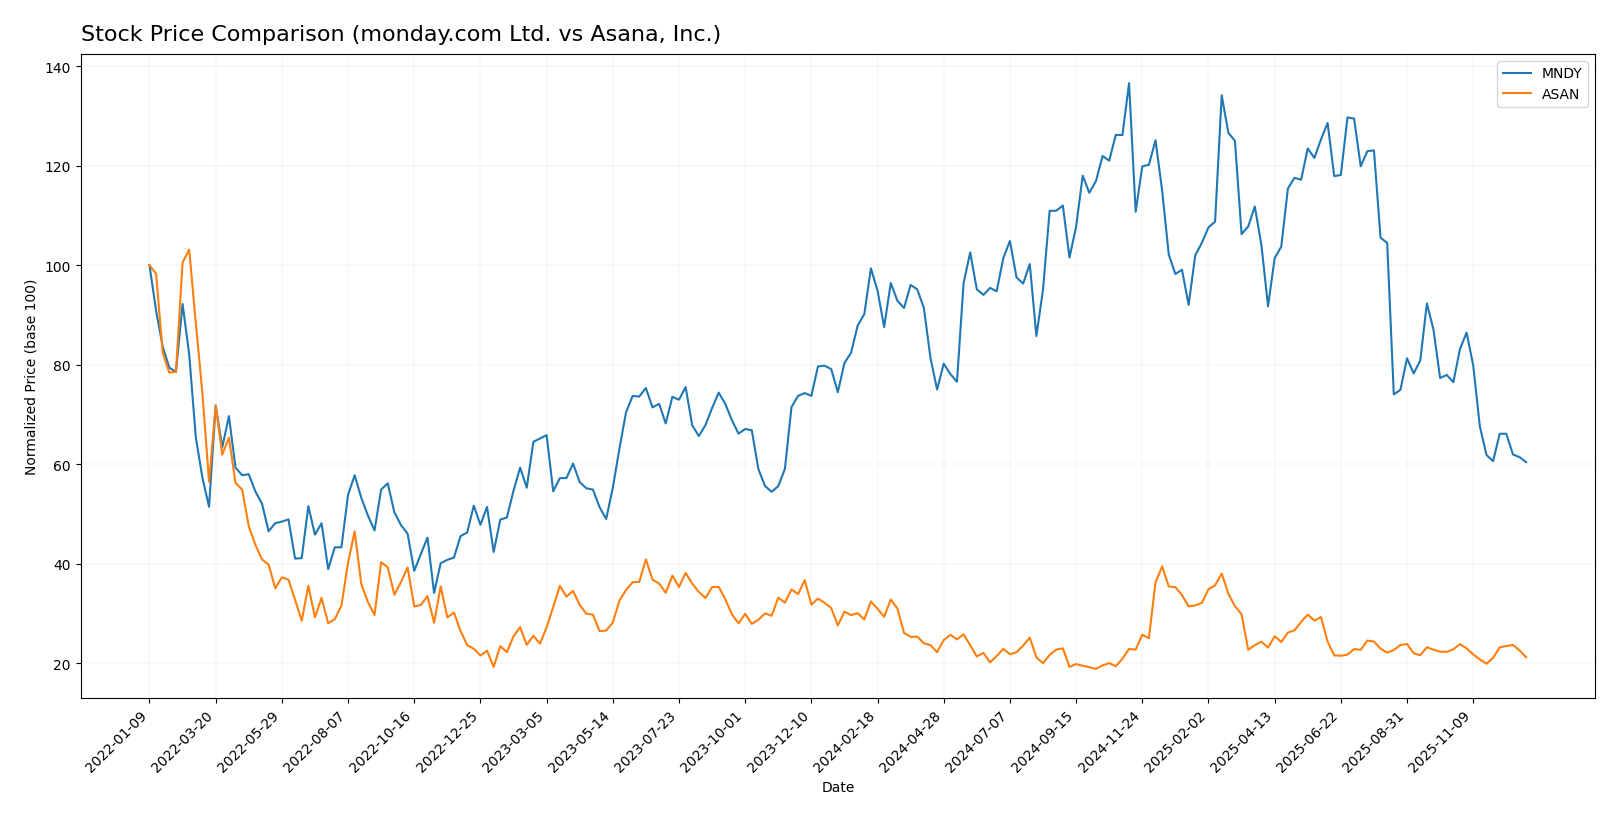
The stock price movements of monday.com Ltd. (MNDY) and Asana, Inc. (ASAN) over the past 12 months reveal significant bearish trends, with both companies experiencing notable declines and distinct trading volume dynamics.
Trend Analysis
monday.com Ltd. (MNDY) showed a 39.21% price decline over the past year, indicating a bearish trend with deceleration. The stock exhibited high volatility with a 45.17 std deviation and a price range between 324.31 and 143.42.
Asana, Inc. (ASAN) recorded a 34.64% price decrease, also bearish with deceleration. It showed much lower volatility at 2.89 std deviation and price fluctuations between 24.15 and 11.53 over the same period.
Comparing both stocks, monday.com Ltd. experienced a larger negative price change and higher volatility while Asana had a less severe decline but still a bearish trend, making Asana the better performer in relative market terms.
Target Prices
The current analyst consensus for monday.com Ltd. and Asana, Inc. reflects moderate upside potential from their current market prices.
| Company | Target High | Target Low | Consensus |
|---|---|---|---|
| monday.com Ltd. | 330 | 202 | 277.18 |
| Asana, Inc. | 18 | 14 | 15.75 |
Analysts expect monday.com Ltd. to trade significantly above its current price of 143.42 USD, indicating strong growth potential. Asana’s consensus target of 15.75 USD also suggests upside from its present price of 12.96 USD, though with more modest gains.
Analyst Opinions Comparison
This section compares analysts’ ratings and grades for monday.com Ltd. and Asana, Inc.:
Rating Comparison
monday.com Ltd. Rating
- Rating: B- indicating a very favorable overall evaluation.
- Discounted Cash Flow Score: 4, a favorable indicator of value.
- ROE Score: 2, moderate efficiency in generating equity profit.
- ROA Score: 3, moderate asset utilization efficiency.
- Debt To Equity Score: 3, moderate financial risk level.
- Overall Score: 2, moderate overall financial standing.
Asana, Inc. Rating
- Rating: D+ indicating a very unfavorable overall evaluation.
- Discounted Cash Flow Score: 1, a very unfavorable indicator.
- ROE Score: 1, very unfavorable efficiency in equity profit.
- ROA Score: 1, very unfavorable asset utilization.
- Debt To Equity Score: 1, very unfavorable financial risk.
- Overall Score: 1, very unfavorable overall financial standing.
Which one is the best rated?
Based strictly on the provided data, monday.com Ltd. holds a better rating overall with a B- compared to Asana’s D+. All key financial scores for monday.com exceed those of Asana, reflecting a stronger financial profile.
Scores Comparison
Here is a comparison of the Altman Z-Score and Piotroski Score for monday.com Ltd. and Asana, Inc.:
monday.com Ltd. Scores
- Altman Z-Score: 7.39, indicating a safe financial zone with low bankruptcy risk.
- Piotroski Score: 5, reflecting average financial strength and investment potential.
Asana, Inc. Scores
- Altman Z-Score: -0.20, placing the company in the distress zone, indicating high bankruptcy risk.
- Piotroski Score: 4, also indicating average financial strength and investment potential.
Which company has the best scores?
Based on the provided data, monday.com Ltd. has a significantly higher Altman Z-Score, indicating stronger financial stability, while both companies have similar average Piotroski Scores. Thus, monday.com shows better scores overall.
Grades Comparison
Here is a comparison of the recent grades from reputable financial institutions for monday.com Ltd. and Asana, Inc.:
monday.com Ltd. Grades
This table summarizes recent grades assigned to monday.com Ltd. by major financial firms.
| Grading Company | Action | New Grade | Date |
|---|---|---|---|
| Citigroup | Maintain | Buy | 2025-12-23 |
| Tigress Financial | Maintain | Buy | 2025-12-11 |
| Morgan Stanley | Maintain | Overweight | 2025-11-11 |
| Piper Sandler | Maintain | Overweight | 2025-11-11 |
| B of A Securities | Maintain | Neutral | 2025-11-11 |
| JP Morgan | Maintain | Overweight | 2025-11-11 |
| Canaccord Genuity | Maintain | Buy | 2025-11-11 |
| Jefferies | Maintain | Buy | 2025-11-11 |
| Wells Fargo | Maintain | Overweight | 2025-11-11 |
| Baird | Maintain | Outperform | 2025-11-11 |
Overall, monday.com Ltd. maintains a favorable outlook with mostly Buy and Overweight grades, showing consistent confidence from analysts.
Asana, Inc. Grades
This table presents recent grades given to Asana, Inc. by established grading companies.
| Grading Company | Action | New Grade | Date |
|---|---|---|---|
| Keybanc | Upgrade | Overweight | 2025-12-15 |
| DA Davidson | Maintain | Neutral | 2025-12-04 |
| RBC Capital | Maintain | Underperform | 2025-12-03 |
| UBS | Maintain | Neutral | 2025-12-03 |
| Citigroup | Maintain | Neutral | 2025-12-03 |
| Piper Sandler | Maintain | Overweight | 2025-09-04 |
| Baird | Maintain | Neutral | 2025-09-04 |
| Morgan Stanley | Maintain | Underweight | 2025-09-04 |
| B of A Securities | Maintain | Buy | 2025-06-04 |
| JP Morgan | Maintain | Underweight | 2025-06-04 |
Asana, Inc. displays a mixed rating profile with a combination of Neutral, Underperform, and Overweight grades, reflecting varied analyst sentiment.
Which company has the best grades?
monday.com Ltd. has received consistently stronger grades, predominantly Buy and Overweight, compared to Asana, Inc., which shows a more mixed and cautious stance. This suggests monday.com Ltd. may be viewed by analysts as having a more stable or promising outlook, which could influence investor confidence accordingly.
Strengths and Weaknesses
Below is a comparison table highlighting key strengths and weaknesses of monday.com Ltd. (MNDY) and Asana, Inc. (ASAN) based on recent financial and operational data.
| Criterion | monday.com Ltd. (MNDY) | Asana, Inc. (ASAN) |
|---|---|---|
| Diversification | Moderate; product focus on work management | Moderate; similar focus but less diversified |
| Profitability | Slightly unfavorable; net margin 3.33%, ROIC -1.73% | Unfavorable; net margin -35.3%, ROIC -54.04% |
| Innovation | Growing ROIC trend indicates improving efficiency | Declining ROIC trend shows decreasing efficiency |
| Global presence | Established with stable current ratio 2.66 | Moderate global presence; current ratio 1.44 |
| Market Share | Competitive within SaaS project management | Smaller share, struggling with profitability |
Key takeaways: monday.com shows signs of improving profitability and strong liquidity, though it is still slightly value destructive. Asana is experiencing significant profitability challenges and declining returns on capital, presenting higher investment risk. Caution and thorough risk assessment are advised when considering these stocks.
Risk Analysis
Below is a comparison of key risks for monday.com Ltd. (MNDY) and Asana, Inc. (ASAN) based on the most recent data available (2024-2025):
| Metric | monday.com Ltd. (MNDY) | Asana, Inc. (ASAN) |
|---|---|---|
| Market Risk | Moderate (Beta 1.26) | Moderate (Beta 0.93) |
| Debt level | Low (Debt/Equity 0.1) | High (Debt/Equity 1.18) |
| Regulatory Risk | Moderate (Global operations) | Moderate (US & global market) |
| Operational Risk | Moderate (Scale & competition) | Moderate (Competition & losses) |
| Environmental Risk | Low (Tech sector, no major issues) | Low (Tech sector, no major issues) |
| Geopolitical Risk | Elevated (Israel HQ, global exposure) | Moderate (US-based, international exposure) |
The most impactful risks are Asana’s high debt burden and negative profitability, raising bankruptcy risk (Altman Z-Score in distress zone). monday.com shows stronger financial stability (safe zone Altman Z-Score) but faces geopolitical risks due to its Israeli base. Market volatility affects both moderately.
Which Stock to Choose?
Monday.com Ltd. (MNDY) has shown strong income growth with a 33.21% revenue increase in the last year and a favorable overall income statement rating. Its financial ratios are mixed, with 42.86% favorable and 42.86% unfavorable metrics, but it maintains low debt and a very favorable B- rating.
Asana, Inc. (ASAN) exhibits moderate income growth of 10.94% year-over-year but suffers from unfavorable profitability ratios, including a negative net margin of -35.3%. Its financial ratios are 50% unfavorable, with higher debt levels and a very favorable D+ rating overall.
Investors seeking growth could find Monday.com’s improving profitability and balanced financial ratios appealing, while those with a higher risk tolerance might consider Asana’s potential despite its unfavorable financial metrics and declining profitability trend.
Disclaimer: Investment carries a risk of loss of initial capital. The past performance is not a reliable indicator of future results. Be sure to understand risks before making an investment decision.
Go Further
I encourage you to read the complete analyses of monday.com Ltd. and Asana, Inc. to enhance your investment decisions: