In the dynamic biotechnology sector, Vertex Pharmaceuticals Incorporated (VRTX) and Moderna, Inc. (MRNA) stand out as key innovators shaping the future of healthcare. Vertex focuses on developing transformative therapies for genetic diseases like cystic fibrosis, while Moderna leads in mRNA technology with vaccines and therapeutics. Both companies overlap in cutting-edge biotech innovation, making their comparison vital for investors. This article will help you identify which company offers the most compelling investment opportunity today.

Table of contents
Companies Overview
I will begin the comparison between Vertex Pharmaceuticals and Moderna by providing an overview of these two companies and their main differences.
Vertex Pharmaceuticals Overview
Vertex Pharmaceuticals Incorporated is a biotechnology firm focused on developing and commercializing therapies for cystic fibrosis. The company markets several treatments, including SYMDEKO, ORKAMBI, KALYDECO, and TRIKAFTA, targeting specific genetic mutations. Its pipeline also includes clinical trials for diseases like AAT deficiency, kidney diseases, diabetes, and pain management. Vertex operates primarily in the US and internationally, collaborating with various biotech and pharmaceutical partners.
Moderna Overview
Moderna, Inc. is a biotechnology company specializing in messenger RNA therapeutics and vaccines for infectious diseases, immuno-oncology, rare diseases, and autoimmune conditions. Its vaccine portfolio includes COVID-19, flu, RSV, and others, alongside cancer and regenerative medicine products. Moderna has strategic alliances with major pharmaceutical companies and research organizations. Founded in 2010, it is headquartered in Cambridge, Massachusetts, and operates globally.
Key similarities and differences
Both Vertex and Moderna operate in the biotechnology sector and focus on innovative therapies across diverse disease areas. Vertex concentrates on genetic and rare diseases, especially cystic fibrosis, while Moderna emphasizes mRNA technology for vaccines and therapeutics. Each company maintains strategic partnerships, but their product pipelines and technology platforms differ significantly, reflecting distinct approaches within healthcare innovation.
Income Statement Comparison
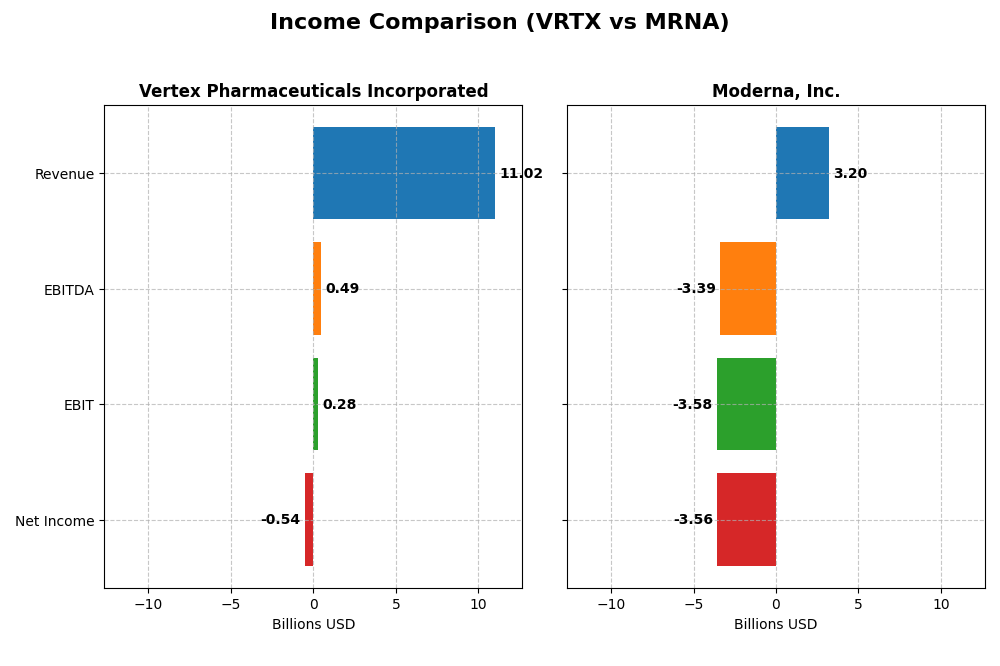
This table compares the key income statement metrics for Vertex Pharmaceuticals Incorporated and Moderna, Inc. for the fiscal year 2024, illustrating their financial performance in revenue, profitability, and earnings per share.
| Metric | Vertex Pharmaceuticals Incorporated | Moderna, Inc. |
|---|---|---|
| Market Cap | 119B | 13.4B |
| Revenue | 11.0B | 3.2B |
| EBITDA | 486M | -3.39B |
| EBIT | 279M | -3.58B |
| Net Income | -536M | -3.56B |
| EPS | -2.08 | -9.27 |
| Fiscal Year | 2024 | 2024 |
Income Statement Interpretations
Vertex Pharmaceuticals Incorporated
Vertex’s revenue showed consistent growth from 2020 to 2024, reaching $11.02B in 2024, up 11.66% from 2023. However, net income turned negative in 2024 at -$536M, a sharp decline from prior years. Gross margins remained robust at 86.11%, but net margin deteriorated significantly, reflecting a challenging year with operating losses despite stable revenue growth.
Moderna, Inc.
Moderna’s revenue peaked in 2022 at $18.88B but declined sharply by 53.29% to $3.2B in 2024. Net income also swung negative, recording a loss of $3.56B in 2024, deepening from previous years. While gross margin stayed favorable at 54.24%, negative EBIT and net margins indicate sustained operational difficulties and worsening profitability in the latest fiscal year.
Which one has the stronger fundamentals?
Both companies display unfavorable overall income statement evaluations with significant net margin declines and net income losses in 2024. Vertex maintains stronger gross margins and positive revenue growth, though it faced a drastic net income drop. Moderna shows more volatile revenue with a steep decline and deeper losses, despite some EPS improvement. Neither company currently demonstrates consistently strong profitability fundamentals.
Financial Ratios Comparison
The table below presents the most recent financial ratios for Vertex Pharmaceuticals Incorporated and Moderna, Inc. as of fiscal year 2024, providing a snapshot of their operational efficiency, profitability, liquidity, and leverage.
| Ratios | Vertex Pharmaceuticals Incorporated (VRTX) | Moderna, Inc. (MRNA) |
|---|---|---|
| ROE | -3.26% | -32.67% |
| ROIC | 2.63% | -32.53% |
| P/E | -194 | -4.48 |
| P/B | 6.32 | 1.46 |
| Current Ratio | 2.69 | 3.67 |
| Quick Ratio | 2.35 | 3.62 |
| D/E (Debt-to-Equity) | 0.11 | 0.07 |
| Debt-to-Assets | 7.76% | 5.28% |
| Interest Coverage | -7.61 | -164.38 |
| Asset Turnover | 0.49 | 0.23 |
| Fixed Asset Turnover | 4.26 | 1.08 |
| Payout ratio | 0% | 0% |
| Dividend yield | 0% | 0% |
Interpretation of the Ratios
Vertex Pharmaceuticals Incorporated
Vertex shows a balanced ratio profile with 57% favorable indicators, including a strong current ratio of 2.69 and low debt levels at 7.76%. However, profitability ratios like net margin (-4.86%) and return on equity (-3.26%) are unfavorable, reflecting some operational challenges. Vertex does not pay dividends, likely prioritizing reinvestment and pipeline development.
Moderna, Inc.
Moderna’s ratios reveal weaker financial health, with 50% unfavorable metrics including a deeply negative net margin (-111.32%) and return on equity (-32.67%). While debt remains low at 5.28%, interest coverage is negative, signaling financial stress. Moderna also pays no dividends, consistent with its high R&D spend and growth focus.
Which one has the best ratios?
Vertex holds a more favorable ratio profile overall, with stronger liquidity and lower financial risk. Moderna’s significant negative profitability and interest coverage ratios weigh heavily against it. Thus, Vertex demonstrates better financial stability and operational efficiency based on the 2024 fiscal year data.
Strategic Positioning
This section compares the strategic positioning of Vertex Pharmaceuticals (VRTX) and Moderna (MRNA) including market position, key segments, and exposure to technological disruption:
Vertex Pharmaceuticals (VRTX)
- Leading cystic fibrosis therapy company with stable market share; faces biotech competitive pressures.
- Revenue mainly from cystic fibrosis drugs like TRIKAFTA; pipeline includes rare and serious diseases.
- Collaborates with gene editing and biotech firms; moderate exposure to evolving biotech technologies.
Moderna (MRNA)
- Focused on mRNA therapeutics and vaccines; competing in infectious diseases and immuno-oncology markets.
- Revenue driven by mRNA medicines for infectious and rare diseases; broad vaccine and therapeutic pipeline.
- Strongly invested in mRNA technology; innovation core to business, facing rapid technological evolution.
Vertex Pharmaceuticals vs Moderna Positioning
VRTX has a concentrated focus on cystic fibrosis and related therapies, with a diversified pipeline in serious diseases. MRNA pursues a broader mRNA-based platform across vaccines and therapeutics, emphasizing innovation but facing higher competitive volatility.
Which has the best competitive advantage?
Both companies show declining ROIC below WACC, indicating value destruction and very unfavorable moats. Neither currently demonstrates a sustainable competitive advantage based on return on invested capital trends.
Stock Comparison
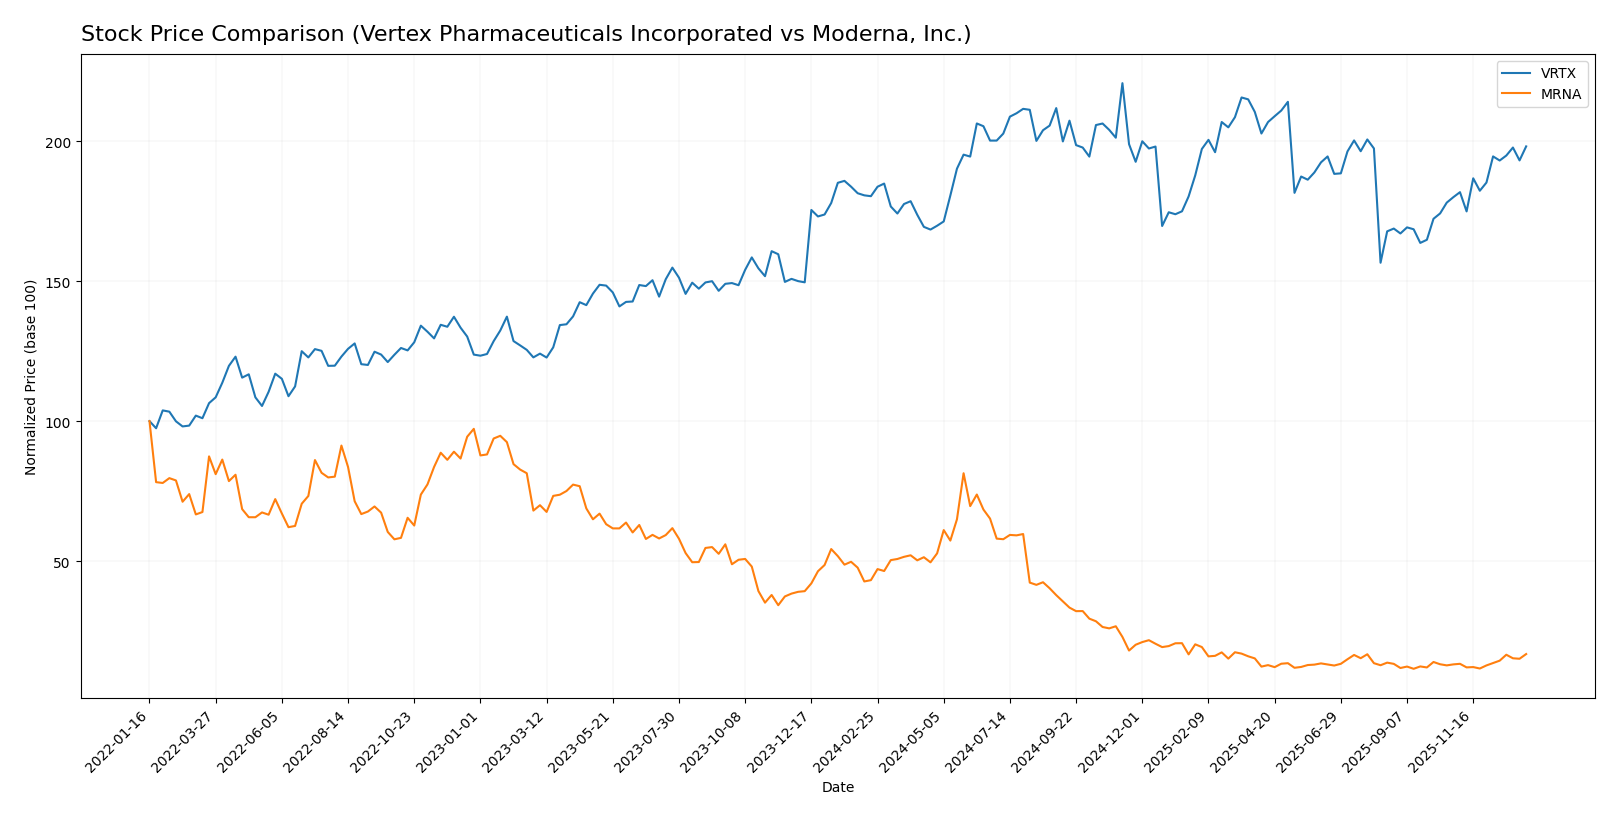
The stock price movements over the past year reveal a clear divergence between Vertex Pharmaceuticals Incorporated, which exhibited a steady bullish trend with price acceleration, and Moderna, Inc., which experienced a pronounced bearish downturn followed by recent recovery signs.
Trend Analysis
Vertex Pharmaceuticals Incorporated’s stock showed a 9.87% price increase over the past year, indicating a bullish trend with accelerating momentum and a high volatility level (std deviation 34.25). The stock reached a high of 516.74 and a low of 366.54 during this period.
Moderna, Inc.’s stock experienced a significant 61.19% decline over the same timeframe, reflecting a bearish trend with acceleration despite high volatility (std deviation 38.16). The stock’s recent recovery showed a 28.27% price increase but remains in a broader downward context.
Comparing both stocks, Vertex Pharmaceuticals delivered the highest market performance over the past year with a sustained bullish trend, whereas Moderna’s stock faced substantial losses despite a recent upward correction.
Target Prices
Analysts provide a clear target price consensus for both Vertex Pharmaceuticals Incorporated and Moderna, Inc.
| Company | Target High | Target Low | Consensus |
|---|---|---|---|
| Vertex Pharmaceuticals Incorporated | 564 | 414 | 488.1 |
| Moderna, Inc. | 63 | 15 | 30.73 |
The target consensus for Vertex Pharmaceuticals is about 5% above its current price of 463.86 USD, indicating moderate upside potential. Moderna’s consensus target is below its current price of 34.3 USD, suggesting cautious outlook or possible downside risk.
Analyst Opinions Comparison
This section compares analysts’ ratings and grades for Vertex Pharmaceuticals Incorporated (VRTX) and Moderna, Inc. (MRNA):
Rating Comparison
VRTX Rating
- Rating: A, indicating a very favorable overall evaluation.
- Discounted Cash Flow Score: 5, very favorable valuation.
- ROE Score: 5, very favorable, showing strong profitability.
- ROA Score: 5, very favorable, demonstrating efficient asset use.
- Debt To Equity Score: 3, moderate financial risk.
- Overall Score: 4, favorable financial standing.
MRNA Rating
- Rating: C+, reflecting a moderate overall evaluation.
- Discounted Cash Flow Score: 3, moderate valuation.
- ROE Score: 1, very unfavorable, indicating weak profitability.
- ROA Score: 1, very unfavorable, suggesting poor asset use.
- Debt To Equity Score: 3, moderate financial risk.
- Overall Score: 2, moderate financial standing.
Which one is the best rated?
Based on the provided data, VRTX is better rated overall, with higher scores in discounted cash flow, ROE, ROA, and overall financial standing. MRNA has a lower rating and weaker profitability metrics.
Scores Comparison
The comparison of Vertex Pharmaceuticals and Moderna scores is as follows:
VRTX Scores
- Altman Z-Score: 11.3, indicating a safe zone with low bankruptcy risk.
- Piotroski Score: 7, classified as strong financial health.
MRNA Scores
- Altman Z-Score: 3.28, in the safe zone but much closer to the grey area.
- Piotroski Score: 1, denoting very weak financial health.
Which company has the best scores?
Vertex Pharmaceuticals shows stronger financial stability with a significantly higher Altman Z-Score and a strong Piotroski Score. Moderna, while safe by Altman Z standards, presents a very weak Piotroski Score, indicating weaker financial health.
Grades Comparison
Here is a detailed comparison of the grades assigned to Vertex Pharmaceuticals Incorporated and Moderna, Inc.:
Vertex Pharmaceuticals Incorporated Grades
The following table summarizes recent reliable grades from notable financial institutions for Vertex Pharmaceuticals Incorporated.
| Grading Company | Action | New Grade | Date |
|---|---|---|---|
| Wolfe Research | Upgrade | Outperform | 2026-01-06 |
| Leerink Partners | Maintain | Outperform | 2025-12-29 |
| Wells Fargo | Maintain | Overweight | 2025-12-10 |
| Morgan Stanley | Maintain | Overweight | 2025-12-05 |
| Morgan Stanley | Upgrade | Overweight | 2025-12-03 |
| UBS | Maintain | Buy | 2025-11-07 |
| Stifel | Maintain | Hold | 2025-11-04 |
| RBC Capital | Maintain | Sector Perform | 2025-11-04 |
| Barclays | Maintain | Equal Weight | 2025-11-04 |
| Morgan Stanley | Maintain | Equal Weight | 2025-10-10 |
Vertex Pharmaceuticals shows a predominantly positive trend, with multiple upgrades and maintained overweight and outperform ratings from major analysts.
Moderna, Inc. Grades
The following table summarizes recent reliable grades from notable financial institutions for Moderna, Inc.
| Grading Company | Action | New Grade | Date |
|---|---|---|---|
| Morgan Stanley | Maintain | Equal Weight | 2025-12-12 |
| Piper Sandler | Maintain | Overweight | 2025-11-21 |
| RBC Capital | Maintain | Sector Perform | 2025-11-21 |
| Leerink Partners | Maintain | Underperform | 2025-11-21 |
| B of A Securities | Maintain | Underperform | 2025-11-10 |
| Barclays | Maintain | Equal Weight | 2025-11-07 |
| Citigroup | Maintain | Neutral | 2025-10-23 |
| JP Morgan | Maintain | Underweight | 2025-10-23 |
| UBS | Maintain | Buy | 2025-10-23 |
| Needham | Maintain | Hold | 2025-10-20 |
Moderna’s grades display a mixed pattern, with several underperform and equal weight ratings, alongside fewer buy or overweight recommendations.
Which company has the best grades?
Vertex Pharmaceuticals holds the stronger consensus with a majority of buy and outperform ratings, indicating generally favorable analyst sentiment. Moderna presents a more cautious outlook, with a consensus leaning toward hold and several underperform recommendations, which may imply higher perceived risk or uncertainty for investors.
Strengths and Weaknesses
Below is a comparison of Vertex Pharmaceuticals Incorporated (VRTX) and Moderna, Inc. (MRNA) based on key investment criteria:
| Criterion | Vertex Pharmaceuticals (VRTX) | Moderna, Inc. (MRNA) |
|---|---|---|
| Diversification | Focused mainly on cystic fibrosis drugs; limited product diversification with TRIKAFTA/KAFTRIO generating $10.2B in 2024 | Primarily mRNA medicines; limited product range with $4.5B product sales in 2024 |
| Profitability | Negative net margin (-4.86%), ROIC 2.63% but below WACC (5.19%); value shedding | Large negative net margin (-111.32%), ROIC -32.53%, value destroying |
| Innovation | Strong R&D in rare diseases, but declining ROIC trend suggests challenges | Leading in mRNA technology but facing profitability and declining ROIC issues |
| Global presence | Established global footprint in specialty markets | Global reach but heavily dependent on mRNA vaccine sales |
| Market Share | Leading in cystic fibrosis treatments globally | Significant share in mRNA vaccines and therapeutics, but market volatility |
Key takeaways: Both companies face profitability challenges with declining ROIC and value destruction signals. Vertex’s strength lies in its dominant cystic fibrosis franchise, while Moderna leads in mRNA innovation but struggles with financial performance. Caution and risk management are advised when considering investments in either stock.
Risk Analysis
The table below presents a comparative risk overview for Vertex Pharmaceuticals Incorporated (VRTX) and Moderna, Inc. (MRNA) based on the most recent data from 2024.
| Metric | Vertex Pharmaceuticals (VRTX) | Moderna, Inc. (MRNA) |
|---|---|---|
| Market Risk | Low beta (0.31) indicates low volatility relative to market | Higher beta (1.17) implies higher volatility and market sensitivity |
| Debt level | Low debt-to-equity ratio (0.11) and low debt-to-assets (7.76%) | Low debt-to-equity ratio (0.07) and debt-to-assets (5.28%) |
| Regulatory Risk | Moderate, given pipeline and collaborations in biotech sector | Moderate, due to mRNA technology regulatory scrutiny and vaccine approvals |
| Operational Risk | Favorable liquidity ratios (current 2.69, quick 2.35) and strong interest coverage (9.12) | Mixed liquidity (current 3.67 unfavorable, quick 3.62 favorable), negative interest coverage (-149.29) |
| Environmental Risk | Standard biotech compliance, no major concerns reported | Standard biotech compliance, no major concerns reported |
| Geopolitical Risk | Moderate, global collaborations but mainly US-based operations | Moderate, significant international vaccine distribution exposure |
Vertex Pharmaceuticals shows lower market risk and solid financial health with favorable debt and liquidity profiles, supporting operational stability. Moderna’s higher market volatility and negative interest coverage signal greater financial stress and operational risk. The most impactful risk for Moderna is its poor profitability and financial returns, which investors should monitor closely. Vertex’s main risks stem from regulatory approvals and pipeline success, typical for biotech firms but currently mitigated by strong cash position and low leverage.
Which Stock to Choose?
Vertex Pharmaceuticals (VRTX) shows an unfavorable income trend with negative net margin and declining profitability despite favorable revenue growth. Its financial ratios are mostly favorable, highlighting strong liquidity and low debt, supported by a very favorable A rating and strong Altman Z-Score, but with a very unfavorable MOAT due to value destruction.
Moderna (MRNA) presents a sharply unfavorable income evolution characterized by negative margins and declining profitability, with mostly unfavorable financial ratios and a moderate rating of C+ despite safe-zone Altman Z-Score. Its MOAT is also very unfavorable, indicating persistent value loss amid a bearish long-term stock trend.
Investors prioritizing financial stability, strong liquidity, and overall rating might find Vertex’s profile more favorable, while those accepting higher operational risk and volatility could consider Moderna’s potential for recovery despite its current unfavorable metrics and weaker profitability signals.
Disclaimer: Investment carries a risk of loss of initial capital. The past performance is not a reliable indicator of future results. Be sure to understand risks before making an investment decision.
Go Further
I encourage you to read the complete analyses of Vertex Pharmaceuticals Incorporated and Moderna, Inc. to enhance your investment decisions: