Home > Comparison > Consumer Cyclical > ORLY vs MBLY
The strategic rivalry between O’Reilly Automotive and Mobileye Global defines key dynamics in the automotive parts sector. O’Reilly operates a vast retail network for aftermarket parts, emphasizing scale and service. Mobileye, by contrast, pioneers advanced driver-assistance and autonomous driving technologies, focusing on innovation and software. This analysis evaluates which model—traditional distribution or cutting-edge technology—offers superior risk-adjusted returns for a diversified portfolio in an evolving industry landscape.

Table of contents
Companies Overview
O’Reilly Automotive and Mobileye Global stand as pivotal players reshaping the automotive aftermarket and autonomous driving arenas.
O’Reilly Automotive, Inc.: Leading Auto Parts Retailer
O’Reilly Automotive dominates the U.S. automotive aftermarket with over 5,700 stores. Its core revenue comes from selling automotive parts, tools, and accessories, serving both DIY customers and professional service providers. In 2021, the company focused on expanding store footprint and enhancing in-store services to solidify its competitive advantage in convenience and product availability.
Mobileye Global Inc.: Pioneer in Autonomous Driving
Mobileye Global leads in advanced driver assistance systems and autonomous driving technology. Its revenue engine centers on licensing its ADAS and self-driving solutions globally. In 2025, Mobileye emphasized cloud-enhanced driver assist and Level 4 autonomous solutions, reinforcing its position at the cutting edge of safety and autonomous mobility innovation.
Strategic Collision: Similarities & Divergences
O’Reilly’s strategy revolves around a physical retail network and aftermarket parts, while Mobileye pursues a technology-driven, software-centric model. Both compete indirectly by shaping the future vehicle experience—O’Reilly in maintenance and repair, Mobileye in automation and safety. Their distinct models reflect divergent investment profiles: O’Reilly with steady retail cash flow, Mobileye with high-growth tech exposure.
Income Statement Comparison
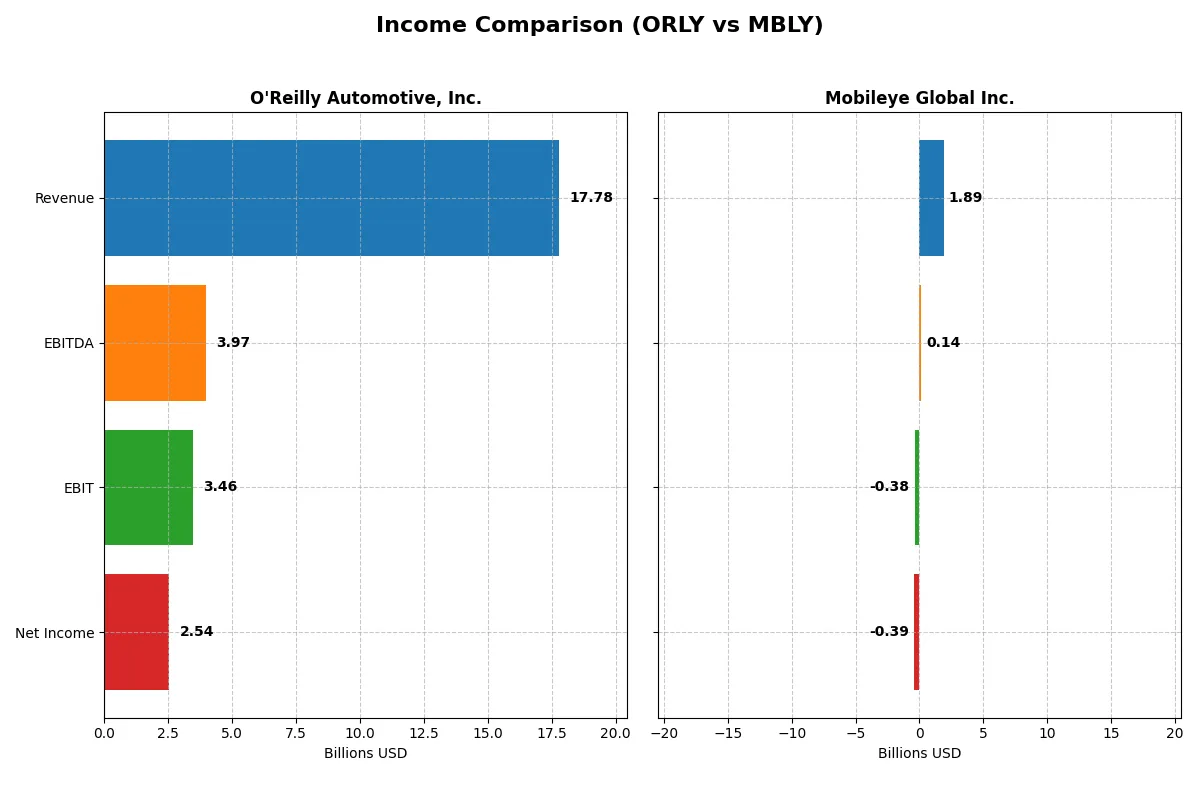
This data dissects the core profitability and scalability of both corporate engines to reveal who dominates the bottom line:
| Metric | O’Reilly Automotive, Inc. (ORLY) | Mobileye Global Inc. (MBLY) |
|---|---|---|
| Revenue | 17.8B | 1.89B |
| Cost of Revenue | 8.61B | 990M |
| Operating Expenses | 5.71B | 1.34B |
| Gross Profit | 9.17B | 904M |
| EBITDA | 3.97B | 140M |
| EBIT | 3.46B | -377M |
| Interest Expense | 235M | 0 |
| Net Income | 2.54B | -392M |
| EPS | 2.98 | -0.48 |
| Fiscal Year | 2025 | 2025 |
Income Statement Analysis: The Bottom-Line Duel
This income statement comparison reveals which company runs a more efficient and profitable corporate engine over recent years.
O’Reilly Automotive, Inc. Analysis
O’Reilly’s revenue climbed steadily from 13.3B in 2021 to 17.8B in 2025, with net income rising from 2.16B to 2.54B. The gross margin remains strong at 51.6%, supporting a healthy net margin of 14.3%. In 2025, O’Reilly showed solid momentum with 6.4% revenue growth and a slight dip in net margin, reflecting disciplined cost control but rising expenses.
Mobileye Global Inc. Analysis
Mobileye’s revenue grew from 1.39B in 2021 to 1.89B in 2025, with a sharp improvement in gross margin to 47.7%. However, net income stayed negative, shrinking losses from -750M to -392M. The EBIT margin remains unfavorable at -19.9%, though 2025 showed rapid progress with double-digit revenue and gross profit growth, signaling improving operational efficiency.
Margin Strength vs. Growth Trajectory
O’Reilly dominates with consistent profitability and expanding margins, reflecting a mature, stable business model. Mobileye impresses with rapid revenue and gross profit growth but struggles to reach profitability. For investors, O’Reilly’s profile suits those valuing margin power and steady earnings, while Mobileye appeals to those prioritizing growth despite ongoing losses.
Financial Ratios Comparison
These vital ratios act as a diagnostic tool to expose the underlying fiscal health, valuation premiums, and capital efficiency of the companies compared below:
| Ratios | O’Reilly Automotive, Inc. (ORLY) | Mobileye Global Inc. (MBLY) |
|---|---|---|
| ROE | -3.33% | -3.30% |
| ROIC | 33.05% | -3.64% |
| P/E | 30.60 | -21.61 |
| P/B | -101.74 | 0.71 |
| Current Ratio | 0.77 | 6.10 |
| Quick Ratio | 0.12 | 5.30 |
| D/E (Debt-to-Equity) | -11.12 | 0.01 |
| Debt-to-Assets | 51.34% | 0.54% |
| Interest Coverage | 14.72 | 0 |
| Asset Turnover | 1.08 | 0.15 |
| Fixed Asset Turnover | 2.06 | 4.00 |
| Payout ratio | 0 | 0 |
| Dividend yield | 0% | 0% |
| Fiscal Year | 2025 | 2025 |
Efficiency & Valuation Duel: The Vital Signs
Ratios act as a company’s DNA, exposing hidden risks and revealing operational excellence critical for investment decisions.
O’Reilly Automotive, Inc.
O’Reilly Automotive shows strong operational efficiency with a favorable 33% ROIC against a 6.1% WACC, signaling solid value creation. Yet, its negative ROE and stretched P/E of 30.6 suggest market skepticism on profitability. The company pays no dividend, focusing on reinvestment to sustain growth and operational cash flow.
Mobileye Global Inc.
Mobileye faces profitability challenges, reflected in negative net margin and ROIC, with a modest P/B of 0.71 indicating undervaluation. Its exceptionally high current and quick ratios confirm liquidity strength, but zero interest coverage warns of financial stress. The firm reinvests heavily in R&D, indicating a growth-focused strategy without dividends.
Premium Valuation vs. Operational Safety
O’Reilly balances strong returns on invested capital with a premium valuation, while Mobileye’s metrics expose risk despite liquidity and growth investment. Investors prioritizing operational safety and growth may prefer Mobileye’s profile. Those valuing proven capital efficiency and market confidence might lean toward O’Reilly.
Which one offers the Superior Shareholder Reward?
I observe that neither O’Reilly Automotive (ORLY) nor Mobileye Global (MBLY) pays dividends in 2026, indicating both prioritize reinvestment over immediate income. ORLY’s free cash flow per share stands robust at $1.87 with zero payout ratio, reflecting a conservative approach focused on steady cash generation and operational excellence. Conversely, MBLY, despite negative net margins, maintains a strong free cash flow per share of $0.64, signaling improving cash conversion amid heavy R&D and growth investments. ORLY lacks buybacks, while MBLY’s buyback data is unavailable but its cash ratio of 4.52 suggests ample liquidity for future buybacks. Historically, ORLY’s margin consistency and capital discipline imply a more sustainable shareholder return model. I conclude ORLY offers a superior total return profile in 2026 through stable free cash flow and prudent capital allocation, outweighing MBLY’s high-growth but riskier reinvestment strategy.
Comparative Score Analysis: The Strategic Profile
The radar chart reveals the fundamental DNA and trade-offs of O’Reilly Automotive and Mobileye Global, highlighting their distinct financial strengths and vulnerabilities:
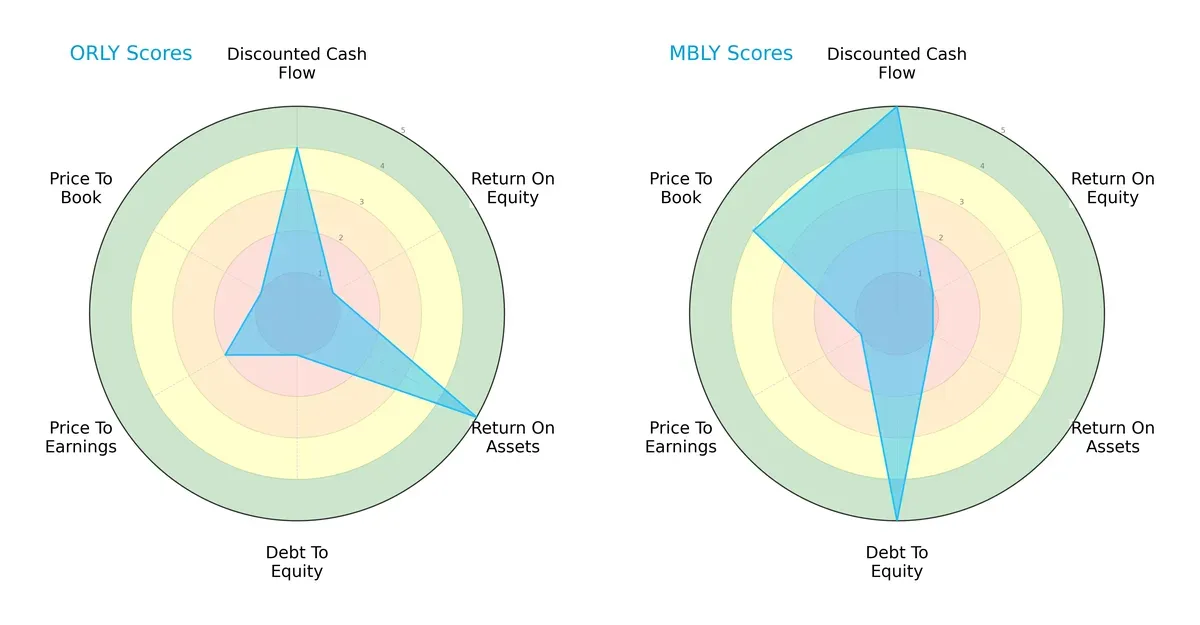
O’Reilly Automotive shows strength in asset utilization (ROA score 5) and discounted cash flow (DCF score 4), but suffers from weak equity returns (ROE score 1) and a risky debt profile (Debt/Equity score 1). Mobileye excels in DCF (score 5) and maintains a strong balance sheet (Debt/Equity score 5), yet it lags in asset efficiency (ROA score 1) and valuation metrics. O’Reilly’s profile is more asset-driven and leveraged, while Mobileye relies on robust cash flow and conservative capital structure for stability.
Bankruptcy Risk: Solvency Showdown
The Altman Z-Score delta signals a clear solvency advantage for Mobileye, positioning it deeper in the safe zone while O’Reilly remains secure but closer to caution:
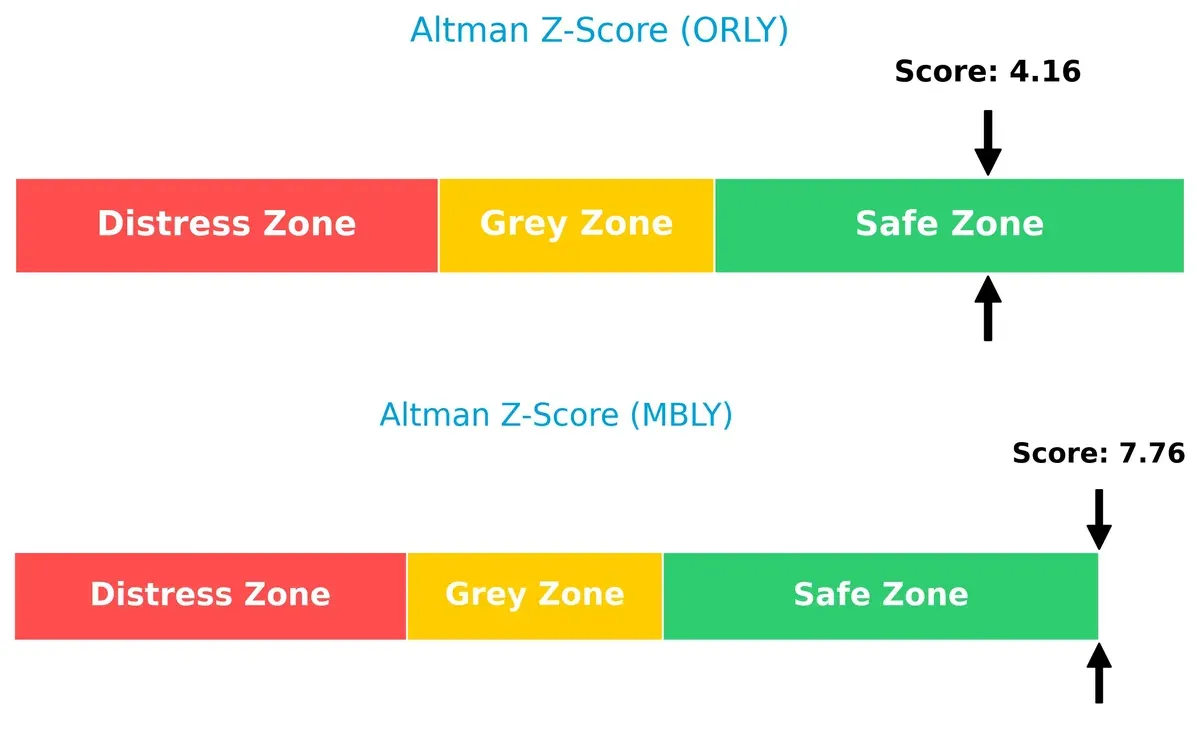
Mobileye’s score of 7.76 strongly suggests long-term survival with low bankruptcy risk. O’Reilly’s 4.16, though in the safe zone, indicates more moderate financial resilience amid economic stress.
Financial Health: Quality of Operations
O’Reilly’s Piotroski score of 7 reflects strong internal financial health, contrasting starkly with Mobileye’s weak 3, which raises red flags around operational efficiency and profitability:
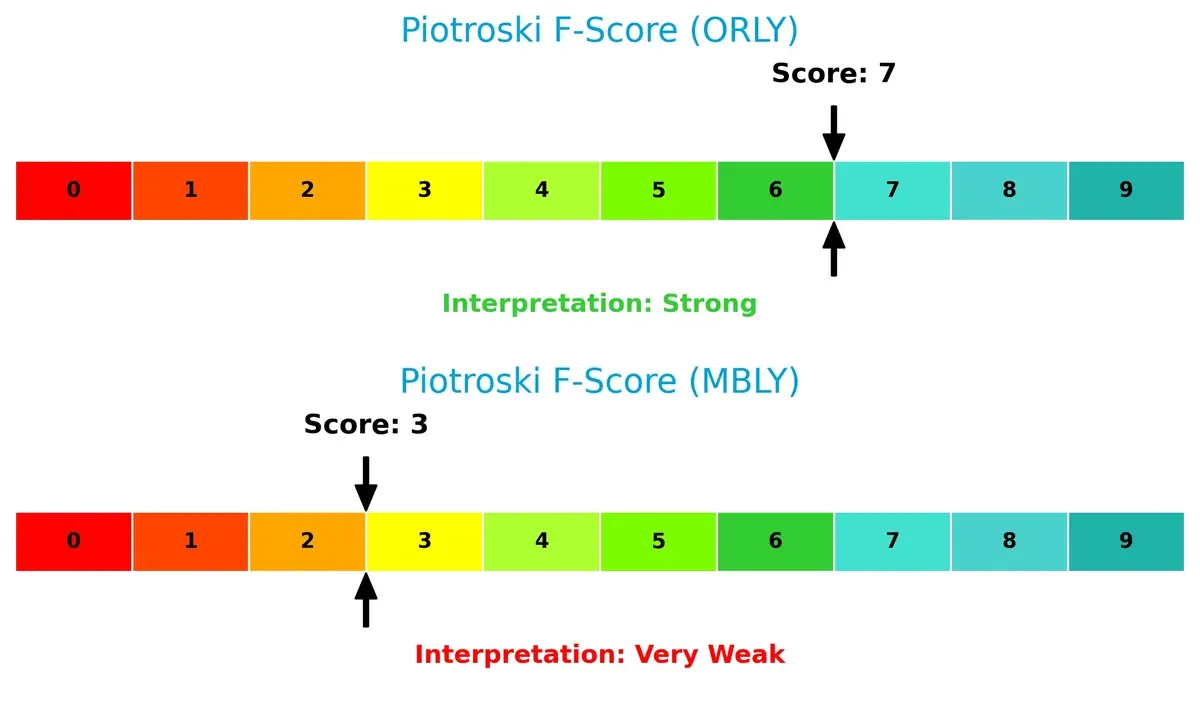
This gap suggests O’Reilly manages its earnings, liquidity, and leverage better, whereas Mobileye’s lower score warns investors to scrutinize its internal financial controls and asset quality.
How are the two companies positioned?
This section dissects the operational DNA of ORLY and MBLY by comparing their revenue distribution and internal strengths and weaknesses. The goal is to confront their economic moats to identify which model offers the most resilient competitive advantage today.
Revenue Segmentation: The Strategic Mix
This visual comparison dissects how O’Reilly Automotive and Mobileye Global diversify their income streams and where their primary sector bets lie:
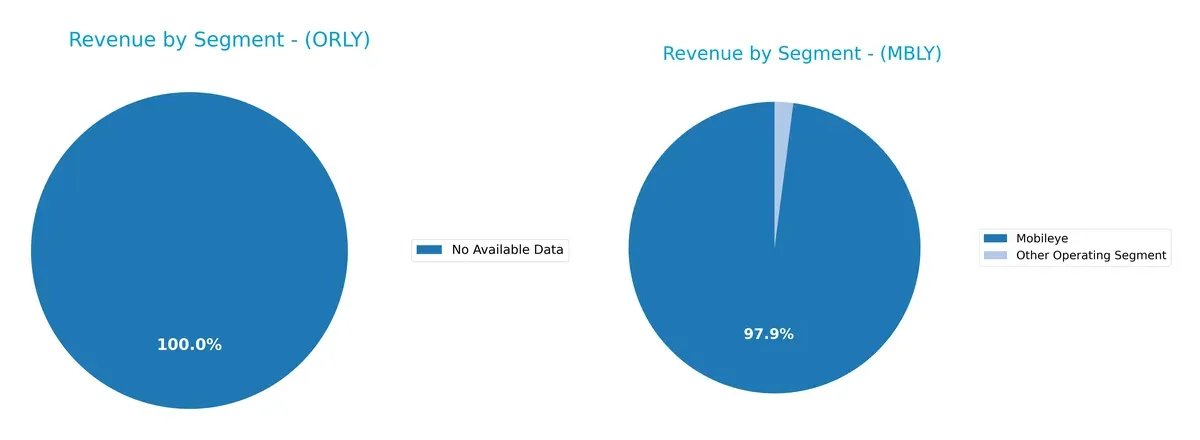
O’Reilly Automotive lacks available data to evaluate its revenue segmentation. Mobileye Global anchors its business in the Mobileye segment, generating $1.85B in 2025, dwarfing its other operating segment at $39M. This concentration signals a strategic focus on autonomous driving technology, creating ecosystem lock-in but exposing the firm to concentration risk without meaningful diversification.
Strengths and Weaknesses Comparison
This table compares the strengths and weaknesses of O’Reilly Automotive and Mobileye Global based on financial and market metrics:
O’Reilly Automotive Strengths
- High net margin at 14.27%
- Strong ROIC at 33.05% above WACC 6.1%
- Favorable interest coverage at 14.72
- Efficient asset turnover at 1.08
- Favorable price-to-book ratio
- Moderate global presence supported by stable operations
Mobileye Global Strengths
- Favorable WACC at 6.24%
- Favorable P/E and P/B ratios indicating market confidence
- Strong quick ratio at 5.3
- Very low debt-to-assets at 0.54%
- High fixed asset turnover at 4.0
- Diversified geographic revenue across multiple countries
O’Reilly Automotive Weaknesses
- Negative ROE at -332.51% signals accounting or operational issues
- Low current and quick ratios (0.77 and 0.12) pose liquidity concerns
- High debt-to-assets at 51.34% increases financial risk
- Unfavorable P/E ratio at 30.6
- No dividend yield
- Slightly negative price-to-book
Mobileye Global Weaknesses
- Negative net margin at -20.7% shows unprofitability
- Negative ROE and ROIC indicate poor capital returns
- Zero interest coverage raises solvency risk
- Low asset turnover at 0.15 reduces efficiency
- High current ratio at 6.1 suggests inefficient asset use
- No dividend yield
O’Reilly excels in profitability and capital efficiency but faces liquidity and leverage challenges. Mobileye shows strong market valuation and liquidity but struggles with profitability and operational efficiency. These contrasts highlight differing strategic priorities and financial health profiles.
The Moat Duel: Analyzing Competitive Defensibility
A structural moat is the only barrier protecting long-term profits from relentless competition. Let’s dissect the moats of these two auto parts innovators:
O’Reilly Automotive, Inc.: Distribution Scale and Customer Loyalty
O’Reilly’s moat stems from deep switching costs and extensive store network. It delivers stable 19.5% EBIT margins and 14.3% net margins. In 2026, expansion into professional services could fortify this advantage despite slight ROIC declines.
Mobileye Global Inc.: Technological Innovation and Intellectual Property
Mobileye’s moat relies on cutting-edge autonomous driving tech and IP. Unlike O’Reilly, it suffers negative EBIT and net margins but posts strong revenue growth of 14.5%. Its future hinges on scaling ADAS adoption and global market penetration.
The Moat Clash: Scale Distribution vs. Tech Innovation
O’Reilly boasts a wider, more stable moat with positive ROIC outperforming WACC by 27%. Mobileye’s tech moat is promising but value-destructive with declining profitability. O’Reilly is better positioned to defend and grow its market share in 2026.
Which stock offers better returns?
The past year shows contrasting price dynamics: O’Reilly Automotive climbs steadily with some slowdown, while Mobileye Global faces sharp declines and persistent downward pressure.
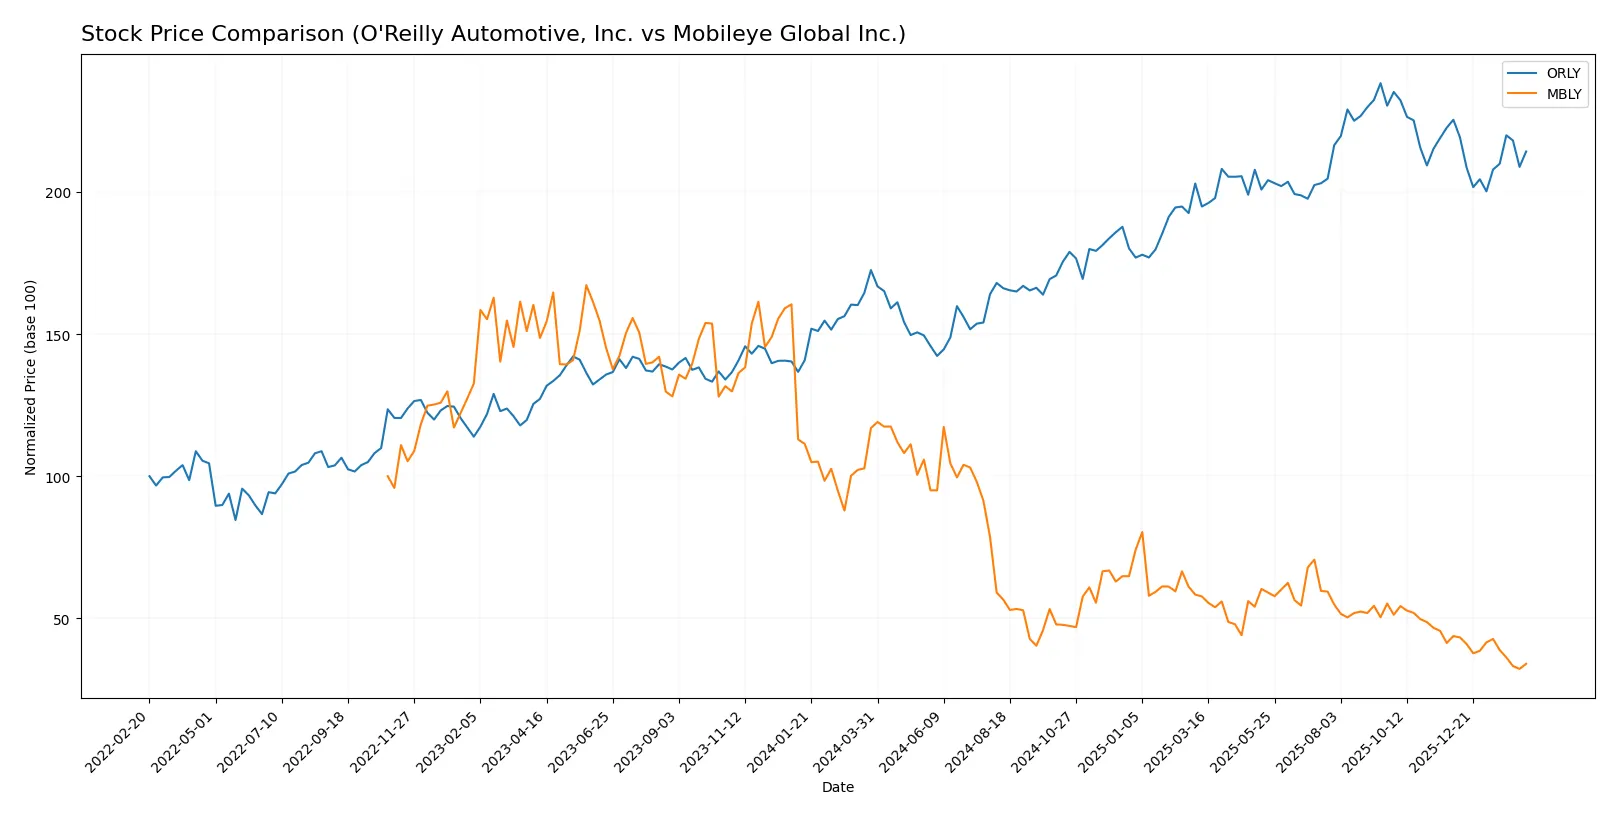
Trend Comparison
O’Reilly Automotive’s stock price rose 24.18% over the past year, indicating a bullish trend with decelerating momentum. Its volatility is moderate, ranging from $64.22 to a high of $107.5.
Mobileye Global’s stock price dropped 70.89% in the same period, marking a bearish trend that decelerates further. Price volatility remains elevated, hitting a low of $8.71 from a $32.15 peak.
Comparing both, O’Reilly Automotive delivered the highest market performance with a strong bullish trend, while Mobileye Global suffered significant losses and bearish momentum.
Target Prices
Analysts present a broad consensus on target prices for O’Reilly Automotive and Mobileye Global.
| Company | Target Low | Target High | Consensus |
|---|---|---|---|
| O’Reilly Automotive, Inc. | 91 | 121 | 108.62 |
| Mobileye Global Inc. | 11 | 28 | 16.71 |
The consensus target for O’Reilly sits roughly 12% above its current price of $96.66, indicating moderate upside. Mobileye’s target consensus nearly doubles its current $9.19 price, reflecting higher growth expectations but also greater risk.

Don’t Let Luck Decide Your Entry Point
Optimize your entry points with our advanced ProRealTime indicators. You’ll get efficient buy signals with precise price targets for maximum performance. Start outperforming now!
How do institutions grade them?
O’Reilly Automotive, Inc. Grades
The following table summarizes recent institutional grades for O’Reilly Automotive, Inc.:
| Grading Company | Action | New Grade | Date |
|---|---|---|---|
| Citigroup | Maintain | Buy | 2026-02-09 |
| DA Davidson | Maintain | Buy | 2026-02-06 |
| JP Morgan | Maintain | Overweight | 2026-02-06 |
| Truist Securities | Maintain | Buy | 2026-02-06 |
| RBC Capital | Maintain | Outperform | 2026-02-06 |
| Mizuho | Maintain | Outperform | 2026-02-06 |
| DA Davidson | Maintain | Buy | 2026-02-05 |
| DA Davidson | Maintain | Buy | 2026-02-03 |
| RBC Capital | Maintain | Outperform | 2026-01-30 |
| Morgan Stanley | Maintain | Overweight | 2026-01-15 |
Mobileye Global Inc. Grades
The following table summarizes recent institutional grades for Mobileye Global Inc.:
| Grading Company | Action | New Grade | Date |
|---|---|---|---|
| Tigress Financial | Maintain | Buy | 2026-01-29 |
| RBC Capital | Maintain | Sector Perform | 2026-01-23 |
| Morgan Stanley | Maintain | Equal Weight | 2026-01-23 |
| Needham | Maintain | Buy | 2026-01-23 |
| UBS | Maintain | Neutral | 2026-01-23 |
| Canaccord Genuity | Maintain | Buy | 2026-01-23 |
| Wells Fargo | Maintain | Overweight | 2026-01-23 |
| HSBC | Downgrade | Hold | 2026-01-23 |
| UBS | Maintain | Neutral | 2026-01-14 |
| Wolfe Research | Downgrade | Peer Perform | 2026-01-12 |
Which company has the best grades?
O’Reilly Automotive consistently receives strong buy and outperform ratings, indicating robust institutional confidence. Mobileye’s grades are more mixed, including neutral and downgraded ratings, which may signal cautious investor sentiment. This divergence could influence risk assessments differently for each stock.
Risks specific to each company
The following categories identify the critical pressure points and systemic threats facing both firms in the 2026 market environment:
1. Market & Competition
O’Reilly Automotive, Inc. (ORLY)
- Faces intense competition in mature auto-parts retail with pressure on margins.
Mobileye Global Inc. (MBLY)
- Competes in emerging ADAS/autonomous tech with rapid innovation demands and uncertain adoption.
2. Capital Structure & Debt
ORLY
- High debt-to-assets ratio at 51.3% signals leverage risk despite strong interest coverage.
MBLY
- Minimal debt and strong debt-to-assets ratio (0.54%) indicate conservative capital structure.
3. Stock Volatility
ORLY
- Beta of 0.62 suggests moderate market sensitivity with relatively stable trading range.
MBLY
- Beta of 0.56 indicates slightly lower volatility but stock price range remains wide, reflecting speculative risk.
4. Regulatory & Legal
ORLY
- Subject to U.S. auto aftermarket regulations; risks from changing environmental and safety standards.
MBLY
- Faces evolving global regulations on autonomous driving and data privacy, increasing compliance costs.
5. Supply Chain & Operations
ORLY
- Relies on extensive physical distribution network; vulnerable to supply chain disruptions and inflation.
MBLY
- Dependent on semiconductor supply and software updates; risks from component shortages and tech delays.
6. ESG & Climate Transition
ORLY
- Moderate exposure to environmental risks; transition to electric vehicles may reduce aftermarket parts demand.
MBLY
- High ESG scrutiny due to autonomous tech impact and data use; climate transition may create growth opportunities.
7. Geopolitical Exposure
ORLY
- Primarily U.S. focused, limited direct geopolitical risk but sensitive to trade policies affecting imports.
MBLY
- Global footprint with headquarters in Israel; geopolitical tensions could disrupt operations and partnerships.
Which company shows a better risk-adjusted profile?
O’Reilly Automotive’s main risk is its high leverage amid a competitive, mature market. Mobileye’s greatest vulnerability lies in regulatory uncertainty and operational reliance on cutting-edge tech supply chains. Despite Mobileye’s weak profitability and Piotroski score, its low debt and safe Altman Z-score reflect resilience. I see Mobileye as having a better risk-adjusted profile, supported by its clean balance sheet and strong DCF score, whereas O’Reilly’s elevated debt and liquidity ratios warrant caution.
Final Verdict: Which stock to choose?
O’Reilly Automotive’s superpower lies in its robust capital efficiency and consistent value creation. Its strong ROIC far exceeds its cost of capital, signaling a durable competitive edge. The main point of vigilance is its stretched liquidity position, which could pressure short-term flexibility. It suits investors targeting resilient, cash-generative businesses in an aggressive growth portfolio.
Mobileye’s strategic moat is anchored in its cutting-edge autonomous driving technology and high R&D investment, fostering a defensible innovation lead. It offers a safer balance sheet and strong current liquidity compared to O’Reilly. This profile aligns better with growth-at-a-reasonable-price investors who prioritize technological moat and financial stability.
If you prioritize proven capital efficiency and steady cash flow, O’Reilly Automotive outshines with its value-creation track record despite liquidity risks. However, if you seek technological innovation with a more conservative financial structure, Mobileye offers better stability and growth potential at a different risk profile. Both present distinct analytical scenarios suited to divergent investor strategies.
Disclaimer: Investment carries a risk of loss of initial capital. The past performance is not a reliable indicator of future results. Be sure to understand risks before making an investment decision.
Go Further
I encourage you to read the complete analyses of O’Reilly Automotive, Inc. and Mobileye Global Inc. to enhance your investment decisions: