Home > Comparison > Consumer Cyclical > MBLY vs MVIS
The strategic rivalry between Mobileye Global Inc. and MicroVision, Inc. shapes the future of automotive and technology innovation. Mobileye operates as a consumer cyclical leader, focusing on advanced driver assistance and autonomous vehicle systems. In contrast, MicroVision specializes in technology hardware, developing lidar sensors and scanning modules. This analysis aims to identify which business model offers superior risk-adjusted returns for a diversified portfolio amid evolving sector dynamics.

Table of contents
Companies Overview
Mobileye and MicroVision both play critical roles in advancing automotive safety and autonomous driving technologies in 2026.
Mobileye Global Inc.: Autonomous Driving Pioneer
Mobileye leads as a developer of advanced driver assistance systems (ADAS) and autonomous driving solutions worldwide. Its revenue stems from selling technologies that enable real-time detection of road users and safety alerts. In 2026, Mobileye strategically focuses on expanding its cloud-enhanced driver assist and Level 4 autonomous driving offerings, strengthening its competitive edge in safety and autonomy.
MicroVision, Inc.: Lidar Innovator
MicroVision specializes in lidar sensors essential for automotive safety and autonomous driving, leveraging micro-electrical mechanical systems and laser scanning technology. Its core revenue derives from supplying OEMs and ODMs with lidar and micro-display solutions. The company’s 2026 strategic priority lies in advancing long-range lidar technology and expanding applications beyond automotive into smart home and AR devices.
Strategic Collision: Similarities & Divergences
Mobileye emphasizes an integrated ADAS and autonomous driving ecosystem while MicroVision focuses on core lidar sensor innovation as a component supplier. Their main battleground is automotive autonomy, where Mobileye’s software-driven approach competes with MicroVision’s hardware-centric lidar technology. This dynamic creates distinct investment profiles: Mobileye as a systems integrator with scale, MicroVision as a specialized tech innovator with niche exposure.
Income Statement Comparison
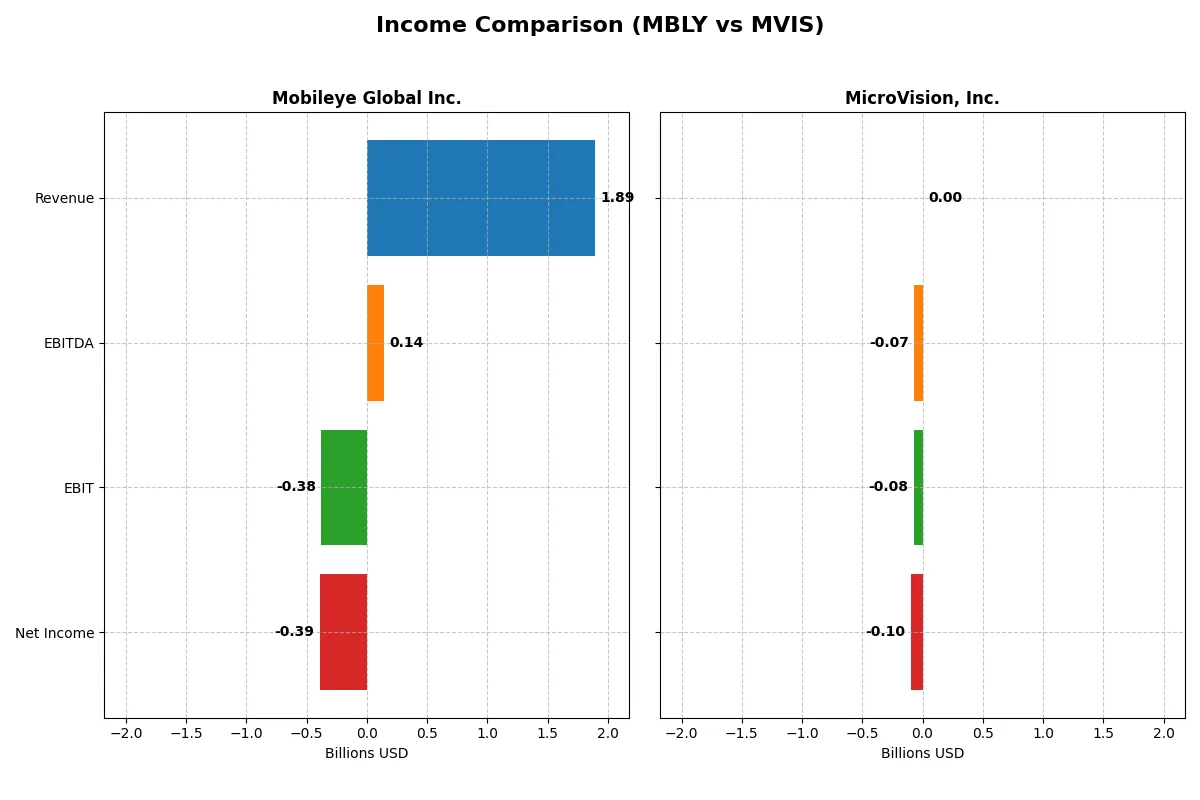
This data dissects the core profitability and scalability of both corporate engines to reveal who dominates the bottom line:
| Metric | Mobileye Global Inc. (MBLY) | MicroVision, Inc. (MVIS) |
|---|---|---|
| Revenue | 1.89B | 4.70M |
| Cost of Revenue | 990M | 7.53M |
| Operating Expenses | 1.34B | 82.7M |
| Gross Profit | 904M | -2.83M |
| EBITDA | 140M | -70.98M |
| EBIT | -377M | -75.20M |
| Interest Expense | 0 | 4.46M |
| Net Income | -392M | -96.92M |
| EPS | -0.48 | -0.46 |
| Fiscal Year | 2025 | 2024 |
Income Statement Analysis: The Bottom-Line Duel
This income statement comparison reveals which company runs a more efficient and sustainable corporate engine through their revenue and profit dynamics.
Mobileye Global Inc. Analysis
Mobileye shows steady revenue growth, reaching $1.89B in 2025, with a 14.5% increase year-over-year. Gross margins remain robust at 47.7%, though net margins are negative at -20.7%, reflecting high R&D investment. The 2025 figures demonstrate improved operating momentum, with EBITDA positive at $140M and EBIT losses narrowing sharply.
MicroVision, Inc. Analysis
MicroVision’s revenue declined 35% to $4.7M in 2024, with gross margins deeply negative at -60.4%. The company operates at a substantial loss, with net margins exceeding -2000%. Despite a modest EBIT improvement, ongoing heavy operating losses and a high interest expense ratio highlight continued inefficiencies and financial strain.
Margin Resilience vs. High Losses
Mobileye outperforms with higher revenue scale and healthier gross margins, indicating better cost control and growth momentum. MicroVision struggles with shrinking revenues, steep losses, and poor margin health. For investors, Mobileye’s profile offers a clearer path toward operational break-even, while MicroVision remains a riskier, loss-heavy proposition.
Financial Ratios Comparison
These vital ratios act as a diagnostic tool to expose the underlying fiscal health, valuation premiums, and capital efficiency of the companies compared below:
| Ratios | Mobileye Global Inc. (MBLY) | MicroVision, Inc. (MVIS) |
|---|---|---|
| ROE | -3.3% | -198.7% |
| ROIC | -3.6% | -83.7% |
| P/E | -21.6 | -2.8 |
| P/B | 0.71 | 5.63 |
| Current Ratio | 6.10 | 1.79 |
| Quick Ratio | 5.30 | 1.74 |
| D/E | 0 | 1.06 |
| Debt-to-Assets | 0 | 0.43 |
| Interest Coverage | 0 | -19.2 |
| Asset Turnover | 0.15 | 0.04 |
| Fixed Asset Turnover | 4.00 | 0.20 |
| Payout Ratio | 0 | 0 |
| Dividend Yield | 0% | 0% |
| Fiscal Year | 2025 | 2024 |
Efficiency & Valuation Duel: The Vital Signs
Financial ratios act as a company’s DNA, exposing hidden risks and revealing operational excellence through key profitability and valuation metrics.
Mobileye Global Inc.
Mobileye shows weak profitability with a negative ROE of -3.3% and a net margin at -20.7%. Valuation appears reasonable, with a P/E ratio favorable at -21.6 and a P/B of 0.71 indicating undervaluation. The company lacks dividends but reinvests heavily in R&D, signaling growth focus despite a mixed liquidity profile.
MicroVision, Inc.
MicroVision suffers from severe profitability issues, with a ROE of -198.7% and a net margin of -2063.8%. Its valuation is stretched, reflected by a high P/B of 5.63 and a very unfavorable asset turnover. The firm pays no dividend, investing intensely in R&D, but financial health appears fragile with elevated debt levels.
Premium Valuation vs. Operational Safety
Mobileye offers a better balance of valuation and operational efficiency, despite profitability challenges. MicroVision’s severe losses and stretched valuation suggest higher risk. Investors seeking stability might prefer Mobileye’s profile, while those targeting speculative growth face significant risks with MicroVision.
Which one offers the Superior Shareholder Reward?
Mobileye (MBLY) adopts a no-dividend policy but generates positive free cash flow (0.64/share in 2025) and maintains a strong buyback-capable balance sheet with a high current ratio (6.1). In contrast, MicroVision (MVIS) neither pays dividends nor produces positive free cash flow, suffering negative operating margins and heavy leverage. Mobileye’s sustainable capital allocation and cash generation favor long-term shareholder value, while MicroVision’s financial distress hinders total return potential. I conclude Mobileye offers a superior total shareholder reward in 2026.
Comparative Score Analysis: The Strategic Profile
The radar chart reveals the fundamental DNA and trade-offs of Mobileye Global Inc. and MicroVision, Inc., highlighting their financial strengths and weaknesses:
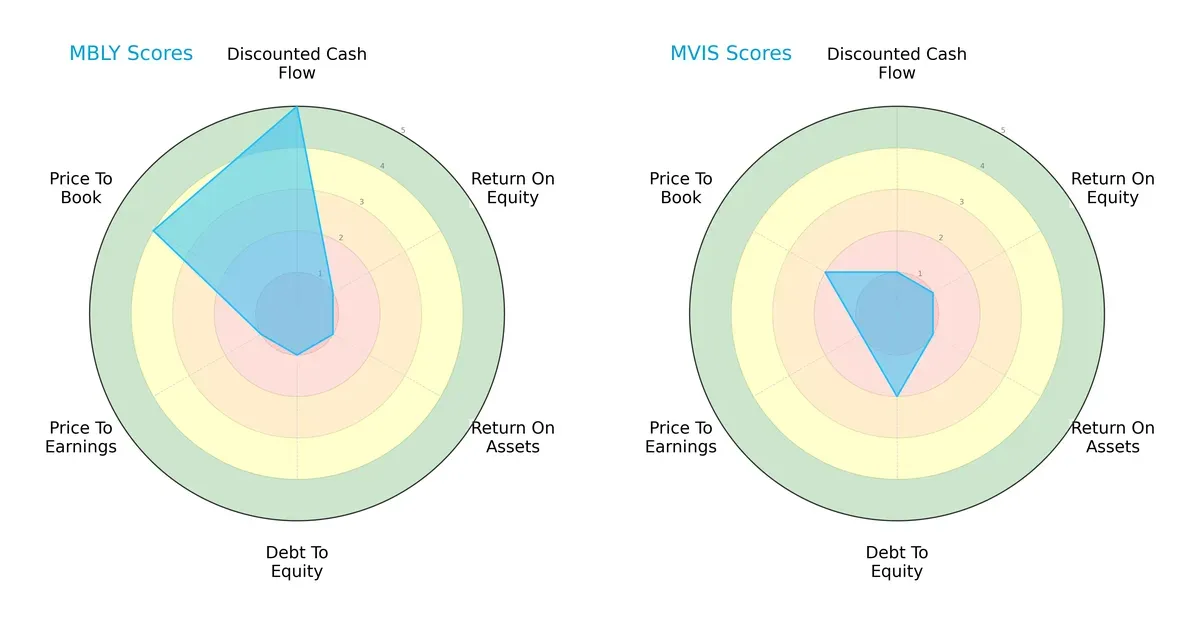
Mobileye excels in discounted cash flow (DCF) with a very favorable score of 5, signaling strong intrinsic value. However, it struggles with return on equity (ROE), return on assets (ROA), and debt-to-equity, each scoring 1, indicating operational and leverage challenges. MicroVision scores uniformly low, except for a moderate debt-to-equity score of 2. Mobileye’s profile is more balanced due to its strong valuation metric (P/B score of 4), while MicroVision relies mainly on moderate leverage management. Overall, Mobileye presents a more nuanced strategic position despite weaknesses in profitability and leverage.
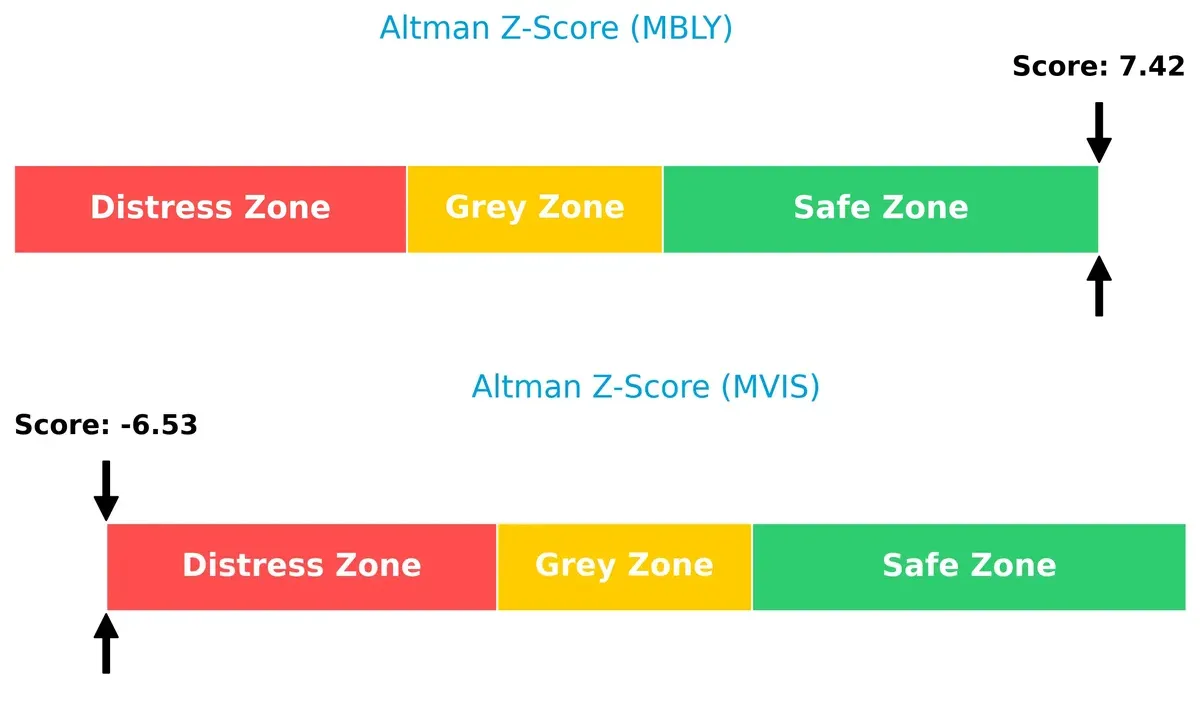
Bankruptcy Risk: Solvency Showdown
Mobileye’s Altman Z-Score of 7.42 places it well within the safe zone, signaling robust long-term solvency. MicroVision’s score of -6.53 lands it in the distress zone, reflecting severe bankruptcy risk and financial instability in the current cycle:
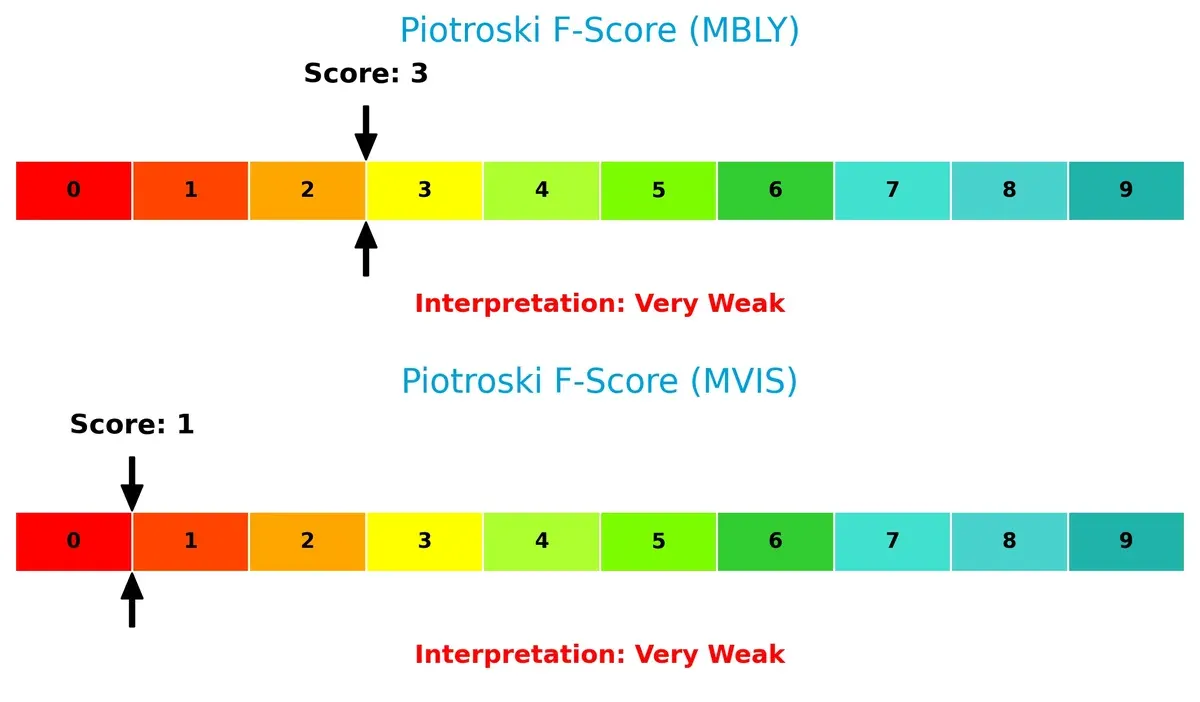
Financial Health: Quality of Operations
Both companies show very weak Piotroski F-Scores—Mobileye at 3 and MicroVision at 1—indicating internal financial metrics and operational efficiency require urgent improvement. Mobileye slightly outperforms MicroVision, but both raise red flags for investors seeking financially healthy firms:
How are the two companies positioned?
This section dissects the operational DNA of Mobileye and MicroVision by comparing their revenue distribution and internal strengths and weaknesses. The goal is to confront their economic moats to reveal which model delivers the most resilient competitive advantage today.
Revenue Segmentation: The Strategic Mix
The following visual comparison dissects how Mobileye Global Inc. and MicroVision, Inc. diversify their income streams and where their primary sector bets lie:
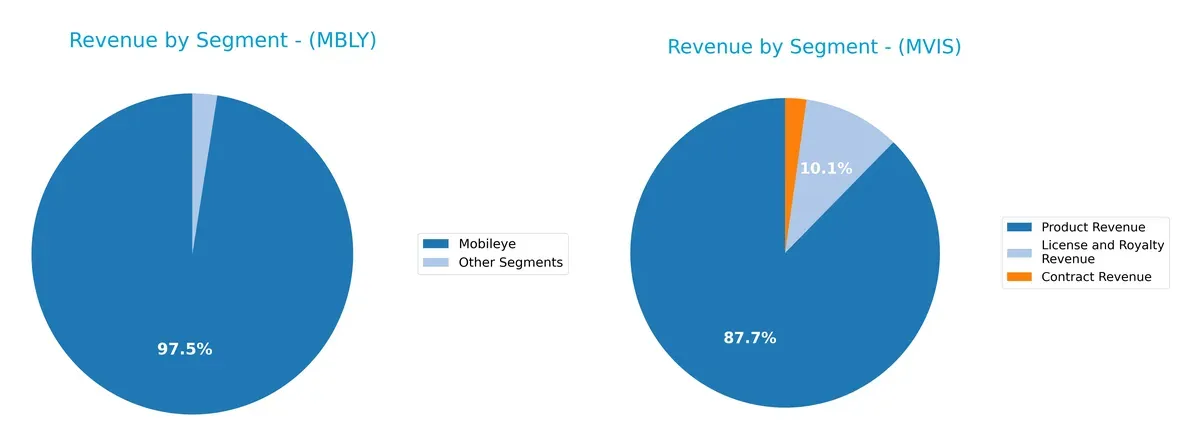
Mobileye anchors its revenue heavily on the Mobileye segment, generating $1.61B in 2024, dwarfing its $41M from other segments. This signals a concentrated bet on automotive vision systems. MicroVision, by contrast, pivots across Contract, License, and Product revenues, with $4.12M in Product and $475K in License and Royalty in 2024. MicroVision’s diversified mix reduces concentration risk but may dilute focus compared to Mobileye’s ecosystem lock-in approach.
Strengths and Weaknesses Comparison
This table compares the strengths and weaknesses of Mobileye Global Inc. and MicroVision, Inc.:
Mobileye Global Inc. Strengths
- Strong global presence including US, China, Germany, and UK
- Favorable quick ratio at 5.3 indicates liquidity
- Zero debt supports financial stability
- Favorable price-to-book ratio at 0.71
- High fixed asset turnover at 4.0 shows efficient asset use
MicroVision, Inc. Strengths
- Favorable price-to-earnings ratio at -2.83
- Current ratio at 1.79 signals reasonable short-term liquidity
- Quick ratio at 1.74 supports liquidity
- Neutral debt-to-assets at 42.62% reflects balanced leverage
Mobileye Global Inc. Weaknesses
- Negative net margin at -20.7% highlights unprofitability
- Negative ROE and ROIC indicate poor capital returns
- Current ratio unusually high at 6.1 could signal inefficient working capital
- Zero interest coverage raises solvency concerns
- Low asset turnover at 0.15 reflects weak revenue generation from assets
MicroVision, Inc. Weaknesses
- Severely negative net margin at -2063.78% signals extreme losses
- Very negative ROE and ROIC show poor capital efficiency
- High debt-to-equity at 1.06 raises financial risk
- Unfavorable PB ratio at 5.63 may indicate overvaluation
- Poor interest coverage and asset turnover ratios reflect operational challenges
Mobileye shows robust global diversification and financial stability but struggles with profitability and capital efficiency. MicroVision faces more acute profitability and leverage issues, limiting its financial flexibility and operational efficiency. These contrasts highlight differing strategic and financial challenges for each company.
The Moat Duel: Analyzing Competitive Defensibility
A structural moat is the only defense preserving long-term profits from relentless competition and market disruption:
Mobileye Global Inc.: Intangible Assets and Network Effects Moat
Mobileye leverages proprietary ADAS technology and cloud-enhanced systems, sustaining high gross margins near 48%. Despite declining ROIC, new autonomous driving solutions could deepen its moat in 2026.
MicroVision, Inc.: Innovation-Driven Technology Moat
MicroVision’s moat hinges on pioneering lidar scanning technology, contrasting Mobileye’s scale. Though ROIC remains below WACC, improving profitability signals potential for future market penetration and disruption.
Verdict: Proprietary Platforms vs. Emerging Innovation
Mobileye’s intangible asset moat is wider due to established market presence and stable gross margins. MicroVision shows a narrower moat but improving ROIC trends. Mobileye is better positioned to defend market share in 2026.
Which stock offers better returns?
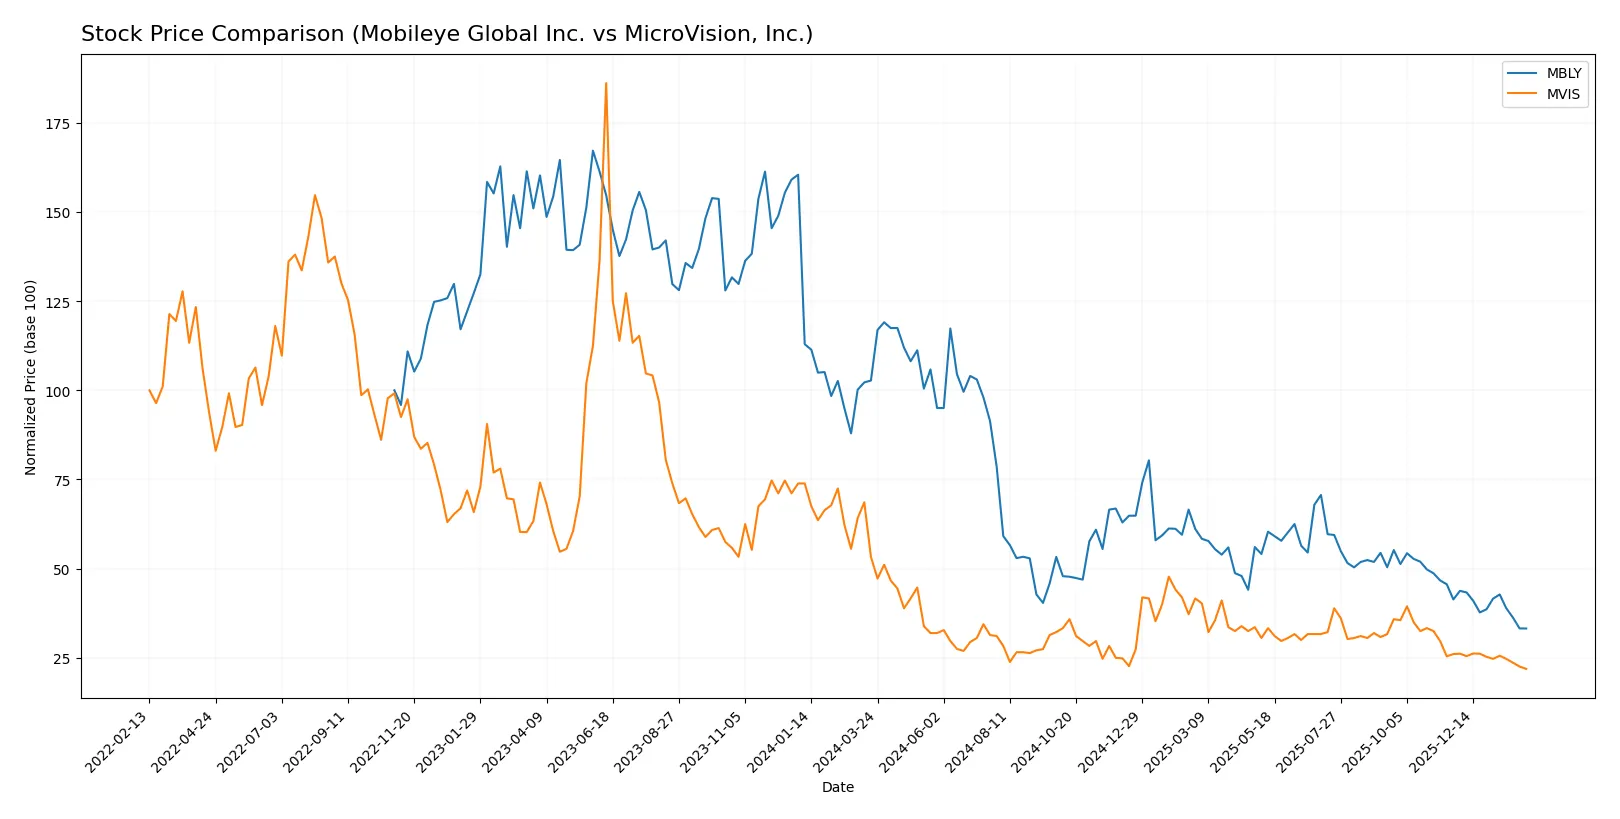
Over the past year, both Mobileye Global Inc. and MicroVision, Inc. stocks have experienced significant price declines, with steady seller dominance shaping trading dynamics.
Trend Comparison
Mobileye Global Inc. (MBLY) shows a bearish trend with a -67.66% price drop over 12 months, decelerating in decline, and a high volatility level at 6.1 std deviation. The price ranged between $8.97 and $32.15.
MicroVision, Inc. (MVIS) also reveals a bearish trend, down -58.93% over the same period, with decelerating loss and low volatility at 0.23 std deviation. Its price fluctuated from $0.79 to $1.92.
Comparing trends, MBLY and MVIS both underperformed sharply, but MBLY’s larger percentage loss marks it as the weaker performer over the past year.
Target Prices
Analysts present a cautiously optimistic consensus for Mobileye Global Inc. and MicroVision, Inc. with notable upside potential indicated.
| Company | Target Low | Target High | Consensus |
|---|---|---|---|
| Mobileye Global Inc. | 11 | 28 | 16.71 |
| MicroVision, Inc. | 5 | 5 | 5 |
Mobileye’s consensus target of $16.71 suggests a nearly 86% upside from the current $8.97 price, signaling strong growth expectations. MicroVision’s target at $5 implies substantial appreciation potential from the current $0.79 price, reflecting bullish analyst views despite higher volatility risks.

Don’t Let Luck Decide Your Entry Point
Optimize your entry points with our advanced ProRealTime indicators. You’ll get efficient buy signals with precise price targets for maximum performance. Start outperforming now!
How do institutions grade them?
Here is a detailed comparison of recent institutional grades for Mobileye Global Inc. and MicroVision, Inc.:
Mobileye Global Inc. Grades
These grades reflect the latest analyst views on Mobileye’s stock performance and outlook.
| Grading Company | Action | New Grade | Date |
|---|---|---|---|
| Tigress Financial | Maintain | Buy | 2026-01-29 |
| RBC Capital | Maintain | Sector Perform | 2026-01-23 |
| Needham | Maintain | Buy | 2026-01-23 |
| UBS | Maintain | Neutral | 2026-01-23 |
| Canaccord Genuity | Maintain | Buy | 2026-01-23 |
| Morgan Stanley | Maintain | Equal Weight | 2026-01-23 |
| Wells Fargo | Maintain | Overweight | 2026-01-23 |
| HSBC | Downgrade | Hold | 2026-01-23 |
| UBS | Maintain | Neutral | 2026-01-14 |
| Wolfe Research | Downgrade | Peer Perform | 2026-01-12 |
MicroVision, Inc. Grades
The table below summarizes consistent buy ratings for MicroVision from key analysts.
| Grading Company | Action | New Grade | Date |
|---|---|---|---|
| D. Boral Capital | Maintain | Buy | 2026-01-27 |
| D. Boral Capital | Maintain | Buy | 2025-12-16 |
| D. Boral Capital | Maintain | Buy | 2025-11-12 |
| WestPark Capital | Maintain | Buy | 2025-10-21 |
| WestPark Capital | Maintain | Buy | 2025-09-05 |
| D. Boral Capital | Maintain | Buy | 2025-09-02 |
| WestPark Capital | Maintain | Buy | 2025-08-27 |
| D. Boral Capital | Maintain | Buy | 2025-08-11 |
| D. Boral Capital | Maintain | Buy | 2025-05-21 |
| D. Boral Capital | Maintain | Buy | 2025-05-13 |
Which company has the best grades?
MicroVision, Inc. consistently earns “Buy” ratings without downgrades, indicating strong analyst confidence. Mobileye shows a mix of “Buy,” “Hold,” and “Neutral” grades with recent downgrades, reflecting more cautious sentiment. This divergence may influence investor risk appetite and portfolio positioning.
Risks specific to each company
The following categories identify the critical pressure points and systemic threats facing Mobileye Global Inc. and MicroVision, Inc. in the 2026 market environment:
1. Market & Competition
Mobileye Global Inc.
- Well-established ADAS leader with strong Intel backing but faces intense competition in autonomous driving tech.
MicroVision, Inc.
- Smaller player with niche lidar tech; struggles to scale and compete with larger sensor manufacturers.
2. Capital Structure & Debt
Mobileye Global Inc.
- Zero debt, strong balance sheet, low financial risk.
MicroVision, Inc.
- High debt-to-equity ratio (1.06) raises solvency concerns and financial burden.
3. Stock Volatility
Mobileye Global Inc.
- Low beta (0.56) indicates lower volatility and relative stability versus market.
MicroVision, Inc.
- High beta (1.27) signals greater risk and price swings.
4. Regulatory & Legal
Mobileye Global Inc.
- Faces heavy regulatory scrutiny in autonomous vehicle safety compliance globally.
MicroVision, Inc.
- Regulatory risks lower but exposed to intellectual property litigation threats.
5. Supply Chain & Operations
Mobileye Global Inc.
- Large-scale operations with complex supply chains; potential disruptions could impact delivery.
MicroVision, Inc.
- Smaller scale operations; supply chain disruptions more manageable but risk of supplier dependence.
6. ESG & Climate Transition
Mobileye Global Inc.
- Increasing focus on sustainability and reducing carbon footprint in auto parts sector.
MicroVision, Inc.
- Limited ESG disclosures; risks in adapting to evolving climate regulations.
7. Geopolitical Exposure
Mobileye Global Inc.
- Headquarters in Israel exposes it to Middle East geopolitical tensions affecting operations.
MicroVision, Inc.
- US-based, less exposed to high geopolitical risk regions.
Which company shows a better risk-adjusted profile?
Mobileye’s key risk is regulatory pressure in the evolving autonomous driving sector. MicroVision faces severe financial distress risk due to heavy debt and weak profitability. Mobileye’s strong balance sheet and lower volatility give it a superior risk-adjusted profile. Notably, MicroVision’s Altman Z-score places it in the distress zone, highlighting bankruptcy risk.
Final Verdict: Which stock to choose?
Mobileye Global Inc. (MBLY) stands out as a cash generator with a robust current ratio signaling strong liquidity. Its superpower lies in efficient capital management and solid revenue growth. The point of vigilance is its negative returns on invested capital, reflecting challenges in profitability. MBLY suits portfolios targeting aggressive growth with a tolerance for operational recovery.
MicroVision, Inc. (MVIS) offers a strategic moat in high R&D intensity, aiming at breakthrough innovation. It carries greater financial risk and weaker profitability metrics than MBLY but shows signs of improving ROIC trends. MVIS fits speculative growth portfolios where investors seek potential long-term value creation despite near-term instability.
If you prioritize steady cash flow and operational resilience, Mobileye outshines with better liquidity and revenue momentum. However, if you seek speculative upside through innovation with a higher risk appetite, MicroVision offers a scenario of emerging profitability. Both stocks command caution due to their value destruction signals but differ on the risk-return spectrum.
Disclaimer: Investment carries a risk of loss of initial capital. The past performance is not a reliable indicator of future results. Be sure to understand risks before making an investment decision.
Go Further
I encourage you to read the complete analyses of Mobileye Global Inc. and MicroVision, Inc. to enhance your investment decisions: