Trimble Inc. (TRMB) and MKS Inc. (MKSI) are two prominent players in the hardware, equipment, and parts industry, each driving innovation in specialized technology sectors. While Trimble focuses on precision solutions for construction, agriculture, and transportation, MKS specializes in advanced instruments for semiconductor and industrial applications. Their overlapping technological innovation and market presence make this comparison relevant. In this article, I will help you identify which company holds the most promise for your investment portfolio.

Table of contents
Companies Overview
I will begin the comparison between Trimble Inc. and MKS Inc. by providing an overview of these two companies and their main differences.
Trimble Inc. Overview
Trimble Inc. provides technology solutions that enable professionals and field mobile workers to enhance or transform their work processes worldwide. Its offerings span software and hardware across segments such as Buildings and Infrastructure, Geospatial, Resources and Utilities, and Transportation. Headquartered in Westminster, California, Trimble focuses on precision agriculture, construction, and transportation technology markets with a global reach.
MKS Inc. Overview
MKS Inc. delivers instruments, systems, and process control solutions that measure, monitor, and control manufacturing parameters globally. Its product portfolio includes vacuum and analysis equipment, laser technologies, photonics, and laser-based systems for printed circuit board manufacturing. Based in Andover, Massachusetts, MKS serves semiconductor, industrial, life sciences, research, and defense sectors through direct sales and distributors.
Key similarities and differences
Both Trimble and MKS operate in the technology sector within hardware and equipment industries, providing specialized solutions for professional and industrial applications. Trimble emphasizes software and integrated systems primarily for construction, agriculture, and transportation, while MKS focuses on precision instruments and laser technologies for manufacturing and semiconductor markets. Their business models differ in customer focus and product specialization, with Trimble leaning towards field mobility and asset management, and MKS targeting process control and photonics.
Income Statement Comparison
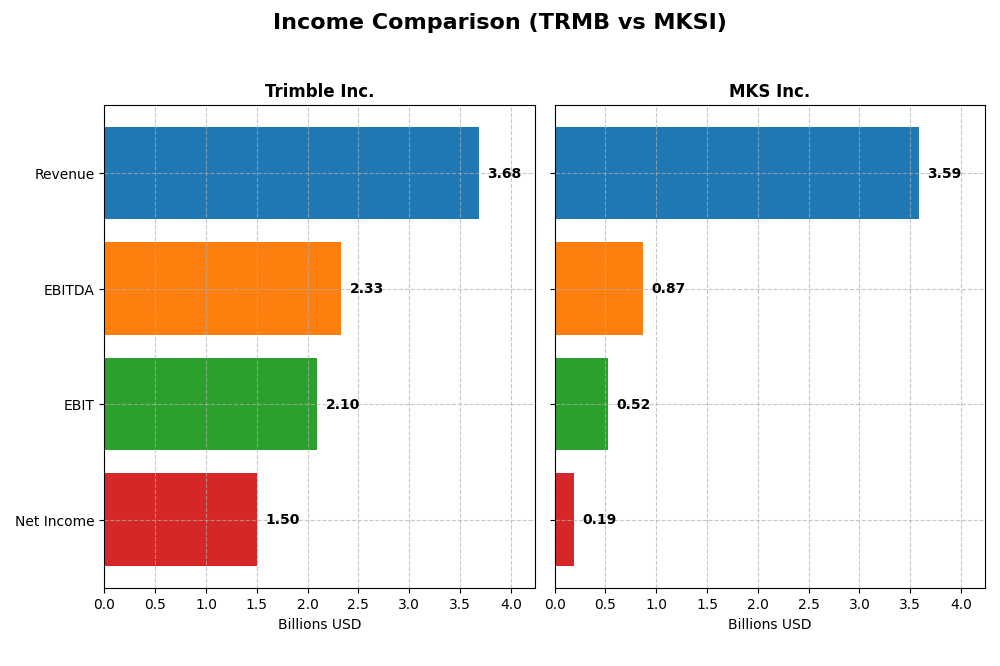
This table compares key income statement metrics for Trimble Inc. and MKS Inc. based on their most recent fiscal year data.
| Metric | Trimble Inc. (TRMB) | MKS Inc. (MKSI) |
|---|---|---|
| Market Cap | 18.9B | 12.6B |
| Revenue | 3.68B | 3.59B |
| EBITDA | 2.33B | 870M |
| EBIT | 2.10B | 522M |
| Net Income | 1.50B | 190M |
| EPS | 6.13 | 2.82 |
| Fiscal Year | 2024 | 2024 |
Income Statement Interpretations
Trimble Inc.
Trimble’s revenue showed a 17.02% increase over the 2020-2024 period, though it declined by 3.04% in the most recent year. Net income surged overall by 285.84%, with a strong rebound of 398.4% last year. Margins remained robust, with gross margin at 65.06% and net margin improving significantly, reflecting enhanced profitability despite the recent revenue dip.
MKS Inc.
MKS posted a 53.91% revenue growth over the five years but experienced a slight 0.99% decline in 2024. Net income and margins faced challenges, declining by 45.71% and 64.73% respectively over the period, though recent improvements are noted with net margin growth of 110.42% last year. Gross margin stands at 47.63%, indicating moderate profitability with some volatility.
Which one has the stronger fundamentals?
Trimble’s income statement reveals stronger fundamentals with higher and improving margins, especially net and EBIT margins, alongside consistent net income growth. MKS shows notable revenue growth but struggles with net income and margin contraction over the longer term, despite recent margin recovery. Overall, Trimble exhibits more favorable and stable income metrics.
Financial Ratios Comparison
The table below presents a side-by-side comparison of key financial ratios for Trimble Inc. (TRMB) and MKS Inc. (MKSI) based on their most recent fiscal year data.
| Ratios | Trimble Inc. (2024) | MKS Inc. (2024) |
|---|---|---|
| ROE | 26.18% | 8.18% |
| ROIC | 4.49% | 6.31% |
| P/E | 11.52 | 36.98 |
| P/B | 3.02 | 3.03 |
| Current Ratio | 1.27 | 3.19 |
| Quick Ratio | 1.16 | 2.04 |
| D/E (Debt-to-Equity) | 0.26 | 2.06 |
| Debt-to-Assets | 15.96% | 55.65% |
| Interest Coverage | 5.08 | 1.44 |
| Asset Turnover | 0.39 | 0.42 |
| Fixed Asset Turnover | 11.81 | 3.55 |
| Payout Ratio | 0 | 31.05% |
| Dividend Yield | 0% | 0.84% |
Interpretation of the Ratios
Trimble Inc.
Trimble shows a generally favorable financial profile with strong net margin at 40.84% and return on equity at 26.18%. However, its return on invested capital of 4.49% and weighted average cost of capital at 10.81% are less encouraging. The company maintains a low debt ratio and good interest coverage, but its asset turnover is weak. Trimble does not pay dividends, likely focusing on reinvestment and growth.
MKS Inc.
MKS presents a mixed picture with a modest net margin of 5.3% and low return on equity at 8.18%, alongside a high debt-to-equity ratio of 2.06 and poor interest coverage of 1.51. Its current ratio is strong but considered unfavorable due to excess liquidity. MKS pays a dividend yielding 0.84%, but payout sustainability is questionable given the weak profitability and high leverage.
Which one has the best ratios?
Trimble holds the advantage with a higher proportion of favorable ratios, especially profitability and leverage metrics, despite some weaknesses in invested capital returns and asset efficiency. MKS’s financials are burdened by high debt, lower profitability, and weaker coverage ratios, resulting in an overall unfavorable evaluation compared to Trimble’s more balanced profile.
Strategic Positioning
This section compares the strategic positioning of Trimble Inc. and MKS Inc. including Market position, Key segments, and exposure to disruption:
Trimble Inc.
- Large market cap of 18.9B; faces competitive pressure in technology hardware and equipment sectors.
- Diversified across Buildings, Geospatial, Resources, and Transportation segments driving revenues.
- Exposure to disruption via software integration and autonomous systems in precision agriculture.
MKS Inc.
- Market cap of 12.6B; operates under competitive pressure in hardware and equipment industry.
- Concentrated in Vacuum & Analysis, Light & Motion, and Equipment & Solutions segments serving niche markets.
- Technological disruption risk linked to evolving laser, photonics, and vacuum control technologies.
Trimble Inc. vs MKS Inc. Positioning
Trimble shows a diversified approach across multiple industrial segments, providing broad market exposure. MKS focuses on specialized process control and photonics, offering depth but less diversification. Each approach carries distinct operational scopes and market risks.
Which has the best competitive advantage?
Both companies have very unfavorable MOAT evaluations with declining ROIC trends below WACC, indicating value destruction and weak sustainable competitive advantages in their current strategic positions.
Stock Comparison
The stock price movements of Trimble Inc. and MKS Inc. over the past 12 months reveal significant gains with contrasting recent trends in market activity and price momentum.

Trend Analysis
Trimble Inc. showed a bullish trend over the past year with a 29.0% price increase, marked by deceleration and moderate volatility (9.79 std deviation). The stock traded between 50.86 and 85.24, with recent weeks displaying a neutral trend (-0.58% change).
MKS Inc. exhibited a stronger bullish trend with a 56.56% gain and accelerating momentum. Volatility was higher at 24.24 std deviation, with prices ranging from 60.29 to 187.92. Recently, the stock surged 30.77%, supported by strong buyer dominance.
Comparing both, MKS Inc. outperformed Trimble Inc. in market performance over the past 12 months, driven by higher price appreciation and increasing buyer activity.
Target Prices
Analysts present a positive target consensus for both Trimble Inc. and MKS Inc., suggesting potential upside.
| Company | Target High | Target Low | Consensus |
|---|---|---|---|
| Trimble Inc. | 102 | 94 | 98.2 |
| MKS Inc. | 215 | 136 | 176.17 |
The target consensus for Trimble Inc. is significantly above its current price of $79.36, indicating expected growth. Similarly, MKS Inc.’s target consensus at $176.17 also exceeds its current price of $187.79, suggesting mixed near-term expectations.
Analyst Opinions Comparison
This section compares analysts’ ratings and grades for Trimble Inc. (TRMB) and MKS Inc. (MKSI):
Rating Comparison
TRMB Rating
- Rating: B-, rated Very Favorable
- Discounted Cash Flow Score: 3, status Moderate
- ROE Score: 3, status Moderate
- ROA Score: 3, status Moderate
- Debt To Equity Score: 2, status Moderate
- Overall Score: 2, status Moderate
MKSI Rating
- Rating: B-, rated Very Favorable
- Discounted Cash Flow Score: 3, status Moderate
- ROE Score: 3, status Moderate
- ROA Score: 3, status Moderate
- Debt To Equity Score: 1, status Very Unfavorable
- Overall Score: 2, status Moderate
Which one is the best rated?
Both TRMB and MKSI share the same overall rating of B- with moderate scores in DCF, ROE, ROA, and overall assessment. TRMB has a stronger Debt to Equity score than MKSI, which is rated very unfavorable.
Scores Comparison
Here is a comparison of the Altman Z-Score and Piotroski Score for Trimble Inc. and MKS Inc.:
Trimble Inc. Scores
- Altman Z-Score: 4.56, indicating a safe zone with low bankruptcy risk.
- Piotroski Score: 6, representing average financial strength.
MKS Inc. Scores
- Altman Z-Score: 2.22, indicating a grey zone with moderate bankruptcy risk.
- Piotroski Score: 7, representing strong financial strength.
Which company has the best scores?
Trimble Inc. shows a stronger Altman Z-Score in the safe zone, while MKS Inc. has a higher Piotroski Score indicating stronger financial health. Each company leads in one score based on the provided data.
Grades Comparison
Here is an overview of the recent grades assigned to Trimble Inc. and MKS Inc. by major financial institutions:
Trimble Inc. Grades
The following table summarizes key grades given to Trimble Inc. by reputable grading companies:
| Grading Company | Action | New Grade | Date |
|---|---|---|---|
| Barclays | Maintain | Overweight | 2026-01-12 |
| Keybanc | Upgrade | Overweight | 2025-12-16 |
| Piper Sandler | Maintain | Overweight | 2025-11-07 |
| JP Morgan | Maintain | Overweight | 2025-09-19 |
| JP Morgan | Maintain | Overweight | 2025-08-07 |
| Oppenheimer | Maintain | Outperform | 2025-08-07 |
| Raymond James | Maintain | Outperform | 2025-08-07 |
| Oppenheimer | Maintain | Outperform | 2025-07-17 |
| JP Morgan | Maintain | Overweight | 2025-07-10 |
| JP Morgan | Maintain | Overweight | 2025-05-14 |
Trimble Inc. consistently holds “Overweight” and “Outperform” grades, indicating a positive outlook from several well-known financial institutions.
MKS Inc. Grades
The table below shows recent grades for MKS Inc. from established grading firms:
| Grading Company | Action | New Grade | Date |
|---|---|---|---|
| B of A Securities | Maintain | Buy | 2026-01-13 |
| Needham | Maintain | Buy | 2026-01-13 |
| Mizuho | Maintain | Outperform | 2025-12-17 |
| Citigroup | Maintain | Buy | 2025-11-12 |
| Wells Fargo | Maintain | Equal Weight | 2025-11-07 |
| Keybanc | Maintain | Overweight | 2025-11-07 |
| Benchmark | Maintain | Buy | 2025-11-07 |
| Needham | Maintain | Buy | 2025-11-06 |
| Mizuho | Maintain | Outperform | 2025-10-16 |
| Needham | Maintain | Buy | 2025-10-13 |
MKS Inc. holds mostly “Buy” and “Outperform” ratings, with one “Equal Weight” and one “Overweight” grade, reflecting a generally favorable assessment.
Which company has the best grades?
Both Trimble Inc. and MKS Inc. have received predominantly positive grades, but MKS Inc. shows a higher concentration of “Buy” ratings compared to Trimble’s “Overweight” and “Outperform” grades. This may suggest slightly stronger market confidence in MKS Inc., potentially impacting investor sentiment and portfolio decisions.
Strengths and Weaknesses
Below is a comparison of key strengths and weaknesses for Trimble Inc. (TRMB) and MKS Inc. (MKSI) based on the most recent data available in 2026.
| Criterion | Trimble Inc. (TRMB) | MKS Inc. (MKSI) |
|---|---|---|
| Diversification | Broad product and service portfolio across Buildings, Geospatial, Resources, Transportation | Focused on vacuum, photonics, and analytical solutions; less diversified |
| Profitability | High net margin (40.8%), strong ROE (26.2%) but ROIC below WACC (4.5% vs 10.8%) | Moderate net margin (5.3%), low ROE (8.2%), ROIC below WACC (6.3% vs 11.0%) |
| Innovation | Strong innovation in advanced devices and construction tech segments | Specialized innovation in photonics and vacuum technologies |
| Global presence | Extensive global reach in infrastructure and geospatial markets | More niche global presence focused on advanced manufacturing sectors |
| Market Share | Significant in multiple segments, leveraging services growth | Solid in vacuum and photonics markets but smaller overall share |
Key takeaways: Trimble demonstrates stronger profitability and diversification, though it struggles with capital efficiency (ROIC below WACC). MKS has a narrower focus and weaker financial metrics overall, with both showing declining ROIC trends, indicating caution for investors prioritizing value creation and profitability sustainability.
Risk Analysis
Below is a comparative risk overview for Trimble Inc. (TRMB) and MKS Inc. (MKSI) based on the most recent data from 2024.
| Metric | Trimble Inc. (TRMB) | MKS Inc. (MKSI) |
|---|---|---|
| Market Risk | Beta 1.59 – moderate volatility | Beta 1.92 – higher volatility |
| Debt level | Low debt-to-equity 0.26 – favorable | High debt-to-equity 2.06 – unfavorable |
| Regulatory Risk | Moderate, US tech sector | Moderate, US tech and industrial markets |
| Operational Risk | Moderate, diversified segments | Moderate, reliance on semiconductor & industrial sectors |
| Environmental Risk | Moderate, agriculture & infrastructure exposure | Moderate, manufacturing and semiconductor exposure |
| Geopolitical Risk | Moderate, global supply chain exposure | Moderate, global semiconductor supply chain exposure |
The most impactful risks lie in MKS Inc.’s high debt level and increased market volatility, raising financial stability concerns. Trimble’s risks are more balanced, with moderate market risk and lower leverage. Investors should watch MKS’s debt management closely and consider Trimble’s steadier operational footprint.
Which Stock to Choose?
Trimble Inc. (TRMB) shows a generally favorable income evolution with strong profitability, including a 40.84% net margin and a 26.18% ROE, supported by moderate debt levels and a very favorable overall rating. However, its ROIC is below WACC, indicating value destruction.
MKS Inc. (MKSI) presents mixed financials with a modest 5.3% net margin and an 8.18% ROE, higher debt ratios, and a less favorable overall rating. Despite a bullish stock trend and strong Piotroski score, it also suffers from declining ROIC below WACC, signaling value shedding.
Investors focused on financial strength and profitability might find TRMB’s favorable income statement and ratings appealing, while those tolerant of higher volatility and growth potential could see MKSI’s accelerating price trend as attractive despite its financial challenges.
Disclaimer: Investment carries a risk of loss of initial capital. The past performance is not a reliable indicator of future results. Be sure to understand risks before making an investment decision.
Go Further
I encourage you to read the complete analyses of Trimble Inc. and MKS Inc. to enhance your investment decisions: