Home > Comparison > Technology > TDY vs MKSI
The strategic rivalry between Teledyne Technologies Incorporated and MKS Inc. shapes the hardware, equipment & parts sector’s evolution. Teledyne operates as a diversified industrial technology leader with broad aerospace and defense applications. MKS Inc. focuses on precision instruments and control solutions for semiconductor and industrial manufacturing. This analysis pits Teledyne’s integrated systems approach against MKS’s specialized process control expertise to identify the superior risk-adjusted investment opportunity for diversified portfolios.
Table of contents
Companies Overview
Teledyne Technologies and MKS Inc. shape critical hardware markets with distinct technology-driven approaches.
Teledyne Technologies Incorporated: Industrial and Aerospace Technology Leader
Teledyne Technologies dominates the industrial growth markets with precision instrumentation and digital imaging technologies. It earns revenue through diversified segments including aerospace electronics, environmental monitoring, and defense systems. In 2026, Teledyne’s strategic focus sharpened on integrating advanced sensor networks and electrochemical energy solutions to enhance aerospace and defense capabilities.
MKS Inc.: Precision Process Control Specialist
MKS Inc. specializes in process control solutions critical to semiconductor and industrial manufacturing. Its revenue stems from vacuum control, laser technologies, and photonics products tailored to semiconductor fabrication and life sciences. In 2026, MKS prioritized expanding laser-based PCB manufacturing systems and enhancing power delivery for precision manufacturing processes.
Strategic Collision: Similarities & Divergences
Both companies excel in hardware and instrumentation, yet Teledyne emphasizes broad aerospace and defense applications while MKS targets specialized process control and photonics. Their primary battleground lies in high-precision manufacturing technologies. Investors find Teledyne’s portfolio anchored in diversified industrial innovation, contrasting with MKS’s focus on niche semiconductor and laser system expertise.
Income Statement Comparison
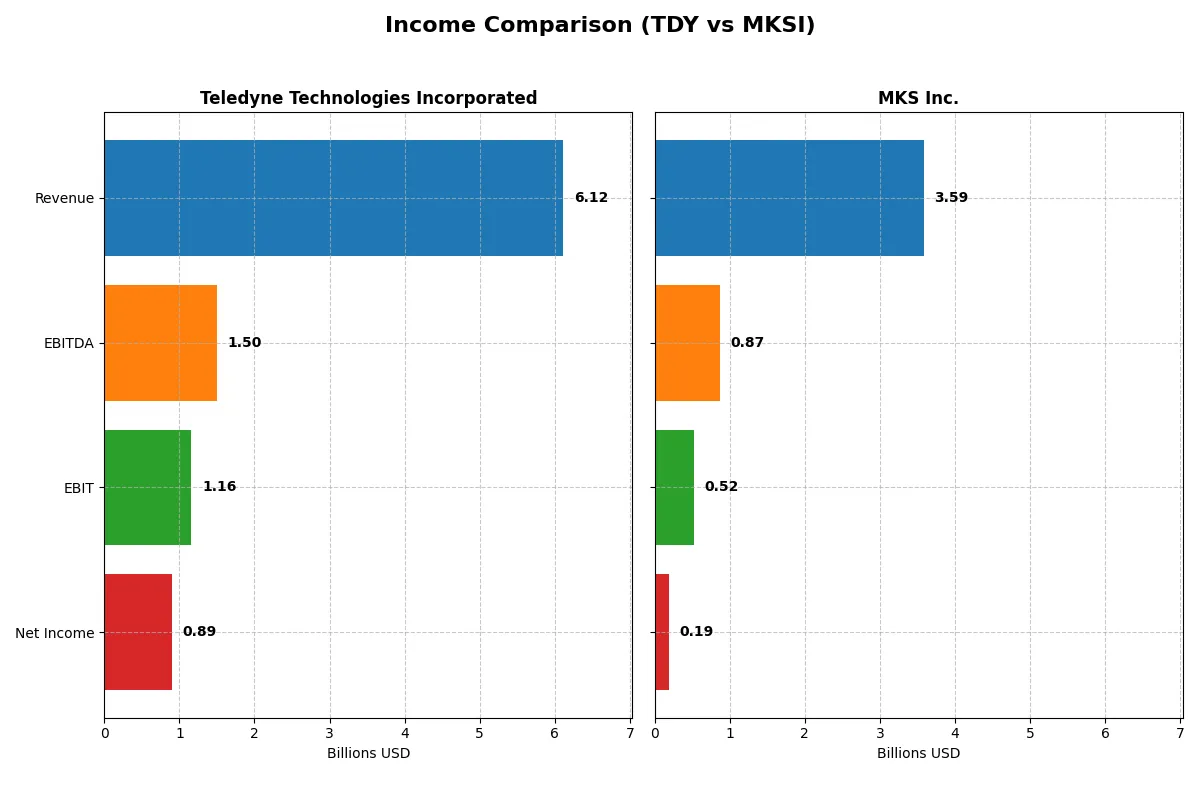
The following data dissects the core profitability and scalability of both corporate engines to reveal who dominates the bottom line:
| Metric | Teledyne Technologies Incorporated (TDY) | MKS Inc. (MKSI) |
|---|---|---|
| Revenue | 6.12B | 3.59B |
| Cost of Revenue | 3.72B | 1.88B |
| Operating Expenses | 1.25B | 1.21B |
| Gross Profit | 2.40B | 1.71B |
| EBITDA | 1.50B | 870M |
| EBIT | 1.16B | 522M |
| Interest Expense | 60M | 345M |
| Net Income | 895M | 190M |
| EPS | 18.88 | 2.82 |
| Fiscal Year | 2025 | 2024 |
Income Statement Analysis: The Bottom-Line Duel
This income statement comparison reveals how efficiently Teledyne Technologies and MKS Inc. convert sales into profits and control costs.
Teledyne Technologies Incorporated Analysis
Teledyne’s revenue grew steadily from $4.6B in 2021 to $6.1B in 2025, with net income doubling to $895M. Its gross margin remains strong near 39%, and the net margin improved to 14.6%, reflecting disciplined cost control. In 2025, EBIT expanded 16.6%, showing solid operating momentum and efficient expense management.
MKS Inc. Analysis
MKS’s revenue increased from $2.3B in 2020 to $3.6B in 2024 but dipped slightly last year. Despite a higher gross margin of 47.6%, net margin lags at 5.3%. The 2024 net income rebounded to $190M after a severe 2023 loss. EBIT surged 135%, signaling a recovery, yet persistent high interest expense at 9.6% weighs on profitability.
Margin Resilience vs. Recovery Challenges
Teledyne dominates with consistent revenue growth and expanding margins, showcasing strong operational efficiency. MKS displays volatility, recovering from a deep loss but still burdened by high interest costs and weaker net margins. Investors seeking stability and margin strength may find Teledyne’s profile more attractive, while MKS poses higher risk amid its turnaround efforts.
Financial Ratios Comparison
These vital ratios act as a diagnostic tool to expose underlying fiscal health, valuation premiums, and capital efficiency of the companies compared below:
| Ratios | Teledyne Technologies (TDY) | MKS Inc. (MKSI) |
|---|---|---|
| ROE | 8.5% | 8.2% |
| ROIC | 6.7% | 6.3% |
| P/E | 27.3 | 37.0 |
| P/B | 2.33 | 3.03 |
| Current Ratio | 1.64 | 3.19 |
| Quick Ratio | 1.08 | 2.04 |
| D/E | 0.24 | 2.06 |
| Debt-to-Assets | 16.2% | 55.6% |
| Interest Coverage | 19.3 | 1.44 |
| Asset Turnover | 0.40 | 0.42 |
| Fixed Asset Turnover | 7.29 | 3.55 |
| Payout Ratio | 0% | 31.1% |
| Dividend Yield | 0% | 0.84% |
| Fiscal Year | 2025 | 2024 |
Efficiency & Valuation Duel: The Vital Signs
Ratios act as a company’s DNA, revealing hidden risks and operational excellence that drive investor confidence and valuation.
Teledyne Technologies Incorporated
Teledyne delivers solid profitability with a favorable 14.63% net margin but an underwhelming 8.51% ROE. Its P/E of 27.35 suggests the stock is slightly expensive. The company forgoes dividends, reinvesting heavily in R&D to fuel growth, signaling a long-term value creation strategy despite moderate returns.
MKS Inc.
MKS shows weaker profitability, with a modest 5.3% net margin and an 8.18% ROE, indicating operational challenges. At a P/E of 36.98, the stock appears stretched relative to earnings. The firm pays a minimal dividend yield of 0.84%, reflecting constrained cash flow and less shareholder reward, while bearing significant debt.
Premium Valuation vs. Operational Safety
Teledyne offers a better balance of operational efficiency and financial health, with more favorable ratio outcomes than MKS. MKS’s high leverage and stretched valuation raise caution. Investors prioritizing stability and reinvestment might prefer Teledyne, while those seeking yield may find limited appeal in MKS.
Which one offers the Superior Shareholder Reward?
Teledyne Technologies (TDY) pays no dividend but generates strong free cash flow of 23.7/share in 2025, enabling robust buybacks that fuel shareholder value. MKS Inc. (MKSI) offers a modest 0.84% dividend yield with a 31% payout ratio, but its high leverage and volatile profits raise sustainability concerns. TDY’s zero payout ratio and consistent FCF coverage support aggressive buybacks, while MKSI’s dividend and weaker cash flow suggest constrained returns. I conclude TDY offers a superior total return profile for 2026 investors, balancing growth and capital returns more sustainably.
Comparative Score Analysis: The Strategic Profile
The radar chart reveals the fundamental DNA and trade-offs of Teledyne Technologies Incorporated and MKS Inc., highlighting their financial strengths and vulnerabilities:
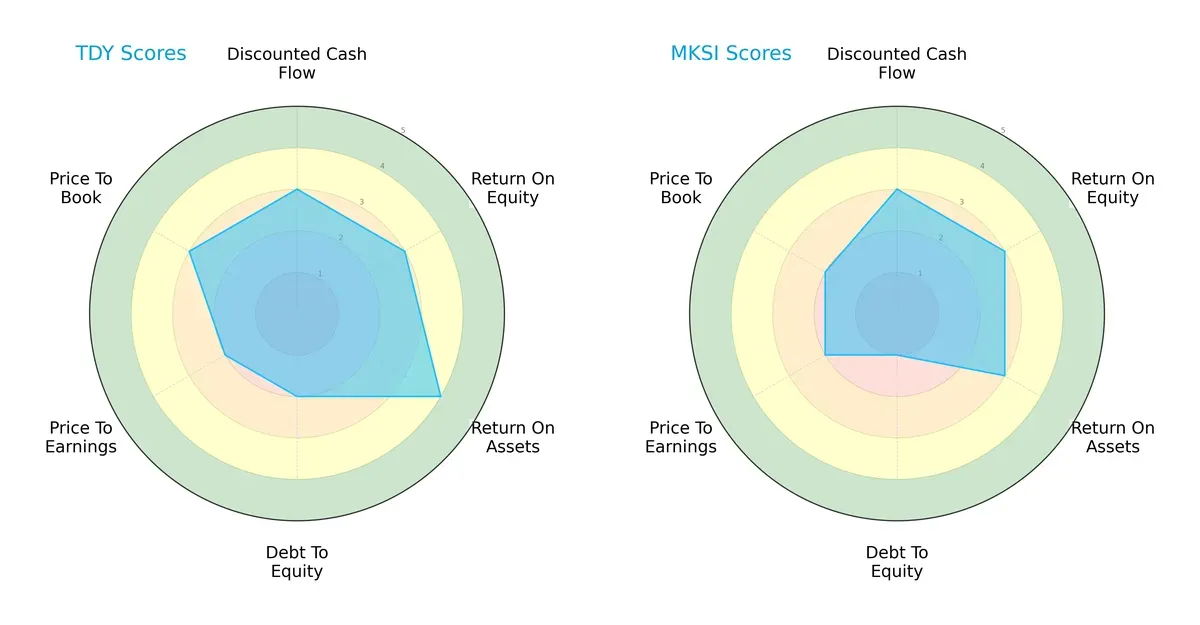
Teledyne shows a more balanced profile with moderate scores across DCF, ROE, and valuation metrics, and a favorable ROA (4). MKS matches Teledyne on DCF and ROE but scores lower on ROA (3) and suffers from a very unfavorable debt-to-equity score (1), indicating higher financial risk. Teledyne’s moderate debt management gives it an edge in stability, while MKS relies more heavily on operational efficiency.
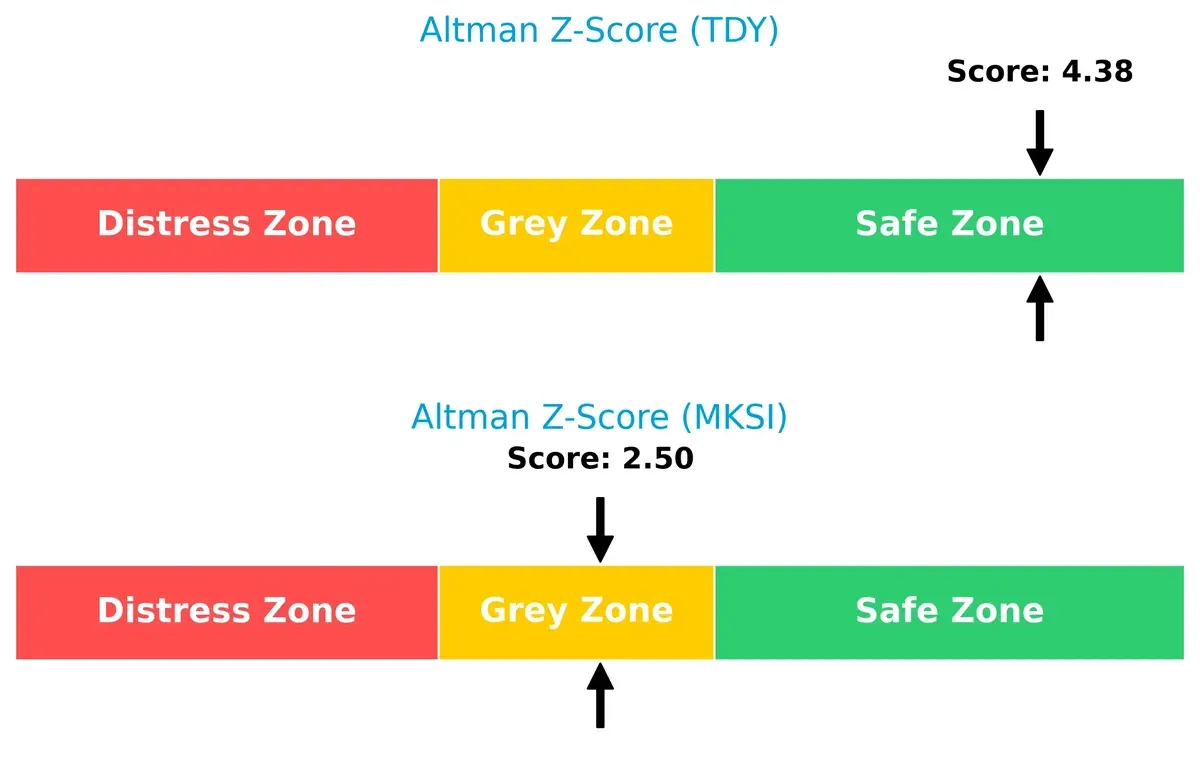
Bankruptcy Risk: Solvency Showdown
Teledyne’s Altman Z-Score of 4.38 places it firmly in the safe zone, whereas MKS’s 2.50 score sits in the grey zone, signaling moderate bankruptcy risk in this cycle:
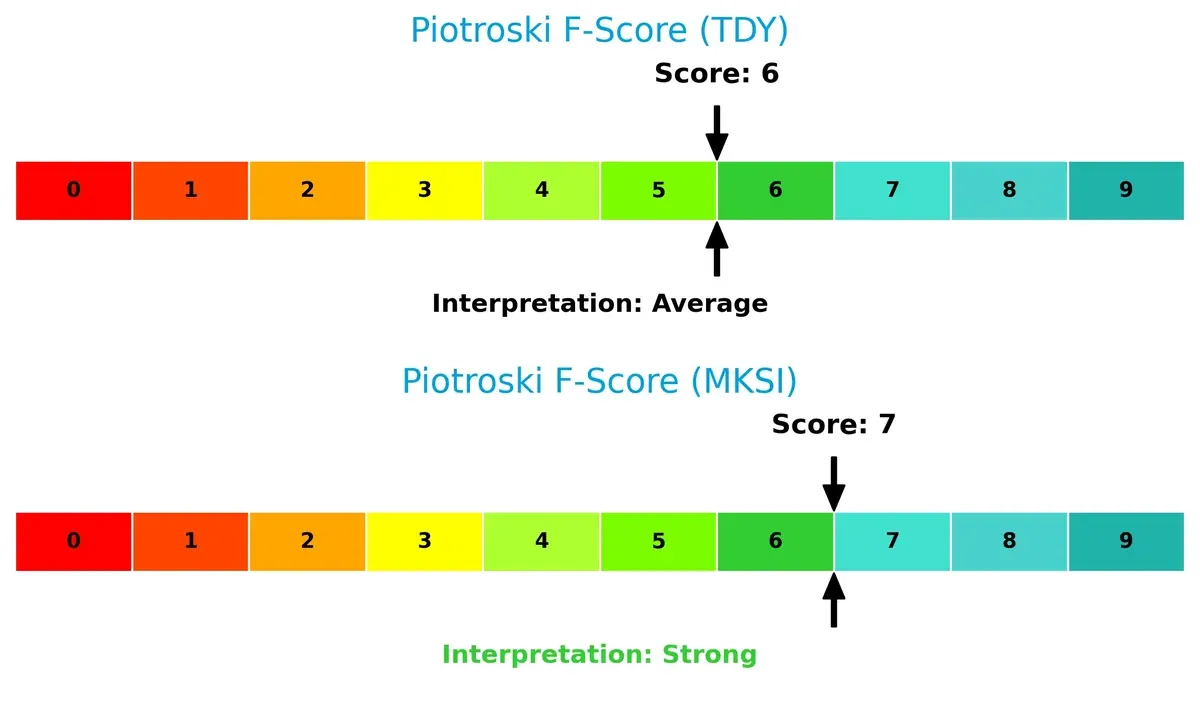
Financial Health: Quality of Operations
MKS edges ahead with a Piotroski F-Score of 7, indicating strong internal financial health. Teledyne’s 6 score is average but still solid, showing no immediate red flags:
How are the two companies positioned?
This section dissects the operational DNA of TDY and MKSI by comparing their revenue distribution and internal dynamics. The goal is to confront their economic moats and identify which model offers the most resilient competitive advantage today.
Revenue Segmentation: The Strategic Mix
This visual comparison dissects how Teledyne Technologies and MKS Inc. diversify their income streams and where their primary sector bets lie:
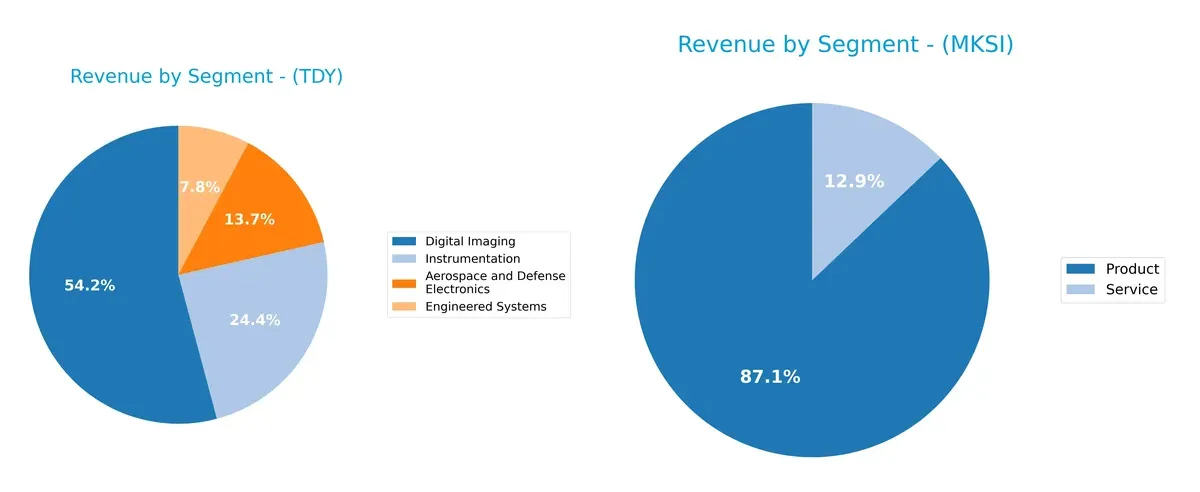
Teledyne Technologies anchors its revenue with a dominant Digital Imaging segment at $3.07B, complemented by Instrumentation at $1.38B. This mix shows a strong focus on precision technologies but also some concentration risk. MKS Inc. presents a more diversified base with Product revenue at $3.12B and Service at $462M, reflecting a balanced mix between hardware and recurring services. MKS’s approach mitigates sector volatility while Teledyne leverages ecosystem lock-in in imaging and aerospace.
Strengths and Weaknesses Comparison
This table compares the Strengths and Weaknesses of Teledyne Technologies (TDY) and MKS Inc. (MKSI):
TDY Strengths
- Diversified revenue across Aerospace, Digital Imaging, Instrumentation, Engineered Systems
- Favorable net margin of 14.63%
- Strong liquidity with current ratio 1.64 and quick ratio 1.08
- Low debt levels with debt-to-assets 16.19%
- High interest coverage at 19.47
- Global presence with significant US and Europe revenue
MKSI Strengths
- Diversified product and service segments with strong Vacuum and Photonics divisions
- Favorable quick ratio at 2.04 indicating solid short-term liquidity
- Fixed asset turnover favorable at 3.55
- Presence in key Asian markets including China, Japan, Korea
- Service revenue adds recurring component
- Dividend yield (0.84%) provides income potential
TDY Weaknesses
- Return on equity low at 8.51%, below cost of capital
- Price-to-earnings ratio elevated at 27.35
- Asset turnover weak at 0.4, signaling lower operational efficiency
- No dividend yield
- ROIC roughly equal to WACC, limiting economic profit
- Some unfavorable leverage metrics
MKSI Weaknesses
- High debt levels with debt-to-assets 55.65% and debt-to-equity 2.06
- Current ratio elevated at 3.19 but considered unfavorable, possibly indicating inefficient asset use
- Unfavorable interest coverage at 1.51, riskier debt service
- Elevated P/E at 36.98 and P/B at 3.03
- Net margin only neutral at 5.3%
- Global ratios evaluation unfavorable overall
Teledyne shows a balanced financial profile with strong profitability and controlled leverage but faces challenges in operational efficiency and equity returns. MKS exhibits broader geographic reach in Asia and service diversification but struggles with high leverage and weaker profitability metrics. These contrasts highlight differing strategic focuses and financial health profiles.
The Moat Duel: Analyzing Competitive Defensibility
A structural moat protects long-term profits from relentless competition erosion. Without it, profits vanish quickly. Let’s dissect the competitive defenses of these two tech firms:
Teledyne Technologies Incorporated: Diversified Innovation Moat
Teledyne’s advantage stems from its broad portfolio of specialized instrumentation and aerospace tech. It sustains margin stability with 18.98% EBIT and growing ROIC, signaling improving profitability in 2026. Expansion into defense and imaging deepens the moat.
MKS Inc.: Niche Process Control Moat
MKS relies on its precision vacuum and laser technologies, a narrower but deep moat. Despite higher gross margins (47.63%), its declining ROIC and rising interest costs signal shrinking competitive efficiency. Market disruption risks challenge its future moat depth.
Diversification Moat vs. Niche Specialization Moat
Teledyne’s wider moat benefits from diversified segments and improving profitability. MKS’s focused moat faces shrinking returns and higher financial risk. Teledyne stands better equipped to defend and grow market share in 2026.
Which stock offers better returns?
The past year shows marked price gains for both Teledyne Technologies and MKS Inc., with strong upward momentum and increasing trading volumes reflecting robust investor interest.
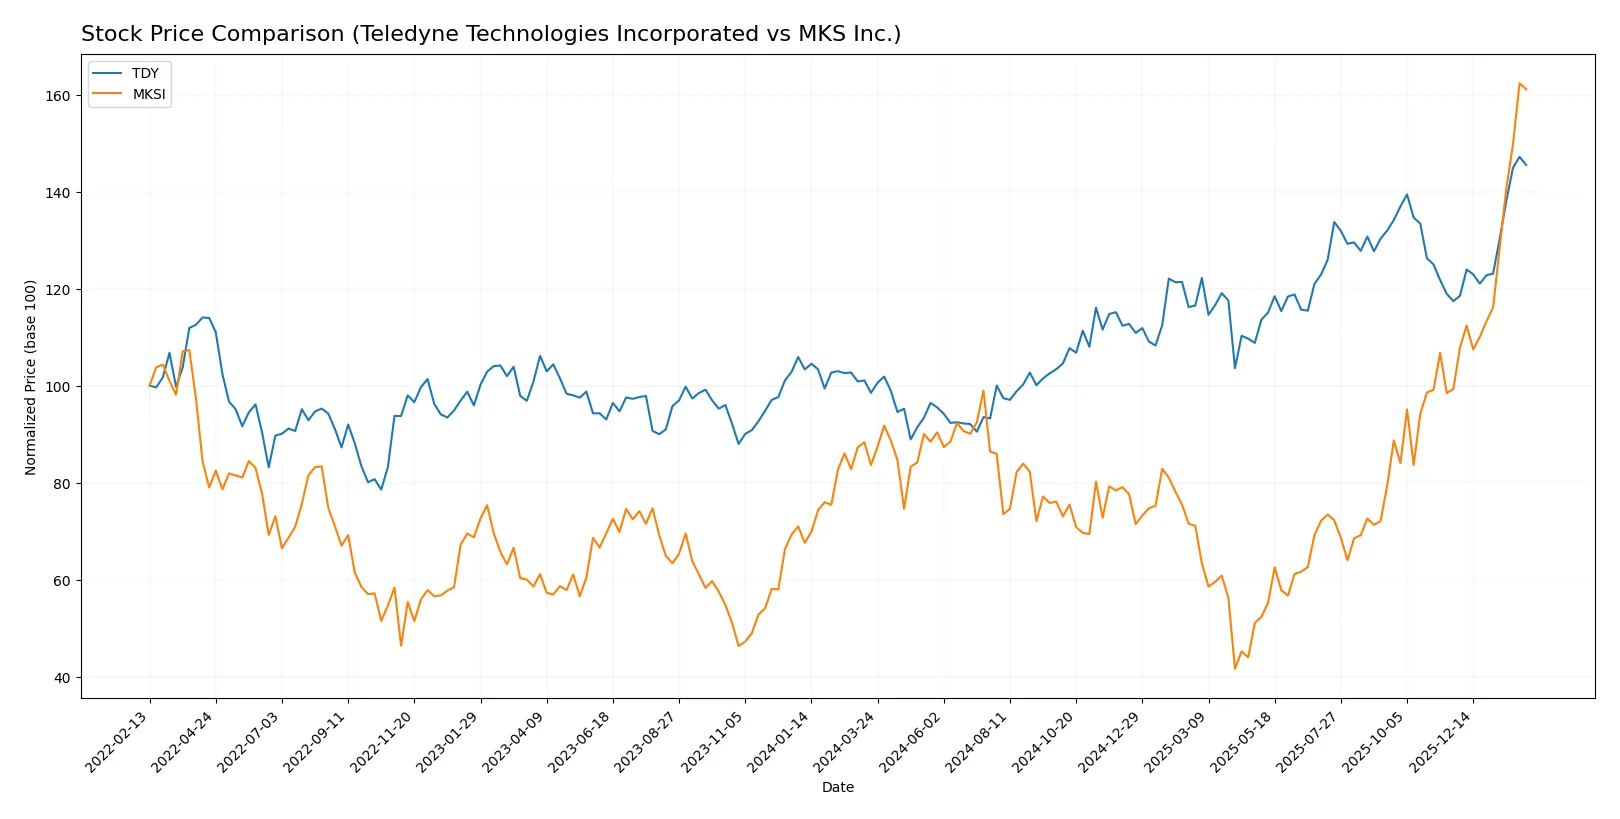
Trend Comparison
Teledyne Technologies’ stock rose 47.72% over the last 12 months, displaying a bullish trend with accelerating gains and a high volatility level (std dev 59.48). The price ranged from 375 to 620.
MKS Inc. outperformed with a 92.7% price increase over the same period, also bullish and accelerating, but with lower volatility (std dev 31.39). Its price moved between 60 and 235.
MKS Inc. delivered stronger market performance, nearly doubling in value, while Teledyne showed solid but more moderate gains. Both trends accelerated, but MKS’s rise was steeper and less volatile.
Target Prices
Analysts present a cautiously optimistic consensus for Teledyne Technologies and MKS Inc., reflecting growth potential amid sector volatility.
| Company | Target Low | Target High | Consensus |
|---|---|---|---|
| Teledyne Technologies Incorporated | 599 | 720 | 638.5 |
| MKS Inc. | 151 | 265 | 223 |
Teledyne’s consensus target of 638.5 compares closely to its current 613.23 price, suggesting moderate upside. MKS’s consensus target of 223 sits just below its current 233.57 price, indicating some near-term pressure but potential longer-term gains.

Don’t Let Luck Decide Your Entry Point
Optimize your entry points with our advanced ProRealTime indicators. You’ll get efficient buy signals with precise price targets for maximum performance. Start outperforming now!
How do institutions grade them?
Teledyne Technologies Incorporated Grades
The following table summarizes recent grades from recognized financial institutions for Teledyne Technologies Incorporated.
| Grading Company | Action | New Grade | Date |
|---|---|---|---|
| Barclays | Maintain | Equal Weight | 2026-01-22 |
| Needham | Maintain | Buy | 2026-01-22 |
| Stifel | Maintain | Buy | 2026-01-22 |
| Citigroup | Maintain | Neutral | 2026-01-13 |
| Barclays | Maintain | Equal Weight | 2026-01-12 |
| Needham | Maintain | Buy | 2025-10-23 |
| Barclays | Maintain | Equal Weight | 2025-10-23 |
| Stifel | Maintain | Buy | 2025-10-23 |
| Morgan Stanley | Maintain | Equal Weight | 2025-10-15 |
| UBS | Maintain | Buy | 2025-07-24 |
MKS Inc. Grades
Below is a summary of recent institutional grades for MKS Inc. from credible sources.
| Grading Company | Action | New Grade | Date |
|---|---|---|---|
| Morgan Stanley | Maintain | Overweight | 2026-01-22 |
| TD Cowen | Maintain | Buy | 2026-01-22 |
| Needham | Maintain | Buy | 2026-01-22 |
| Wells Fargo | Maintain | Equal Weight | 2026-01-22 |
| B of A Securities | Maintain | Buy | 2026-01-22 |
| Cantor Fitzgerald | Maintain | Overweight | 2026-01-20 |
| Keybanc | Maintain | Overweight | 2026-01-16 |
| Wells Fargo | Maintain | Equal Weight | 2026-01-15 |
| Needham | Maintain | Buy | 2026-01-13 |
| B of A Securities | Maintain | Buy | 2026-01-13 |
Which company has the best grades?
MKS Inc. generally receives more optimistic grades, including multiple Overweight and Buy ratings. Teledyne Technologies has a mix of Buy and Equal Weight grades but fewer Overweight recommendations. This divergence may influence investors seeking stronger institutional confidence.
Risks specific to each company
The following categories identify the critical pressure points and systemic threats facing both firms in the 2026 market environment:
1. Market & Competition
Teledyne Technologies Incorporated
- Operates diversified industrial and aerospace tech markets with moderate net margin (14.6%) and stable market cap ($28.8B).
MKS Inc.
- Faces higher market volatility and competitive pressure with a lower net margin (5.3%) and smaller market cap ($15.7B).
2. Capital Structure & Debt
Teledyne Technologies Incorporated
- Maintains conservative leverage with debt-to-equity of 0.24 and strong interest coverage (19.5x).
MKS Inc.
- Exhibits high leverage with debt-to-equity of 2.06 and weak interest coverage (1.5x), raising financial risk.
3. Stock Volatility
Teledyne Technologies Incorporated
- Beta near 1.01 indicates average market volatility, suggesting moderate risk exposure.
MKS Inc.
- Beta at 1.94 reflects nearly double the market volatility, indicating elevated price swings.
4. Regulatory & Legal
Teledyne Technologies Incorporated
- Operates in regulated aerospace and defense sectors that require strict compliance but benefit from government contracts.
MKS Inc.
- Faces regulatory scrutiny in semiconductor and photonics industries, with rapid tech shifts increasing compliance complexity.
5. Supply Chain & Operations
Teledyne Technologies Incorporated
- Global operations with diversified supply chains reduce disruption risk but require complex management.
MKS Inc.
- Supply chain concentrated in semiconductor manufacturing, vulnerable to component shortages and geopolitical trade tensions.
6. ESG & Climate Transition
Teledyne Technologies Incorporated
- Moderate ESG risks with industrial focus; room to improve sustainability in energy and defense segments.
MKS Inc.
- Increasing pressure to meet ESG standards in semiconductor production, including energy use and waste management.
7. Geopolitical Exposure
Teledyne Technologies Incorporated
- Exposure across US, Europe, and Asia with some defense-related geopolitical risk but diversified footprint.
MKS Inc.
- Heavily reliant on global semiconductor supply chains, vulnerable to US-China tech tensions and export controls.
Which company shows a better risk-adjusted profile?
Teledyne’s strongest risk factor is market competition balanced by solid financial health and lower leverage. MKS’s critical risk is its high debt load coupled with significant stock volatility. Teledyne’s Altman Z-Score (4.38, safe zone) and moderate Piotroski score (6) highlight financial resilience. MKS’s Z-Score (2.5, grey zone) signals moderate distress risk despite a stronger Piotroski score (7). The debt-to-equity ratio disparity (0.24 vs. 2.06) underlines Teledyne’s superior risk-adjusted profile. Recently, MKS’s weak interest coverage (1.5x) justifies caution against rising rates and tighter credit conditions.
Final Verdict: Which stock to choose?
Teledyne Technologies (TDY) stands out for its robust operational efficiency and consistent free cash flow generation, reflecting a disciplined capital allocation strategy. Its point of vigilance lies in a return on invested capital that trails its cost of capital, suggesting caution on long-term value creation. TDY suits portfolios seeking steady industrial exposure with moderate growth.
MKS Inc. (MKSI) leverages a niche strategic moat with its high-margin product lines and recurring revenue streams, underpinning its recent explosive price momentum. However, its elevated leverage and declining profitability raise flags on financial stability, making it a riskier yet potentially rewarding choice. MKSI appeals to growth-oriented investors with a tolerance for volatility.
If you prioritize resilient cash flow and operational discipline, TDY is the compelling choice due to its more favorable balance sheet and stable earnings trajectory. However, if you seek aggressive growth amplified by market momentum and can withstand financial risk, MKSI offers superior upside potential despite its weaker moat and leverage concerns. Both represent distinct analytical scenarios catering to different investor profiles.
Disclaimer: Investment carries a risk of loss of initial capital. The past performance is not a reliable indicator of future results. Be sure to understand risks before making an investment decision.
Go Further
I encourage you to read the complete analyses of Teledyne Technologies Incorporated and MKS Inc. to enhance your investment decisions: