Home > Comparison > Technology > TEL vs MKSI
The strategic rivalry between TE Connectivity Ltd. and MKS Inc. defines the current trajectory of the Technology sector’s hardware and equipment industry. TE Connectivity operates as a global industrial powerhouse with diversified connectivity and sensor solutions. In contrast, MKS Inc. specializes in high-precision instruments and subsystems serving semiconductor and industrial markets. This analysis explores which firm’s operational model delivers superior risk-adjusted returns for a well-balanced portfolio amid evolving market dynamics.
Table of contents
Companies Overview
TE Connectivity and MKS Inc. hold prominent roles in the hardware and equipment sector, driving innovation in industrial technology.
TE Connectivity Ltd.: Global Connectivity Solutions Leader
TE Connectivity stands as a global leader in connectivity and sensor solutions. Its revenue derives from diversified segments—Transportation, Industrial, and Communications Solutions—serving automotive, aerospace, medical, and data markets. In 2026, the company focuses on expanding its sensor technology and strengthening direct sales channels across 140 countries, leveraging its broad industrial footprint.
MKS Inc.: Precision Process Control Innovator
MKS Inc. specializes in advanced instruments and systems that control and measure manufacturing processes. Its Vacuum & Analysis, Light & Motion, and Equipment & Solutions segments cater to semiconductor, industrial, and life sciences markets. The firm emphasizes laser-based systems and integrated control technologies, aiming to enhance precision manufacturing and expand its direct and distributor sales networks.
Strategic Collision: Similarities & Divergences
Both companies excel in hardware and equipment but pursue different value propositions. TE Connectivity focuses on connectivity components and sensor integration, while MKS drives precision process control and laser technologies. They compete primarily in industrial technology applications, yet TE Connectivity’s broad market presence contrasts with MKS’s niche specialization. Their investment profiles diverge between diversified industrial exposure and targeted technology innovation.
Income Statement Comparison
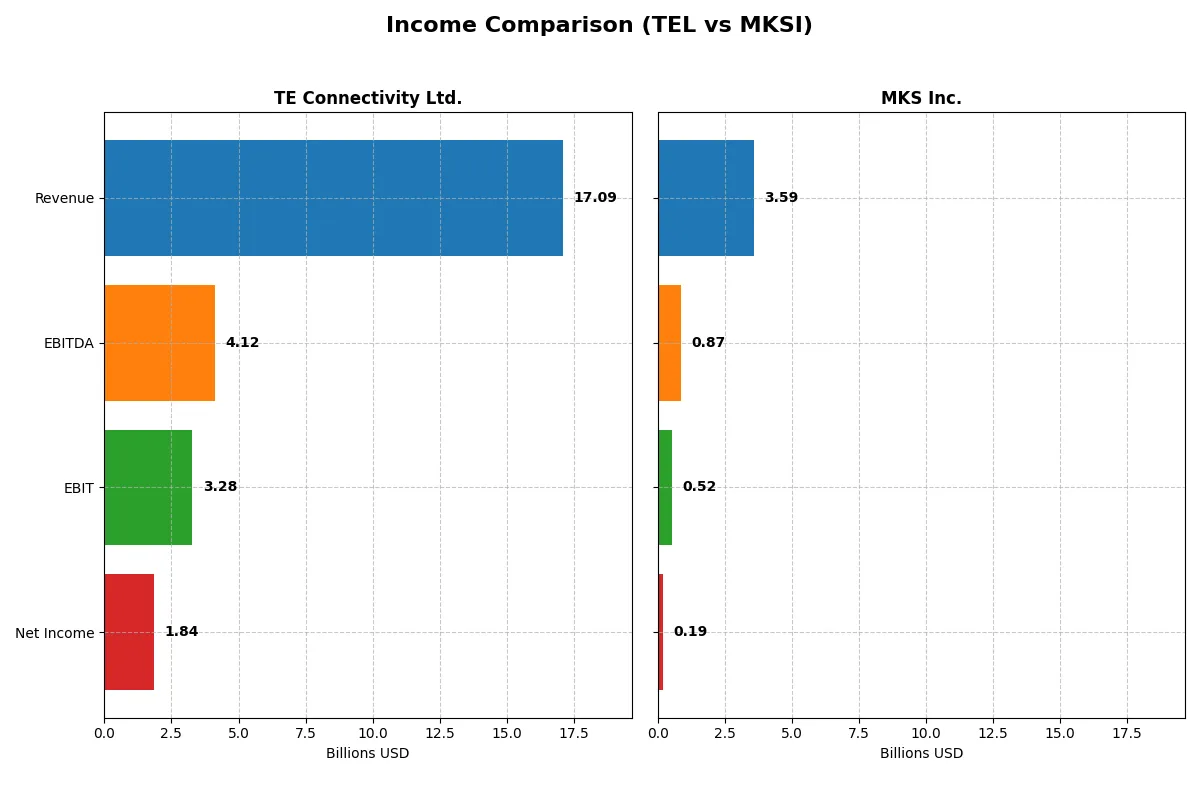
This data dissects the core profitability and scalability of both corporate engines to reveal who dominates the bottom line:
| Metric | TE Connectivity Ltd. (TEL) | MKS Inc. (MKSI) |
|---|---|---|
| Revenue | 17.1B | 3.59B |
| Cost of Revenue | 11.2B | 1.88B |
| Operating Expenses | 2.70B | 1.21B |
| Gross Profit | 5.91B | 1.71B |
| EBITDA | 4.12B | 870M |
| EBIT | 3.28B | 522M |
| Interest Expense | 77M | 345M |
| Net Income | 1.84B | 190M |
| EPS | 6.20 | 2.82 |
| Fiscal Year | 2025 | 2024 |
Income Statement Analysis: The Bottom-Line Duel
This income statement comparison reveals the true efficiency and profitability dynamics of two distinct corporate engines over recent years.
TE Connectivity Ltd. Analysis
TE Connectivity’s revenue climbed steadily to 17.1B in 2025, boosting gross profit to 5.9B with a strong 34.6% gross margin. Despite a 10.8% net margin slip in 2025, its EBIT margin improved to 19.2%, reflecting operational efficiency. However, net income dropped sharply year-over-year, indicating margin pressure despite top-line growth.
MKS Inc. Analysis
MKS’s revenue plateaued near 3.6B in 2024, with a robust 47.6% gross margin signaling tight cost control. EBIT margin rose impressively to 14.6%, driven by a strong 135% EBIT growth. Net margin doubled to 5.3%, reflecting a sharp rebound from prior losses. Yet, overall net income remains modest at 190M, showing ongoing profitability challenges.
Margin Strength vs. Profit Scale
TE Connectivity dominates in scale and operating profitability with higher absolute earnings and margins. MKS exhibits impressive margin recovery and efficiency gains but struggles to convert scale into substantial net income. For investors, TE Connectivity’s larger profit base offers a safer income profile, while MKS’s turnaround potential entails higher risk and reward dynamics.
Financial Ratios Comparison
These vital ratios act as a diagnostic tool to expose the underlying fiscal health, valuation premiums, and capital efficiency of the companies compared below:
| Ratios | TE Connectivity Ltd. (TEL) | MKS Inc. (MKSI) |
|---|---|---|
| ROE | 14.64% | 8.18% |
| ROIC | 8.82% | 6.31% |
| P/E | 35.0x | 37.0x |
| P/B | 5.12x | 3.03x |
| Current Ratio | 1.56 | 3.19 |
| Quick Ratio | 1.03 | 2.04 |
| D/E | 0.52 | 2.06 |
| Debt-to-Assets | 26.1% | 55.6% |
| Interest Coverage | 41.7x | 1.44x |
| Asset Turnover | 0.68 | 0.42 |
| Fixed Asset Turnover | 3.96 | 3.55 |
| Payout ratio | 43.6% | 31.1% |
| Dividend yield | 1.25% | 0.84% |
| Fiscal Year | 2025 | 2024 |
Efficiency & Valuation Duel: The Vital Signs
Financial ratios form a company’s DNA, exposing operational strengths and hidden risks vital for investment decisions.
TE Connectivity Ltd.
TE Connectivity delivers solid profitability with a 14.6% ROE and a favorable 10.8% net margin. However, its valuation is stretched, sporting a high P/E of 35 and a P/B of 5.12. The company balances this with a modest 1.25% dividend yield, signaling steady shareholder returns amid reinvestment in R&D.
MKS Inc.
MKS Inc. posts a lower 8.2% ROE and a moderate 5.3% net margin, reflecting subdued profitability. Its valuation is also elevated, with a P/E near 37 and P/B of 3.03, while the company struggles with debt and weak interest coverage. The 0.84% dividend yield is low, underscoring limited cash return to investors.
Premium Valuation vs. Operational Safety
TE Connectivity offers a better balance of operational efficiency and shareholder returns despite a premium valuation. MKS’s weaker profitability and financial health present higher risk. Investors prioritizing financial stability may lean toward TE’s profile, while those seeking turnaround potential might consider MKS.
Which one offers the Superior Shareholder Reward?
I see TE Connectivity (TEL) delivers a balanced distribution with a 1.25% dividend yield and a 44% payout ratio, supported by strong free cash flow coverage (2.38x). Its steady buybacks amplify shareholder return sustainably. MKS Inc. (MKSI) offers a lower 0.84% yield and a 31% payout but leans on reinvestment amid volatile profits and heavy debt (D/E 2.06x). MKSI’s modest buybacks contrast with TEL’s consistent capital return strategy. I conclude TEL provides the superior total return profile in 2026 due to its prudent balance of dividends, buybacks, and robust cash flow sustainability.
Comparative Score Analysis: The Strategic Profile
The radar chart reveals the fundamental DNA and trade-offs of TE Connectivity Ltd. and MKS Inc., highlighting their financial strengths and vulnerabilities:
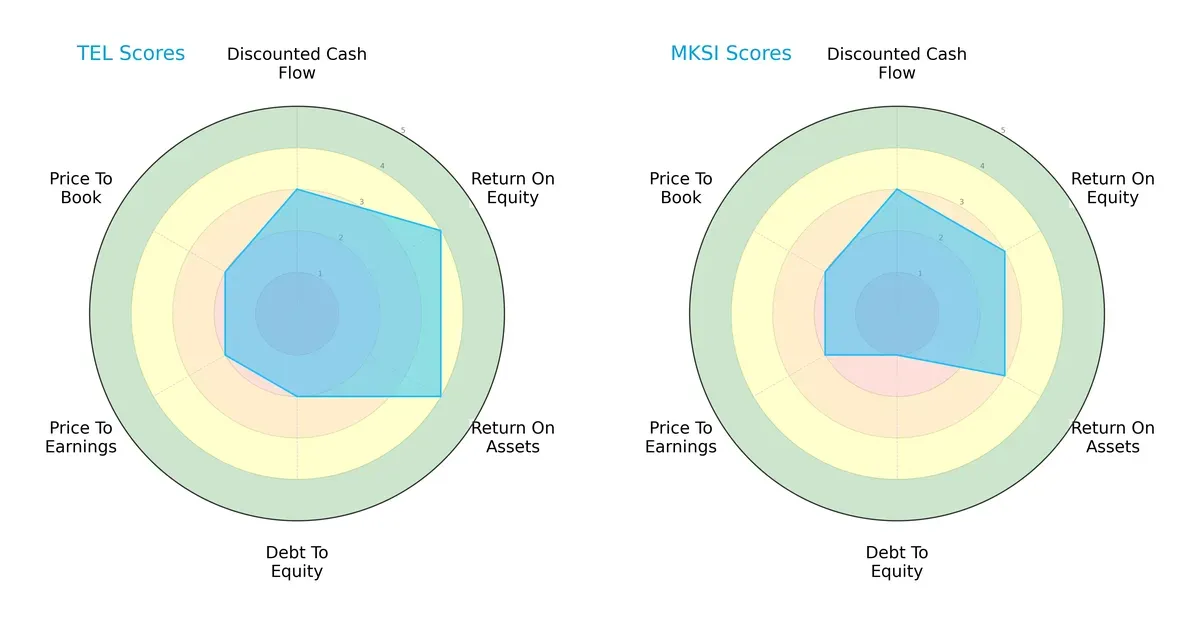
TE Connectivity Ltd. posts stronger profitability with ROE and ROA scores of 4 versus MKS’s 3. Both match on discounted cash flow at 3, signaling similar valuation expectations. However, TE manages debt more conservatively (score 2) compared to MKS’s weaker 1, reflecting better financial stability. Both firms carry moderate valuation scores (PE and PB at 2). Overall, TE Connectivity shows a more balanced profile, while MKS leans on specific operational efficiencies but with higher leverage risk.
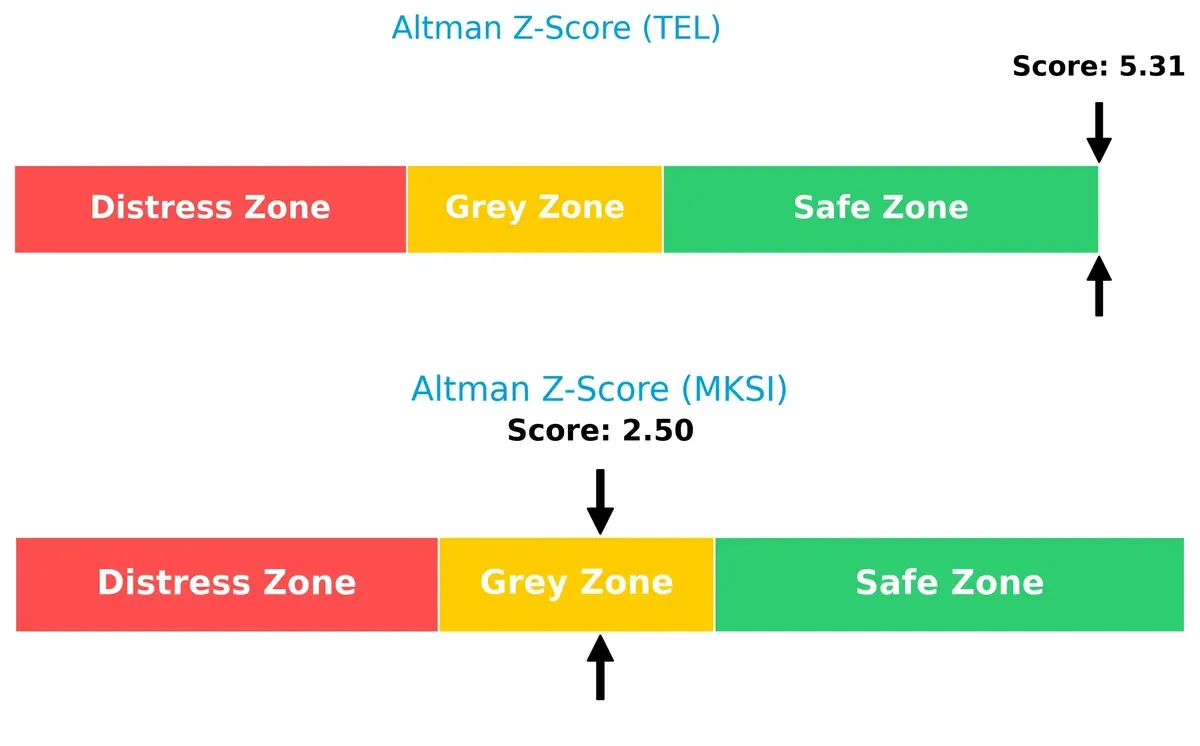
Bankruptcy Risk: Solvency Showdown
TE Connectivity’s Altman Z-Score of 5.3 versus MKS’s 2.5 signals a decisive solvency advantage for TE. TE sits firmly in the safe zone, implying strong resilience in this market cycle, while MKS’s grey zone score indicates moderate bankruptcy risk:
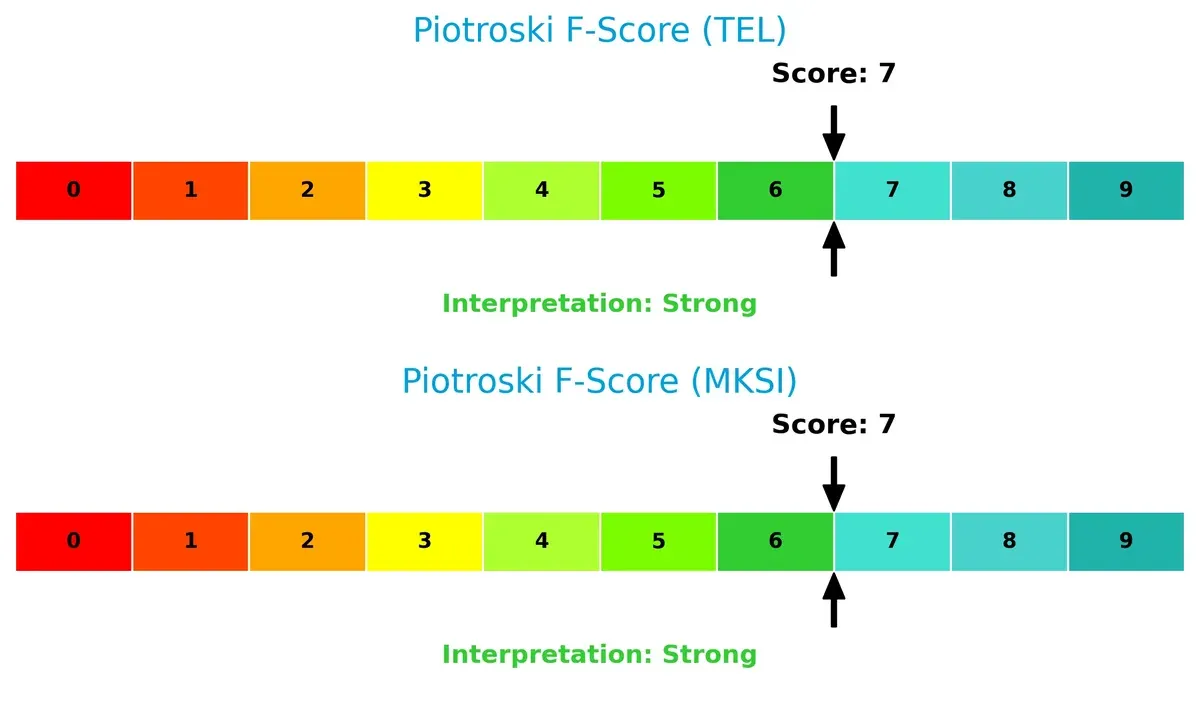
Financial Health: Quality of Operations
Both companies score a robust 7 on the Piotroski F-Score, indicating strong financial health and operational quality. Neither firm shows red flags in internal metrics, suggesting solid fundamentals across profitability, leverage, and liquidity:
How are the two companies positioned?
This section dissects TEL’s and MKSI’s operational DNA by comparing their revenue distribution and internal dynamics. The goal is to confront their economic moats to identify which model offers the most durable competitive advantage today.
Revenue Segmentation: The Strategic Mix
This visual comparison dissects how TE Connectivity Ltd. and MKS Inc. diversify their income streams and where their primary sector bets lie:
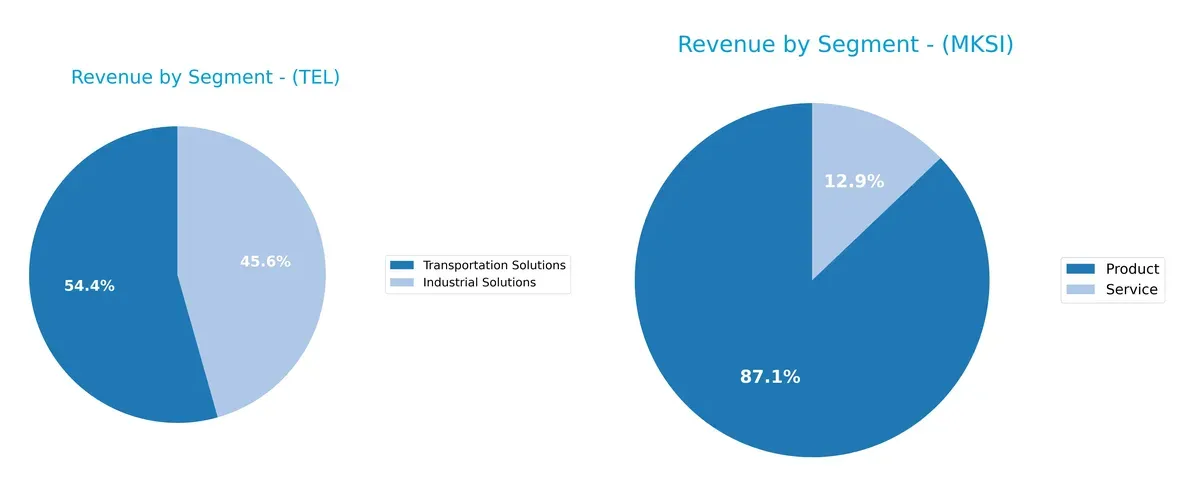
TE Connectivity leans heavily on Transportation Solutions, generating $9.4B in 2025, dwarfing its $7.9B Industrial Solutions segment. MKS Inc. shows a more balanced mix, with $3.1B from Product sales and $462M from Services in 2024. TE’s dominance in transportation signals infrastructure lock-in but risks concentration. MKS’s diversified portfolio reduces single-segment risk, appealing in volatile markets.
Strengths and Weaknesses Comparison
This table compares the Strengths and Weaknesses of TE Connectivity Ltd. (TEL) and MKS Inc. (MKSI):
TEL Strengths
- Strong profitability with a net margin of 10.78%
- Favorable liquidity ratios: current ratio 1.56 and quick ratio 1.03
- Moderate debt with favorable debt-to-assets at 26.12%
- High interest coverage ratio of 42.61
- Diversified revenue streams across Industrial and Transportation Solutions
- Global presence with significant sales in China, US, and Europe
MKSI Strengths
- Favorable quick ratio at 2.04 indicating liquid assets
- Reasonable fixed asset turnover of 3.55
- Product and service revenue segmentation shows some diversification
- Presence in key markets including US, China, Japan, and Korea
- Steady revenue from Vacuum and Photonics Solutions divisions
TEL Weaknesses
- Price-to-earnings (PE) ratio at 35.0 is unfavorable versus sector norms
- Price-to-book (PB) ratio at 5.12 signals possible overvaluation
- Neutral return on equity (ROE) at 14.64% barely covers cost of capital
- Asset turnover at 0.68 is neutral, suggesting moderate asset utilization
MKSI Weaknesses
- Weak profitability with a net margin of 5.3% and unfavorable ROE of 8.18%
- High weighted average cost of capital (WACC) at 11.45%
- High leverage with debt-to-equity ratio of 2.06 and debt-to-assets at 55.65%
- Low interest coverage ratio at 1.51, indicating potential risk servicing debt
- Unfavorable PE at 36.98 and low dividend yield of 0.84%
- Lower asset turnover at 0.42 reflecting less efficient asset use
TEL exhibits stronger profitability and financial health with diversified global revenue. MKSI faces challenges with leverage and profitability but maintains liquidity and some product diversification. These factors shape each company’s strategic positioning and risk profile.
The Moat Duel: Analyzing Competitive Defensibility
A structural moat is the sole shield defending long-term profits from relentless competition erosion. Let’s dissect how it applies to these two firms:
TE Connectivity Ltd.: Global Scale and Diversification Moat
TE Connectivity leverages its expansive global footprint and diversified product segments to maintain stable margins and a broad customer base. However, its declining ROIC warns of weakening capital efficiency in 2026. Expansion into emerging markets could be a double-edged sword, deepening reach but pressuring margins.
MKS Inc.: Specialized Technology and Innovation Moat
MKS Inc. relies on its niche in precision instruments and laser technologies, differentiating from TE’s broader hardware scale. Despite a higher gross margin, MKS faces a steep ROIC decline, signaling eroding value creation. Continued innovation in semiconductor process control offers potential to regain competitive edge.
Verdict: Scale and Diversification vs. Niche Innovation
Both firms suffer declining ROICs, signaling value destruction, but TE Connectivity’s broader global diversification provides a wider moat than MKS’s specialized focus. TE is better positioned to defend its market share amid competitive pressures in 2026.
Which stock offers better returns?
The past year shows strong price gains for both stocks, with TE Connectivity Ltd. exhibiting steady momentum and MKS Inc. accelerating sharply in recent months.
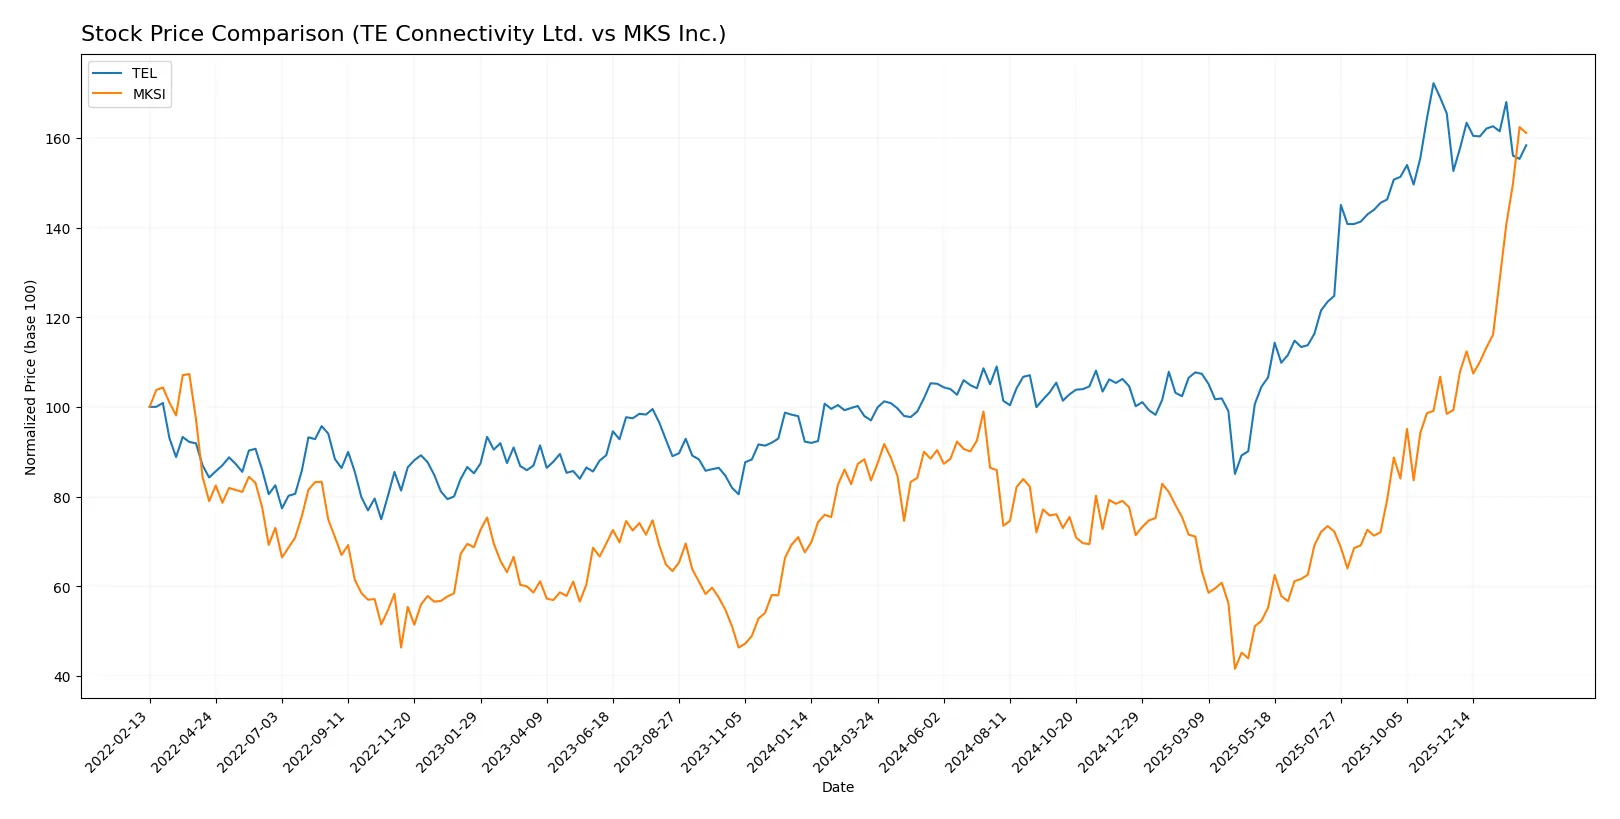
Trend Comparison
TE Connectivity Ltd. posted a 63.22% price increase over the past year, marking a bullish trend with decelerating momentum. The stock ranged between 122.0 and 247.01.
MKS Inc. gained 92.7% in the same period, showing a bullish trend with accelerating momentum. Its price fluctuated from 60.29 to 235.41.
MKS Inc. outperformed TE Connectivity Ltd. by a substantial margin, delivering the highest market return over the last year.
Target Prices
Analysts provide a clear target price range for TE Connectivity Ltd. and MKS Inc., suggesting bullish potential ahead.
| Company | Target Low | Target High | Consensus |
|---|---|---|---|
| TE Connectivity Ltd. | 238 | 306 | 270.29 |
| MKS Inc. | 151 | 265 | 223 |
TE Connectivity’s consensus target of 270.29 exceeds its current price of 227.13, implying upside potential. MKS Inc.’s consensus target of 223 sits slightly below its current price of 233.57, indicating mixed analyst sentiment.

Don’t Let Luck Decide Your Entry Point
Optimize your entry points with our advanced ProRealTime indicators. You’ll get efficient buy signals with precise price targets for maximum performance. Start outperforming now!
How do institutions grade them?
The following tables summarize recent grading actions from reputable institutions for both companies:
TE Connectivity Ltd. Grades
This table presents recent grade updates and maintenances by leading analysts for TE Connectivity Ltd.:
| Grading Company | Action | New Grade | Date |
|---|---|---|---|
| Oppenheimer | Upgrade | Outperform | 2026-01-27 |
| Barclays | Maintain | Overweight | 2026-01-23 |
| Truist Securities | Maintain | Hold | 2026-01-22 |
| Wells Fargo | Maintain | Equal Weight | 2026-01-22 |
| UBS | Maintain | Buy | 2026-01-14 |
MKS Inc. Grades
Recent analyst grades for MKS Inc. show consistent buy and overweight ratings from key firms:
| Grading Company | Action | New Grade | Date |
|---|---|---|---|
| Morgan Stanley | Maintain | Overweight | 2026-01-22 |
| TD Cowen | Maintain | Buy | 2026-01-22 |
| Needham | Maintain | Buy | 2026-01-22 |
| Wells Fargo | Maintain | Equal Weight | 2026-01-22 |
| B of A Securities | Maintain | Buy | 2026-01-22 |
Which company has the best grades?
MKS Inc. holds a stronger consensus, with multiple buy and overweight ratings maintained simultaneously. TE Connectivity shows a recent upgrade but more mixed ratings overall. Investors may interpret MKS’s consistent buy signals as higher confidence from analysts.
Risks specific to each company
The following categories identify the critical pressure points and systemic threats facing both firms in the 2026 market environment:
1. Market & Competition
TE Connectivity Ltd.
- Operates globally in diverse industrial segments, facing stiff competition in hardware and sensor markets.
MKS Inc.
- Focused on niche high-tech instruments and laser systems, competing in semiconductor and research markets with high innovation demand.
2. Capital Structure & Debt
TE Connectivity Ltd.
- Moderate debt-to-equity ratio (0.52) and strong interest coverage (42.61) reflect prudent leverage and low financial risk.
MKS Inc.
- High debt-to-equity (2.06) and weak interest coverage (1.51) signal elevated financial risk and potential strain on cash flow.
3. Stock Volatility
TE Connectivity Ltd.
- Beta at 1.235 indicates moderate stock volatility, in line with industry norms and broader market.
MKS Inc.
- Beta of 1.943 suggests high volatility, exposing investors to larger price swings and market sensitivity.
4. Regulatory & Legal
TE Connectivity Ltd.
- Global operations subject to multi-jurisdictional regulations; moderate risk with established compliance frameworks.
MKS Inc.
- Primarily US-based, facing stringent regulatory scrutiny in semiconductor and defense sectors, increasing compliance costs.
5. Supply Chain & Operations
TE Connectivity Ltd.
- Extensive global supply chain creates exposure to geopolitical disruptions but benefits from diversified sourcing.
MKS Inc.
- Specialized supply chain for advanced equipment vulnerable to component shortages and supplier concentration risks.
6. ESG & Climate Transition
TE Connectivity Ltd.
- Established ESG programs with gradual integration into product design; moderate transition risks identified.
MKS Inc.
- Emerging ESG initiatives but lagging peers; faces pressure from investors for stronger climate-related disclosures.
7. Geopolitical Exposure
TE Connectivity Ltd.
- Operations span multiple continents, facing risks from trade tensions and regional instability.
MKS Inc.
- Concentrated US footprint with exposure to export controls and defense-related geopolitical factors.
Which company shows a better risk-adjusted profile?
TE Connectivity faces diversified but manageable risks with a strong balance sheet and moderate volatility. MKS Inc. exhibits higher financial leverage and stock volatility, increasing vulnerability to market and operational shocks. The single most impactful risk for TE is its extensive global supply chain exposure, which could disrupt operations amid geopolitical tensions. For MKS, the heavy debt burden coupled with weak interest coverage poses the greatest threat to financial stability. TE’s Altman Z-score of 5.3 confirms strong solvency, while MKS’s 2.5 signals caution. Therefore, TE Connectivity shows a superior risk-adjusted profile supported by robust financial health and diversified operations.
Final Verdict: Which stock to choose?
TE Connectivity Ltd. (TEL) shines with its operational efficiency and strong cash flow generation. Its robust balance sheet and steady income margins mark it as a reliable cash machine. However, its premium valuation poses a point of vigilance. TEL suits investors seeking stable, income-oriented growth.
MKS Inc. (MKSI) builds a strategic moat around its specialized technology and recurring revenue streams. Despite higher leverage and weaker coverage ratios, it offers a compelling growth trajectory with accelerating price momentum. MKSI fits best in portfolios targeting GARP—growth at a reasonable price—with tolerance for financial risk.
If you prioritize financial stability and consistent cash generation, TEL outshines as the compelling choice due to its solid operating metrics and safer balance sheet. However, if you seek higher growth potential and can accept greater financial risk, MKSI offers superior upside with its accelerating momentum and niche market position.
Disclaimer: Investment carries a risk of loss of initial capital. The past performance is not a reliable indicator of future results. Be sure to understand risks before making an investment decision.
Go Further
I encourage you to read the complete analyses of TE Connectivity Ltd. and MKS Inc. to enhance your investment decisions: