Home > Comparison > Technology > MKSI vs SANM
The strategic rivalry between MKS Inc. and Sanmina Corporation shapes the competitive landscape of the Technology sector’s Hardware, Equipment & Parts industry. MKS Inc. stands out as a specialized provider of precision instruments and laser systems, while Sanmina operates as a large-scale integrated manufacturing solutions provider. This analysis assesses which operational model offers the superior risk-adjusted return, guiding investors toward the optimal choice for portfolio diversification in this evolving sector.
Table of contents
Companies Overview
MKS Inc. and Sanmina Corporation stand as pivotal players in the hardware and equipment sector, shaping critical manufacturing technologies.
MKS Inc.: Precision Process Control Leader
MKS Inc. dominates in process control solutions for manufacturing, supplying instruments and subsystems that measure and regulate critical parameters. Its revenue primarily stems from vacuum, power, and laser technologies tailored for semiconductor and industrial markets. In 2026, the company emphasizes expanding its laser-based systems and integrated pressure control offerings to enhance precision and customer control capabilities.
Sanmina Corporation: Integrated Manufacturing Powerhouse
Sanmina Corporation excels in end-to-end manufacturing solutions, providing product design, assembly, and supply chain services. Its core revenue drivers are component manufacturing and logistics services for sectors like defense, medical, and communications. The company focuses on scaling its cloud-based manufacturing execution software and expanding its interconnect systems to support complex client demands in 2026.
Strategic Collision: Similarities & Divergences
Both companies operate in hardware but diverge sharply in approach: MKS prioritizes specialized process control products, while Sanmina delivers broad integrated manufacturing services. Their battle lines form around serving high-tech manufacturing needs, with MKS focusing on precision instruments and Sanmina on comprehensive supply chains. This contrast defines distinct risk-reward profiles—MKS bets on technology depth, Sanmina on operational breadth.
Income Statement Comparison
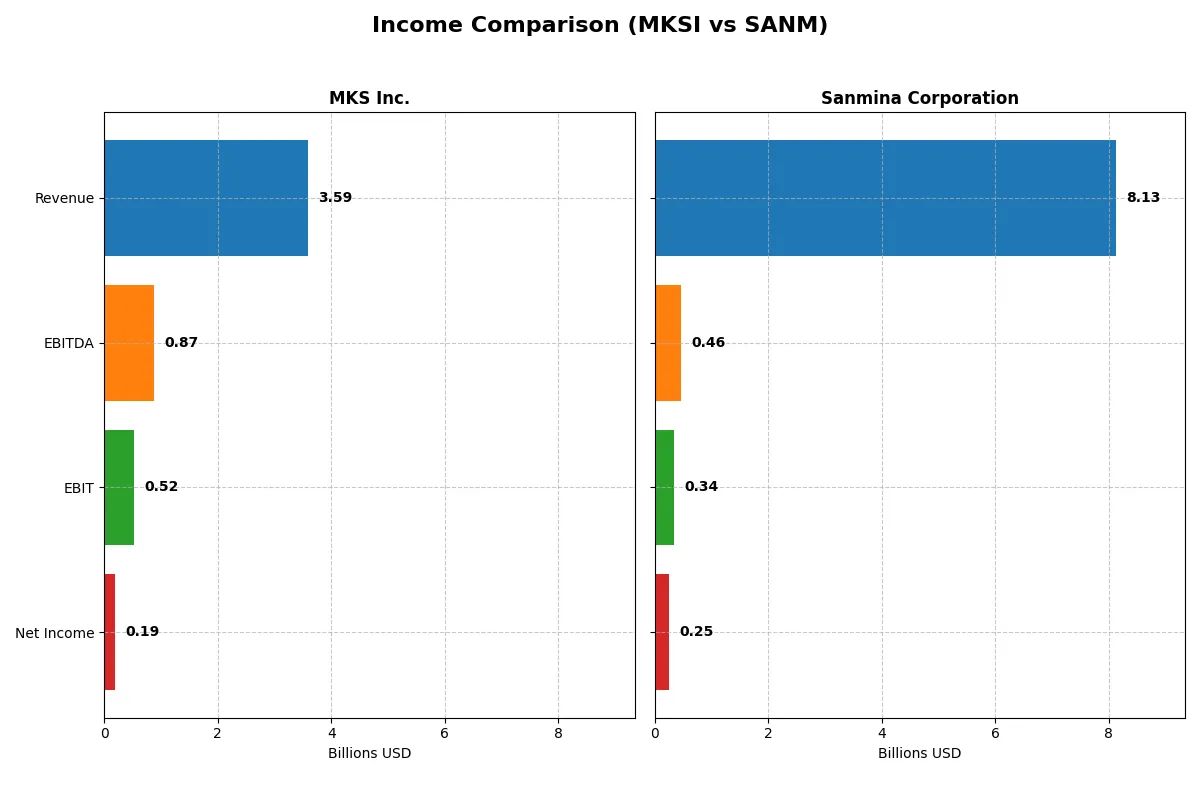
The following data dissects the core profitability and scalability of both corporate engines to reveal who dominates the bottom line:
| Metric | MKS Inc. (MKSI) | Sanmina Corporation (SANM) |
|---|---|---|
| Revenue | 3.59B | 7.57B |
| Cost of Revenue | 1.88B | 6.93B |
| Operating Expenses | 1.21B | 305M |
| Gross Profit | 1.71B | 640M |
| EBITDA | 870M | 469M |
| EBIT | 522M | 347M |
| Interest Expense | 345M | 29M |
| Net Income | 190M | 223M |
| EPS | 2.82 | 4.00 |
| Fiscal Year | 2024 | 2024 |
Income Statement Analysis: The Bottom-Line Duel
This income statement comparison reveals which company runs a more efficient and profitable corporate engine in the current market environment.
MKS Inc. Analysis
MKS Inc. posts steady revenue growth of 3.6B in 2024, slightly down from 3.62B in 2023, with net income rebounding sharply to 190M from a steep loss in 2023. The company sustains a healthy gross margin near 48% and improves net margin to 5.3%. Efficiency gains are clear, with EBIT surging 135% year-over-year, signaling strong operational momentum.
Sanmina Corporation Analysis
Sanmina reports 8.13B revenue in 2025, up 7.4% from 7.57B in 2024, showing solid top-line expansion. However, its net margin remains modest at 3%, with net income at 246M. Gross margin holds steady near 9%, but EBIT declined slightly by 0.9%, reflecting rising operating expenses outpacing revenue growth. Profitability growth is slower and less consistent.
Margin Power vs. Revenue Scale
MKS Inc. demonstrates superior margin control and operational efficiency despite a slight revenue dip, driving a strong net income recovery. Sanmina grows revenue faster but struggles to convert scale into margin expansion or net income gains. Investors seeking disciplined profit conversion may favor MKS’s profile, while Sanmina appeals for growth-focused portfolios prioritizing scale.
Financial Ratios Comparison
These vital ratios act as a diagnostic tool to expose the underlying fiscal health, valuation premiums, and capital efficiency of the companies compared below:
| Ratios | MKS Inc. (MKSI) | Sanmina Corporation (SANM) |
|---|---|---|
| ROE | 8.18% | 10.45% |
| ROIC | 6.31% | 9.04% |
| P/E | 37.0 | 17.1 |
| P/B | 3.03 | 1.73 |
| Current Ratio | 3.19 | 1.99 |
| Quick Ratio | 2.04 | 1.25 |
| D/E (Debt-to-Equity) | 2.06 | 0.17 |
| Debt-to-Assets | 55.6% | 7.96% |
| Interest Coverage | 1.44x | 11.50x |
| Asset Turnover | 0.42 | 1.57 |
| Fixed Asset Turnover | 3.55 | 10.91 |
| Payout ratio | 31.1% | 0% |
| Dividend yield | 0.84% | 0% |
| Fiscal Year | 2024 | 2024 |
Efficiency & Valuation Duel: The Vital Signs
Financial ratios act as a company’s DNA, exposing hidden risks and operational strengths that shape investor confidence and portfolio decisions.
MKS Inc.
MKS Inc. posts a modest ROE of 8.18% and a neutral net margin at 5.3%, signaling restrained profitability. Its P/E ratio of 37 marks the stock as expensive relative to earnings. The firm maintains a dividend yield of 0.84%, but high debt and a weak interest coverage ratio indicate financial strain. Reinvestment strongly favors R&D, reflecting growth focus despite stretched valuation.
Sanmina Corporation
Sanmina shows a healthier ROE of 10.45% with a lower net margin of 3.03%, indicating efficient asset use amid thin profits. Its P/E of 25.6 is cheaper than MKS, suggesting better valuation appeal. Sanmina carries minimal debt, excellent interest coverage, and solid asset turnover. It pays no dividend, channeling cash into operational efficiency and moderate growth initiatives.
Premium Valuation vs. Operational Safety
MKS Inc. trades at a premium but struggles with high leverage and weak interest coverage, raising risk. Sanmina offers a more balanced profile, combining efficient operations with prudent capital structure. Investors seeking growth at a measured risk may prefer Sanmina’s operational safety over MKS’s stretched valuation.
Which one offers the Superior Shareholder Reward?
I compare MKS Inc. (MKSI) and Sanmina Corporation (SANM) on dividend and buyback strategies. MKSI pays a modest 0.86% dividend yield with a 31% payout ratio, supported by strong free cash flow (FCF) coverage above 2.9x. SANM pays no dividend but reinvests aggressively in growth and R&D. MKSI also runs consistent buybacks, boosting total return. SANM’s buyback pace is less visible but prioritizes capital expenditure for growth. MKSI’s balanced dividend and buyback approach offers a more sustainable, shareholder-friendly model in 2026. I favor MKSI for superior total return potential, combining yield with disciplined capital allocation.
Comparative Score Analysis: The Strategic Profile
The radar chart reveals the core DNA and trade-offs of MKS Inc. and Sanmina Corporation across key financial metrics:
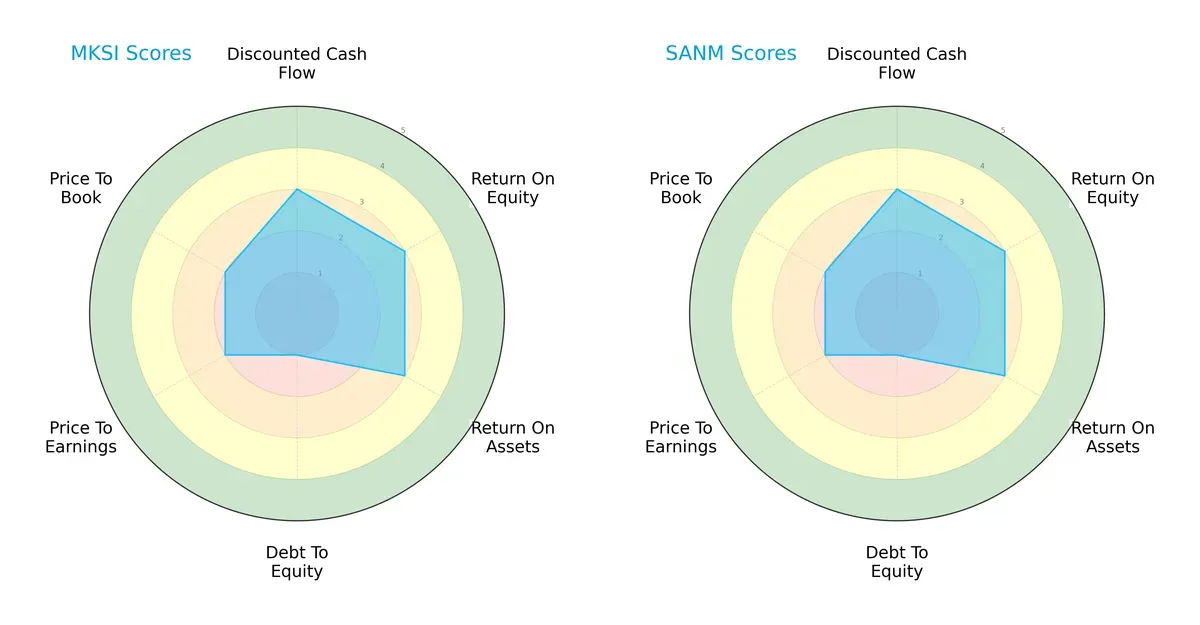
Both firms share identical scores in DCF (3), ROE (3), ROA (3), P/E (2), and P/B (2), reflecting moderate operational efficiency and valuation. However, both show a very unfavorable debt-to-equity score (1), signaling elevated financial risk. Neither stands out with a balanced edge; they rely on similar moderate strengths but carry significant leverage concerns.
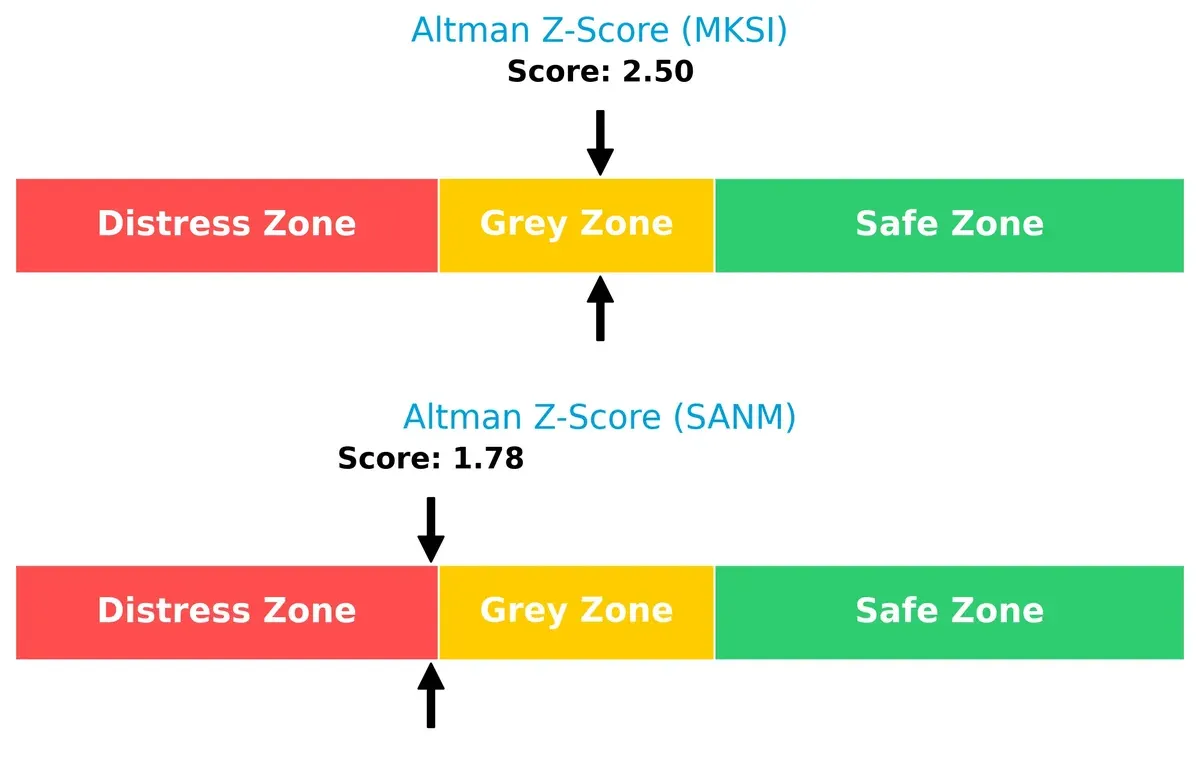
Bankruptcy Risk: Solvency Showdown
MKS Inc.’s Altman Z-Score of 2.50 places it in the grey zone, indicating moderate bankruptcy risk. Sanmina’s score of 1.78 lies in the distress zone, signaling higher insolvency risk. In this cycle, MKS shows better long-term survivability prospects:
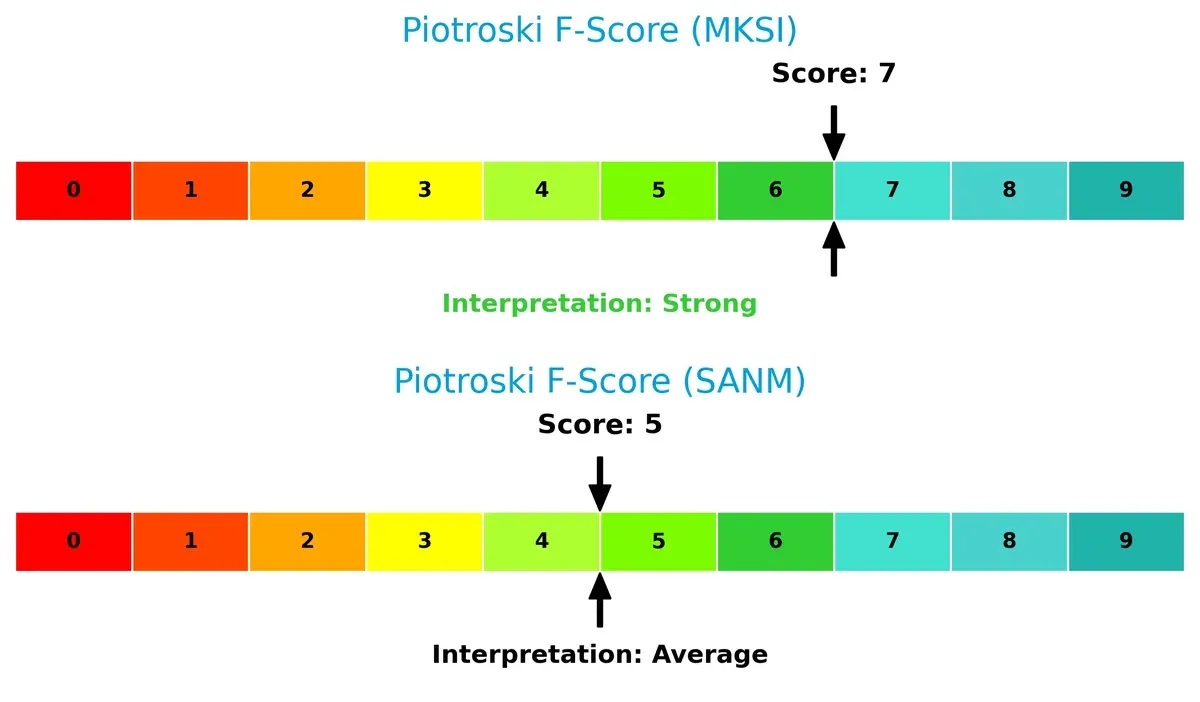
Financial Health: Quality of Operations
MKS Inc. scores a strong 7 on the Piotroski F-Score, reflecting solid financial health and operational quality. Sanmina’s average 5 score suggests weaker internal fundamentals and some red flags relative to MKS:
How are the two companies positioned?
This section dissects MKSI and SANM’s operational DNA by comparing revenue distribution and internal dynamics. The goal is to confront their economic moats and identify which model offers the most resilient competitive advantage today.
Revenue Segmentation: The Strategic Mix
This visual comparison dissects how MKS Inc. and Sanmina Corporation diversify their income streams and where their primary sector bets lie:
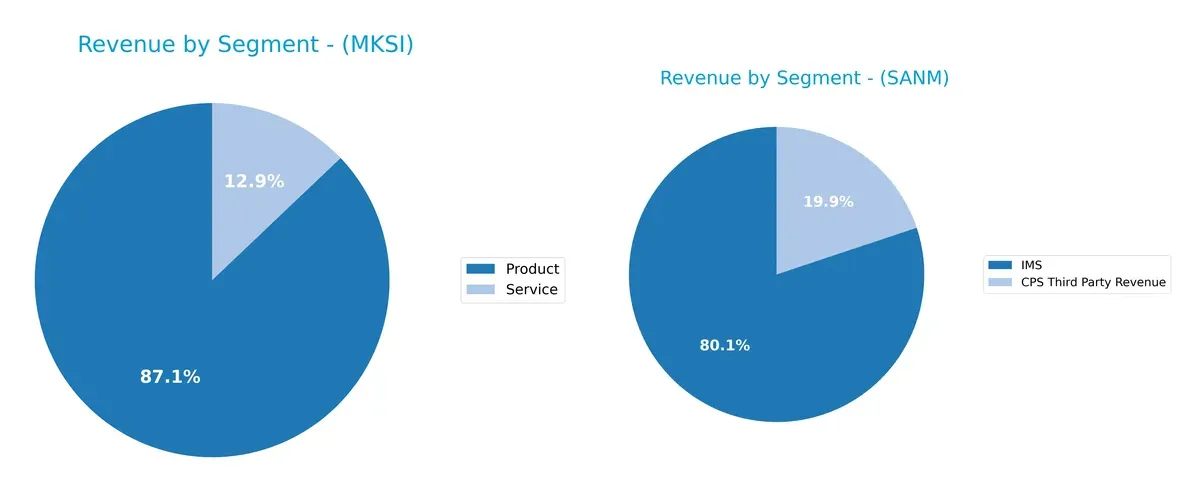
MKS Inc. anchors its revenue in two main segments: Products at $3.12B and Services at $462M, showing moderate diversification. Sanmina, by contrast, pivots heavily on IMS, generating $6.03B in 2024, which dwarfs its CPS Third Party Revenue at $1.53B. Sanmina’s concentration on IMS reveals strong infrastructure dominance but elevates concentration risk. MKS’s balanced product-service mix suggests a strategic hedge against sector volatility.
Strengths and Weaknesses Comparison
This table compares the strengths and weaknesses of MKS Inc. and Sanmina Corporation:
MKS Inc. Strengths
- Diversified revenue streams with multiple product and service divisions
- Favorable quick ratio and fixed asset turnover indicate operational efficiency
- Significant global presence with strong sales in US, China, and Asia
Sanmina Corporation Strengths
- Strong profitability metrics including ROE and ROIC
- Financial leverage and interest coverage ratios are favorable
- Robust asset turnover and fixed asset turnover demonstrate effective capital usage
- Well-diversified geographically with large Americas and Asia Pacific sales
MKS Inc. Weaknesses
- Unfavorable debt levels with high debt-to-assets ratio and D/E of 2.06
- Current ratio flagged as unfavorable despite strong quick ratio
- Low interest coverage and high WACC weigh on financial health
- ROE and valuation multiples are unfavorable
Sanmina Corporation Weaknesses
- Lower net margin compared to MKS Inc.
- Dividend yield is zero, potentially limiting income appeal
- Price-to-earnings ratio remains unfavorable
- Some ratios such as PB are neutral rather than favorable
Both companies show diverse operations and global reach but differ in financial health. MKS Inc. struggles with leverage and valuation issues, while Sanmina’s profitability and capital structure appear stronger. These factors shape each company’s strategic flexibility and risk profile.
The Moat Duel: Analyzing Competitive Defensibility
A structural moat is the only reliable shield protecting a company’s long-term profits from relentless competitive erosion:
MKS Inc.: Intangible Assets Powering Precision Control
MKS Inc. leverages proprietary vacuum and laser technologies as its moat. This manifests in stable gross margins near 48%, signaling pricing power. However, a declining ROIC signals weakening capital efficiency in 2026, risking margin pressure.
Sanmina Corporation: Integrated Manufacturing Scale
Sanmina’s moat rests on its vast manufacturing scale and supply chain integration, contrasting MKS’s tech focus. Despite lower margins around 9%, Sanmina operates with a slightly unfavorable ROIC trend but benefits from broader diversification and steady revenue growth prospects.
Verdict: Proprietary Technology vs. Scale Efficiency
MKS’s intangible asset moat is deeper but currently eroding, while Sanmina’s scale-driven moat is wider but less profitable. Given both face declining ROICs, Sanmina may better defend market share through operational breadth despite thinner margins.
Which stock offers better returns?
Over the past year, both stocks showed strong gains with distinct trading dynamics; MKS Inc. accelerated sharply, while Sanmina Corporation’s growth decelerated despite a higher overall price increase.
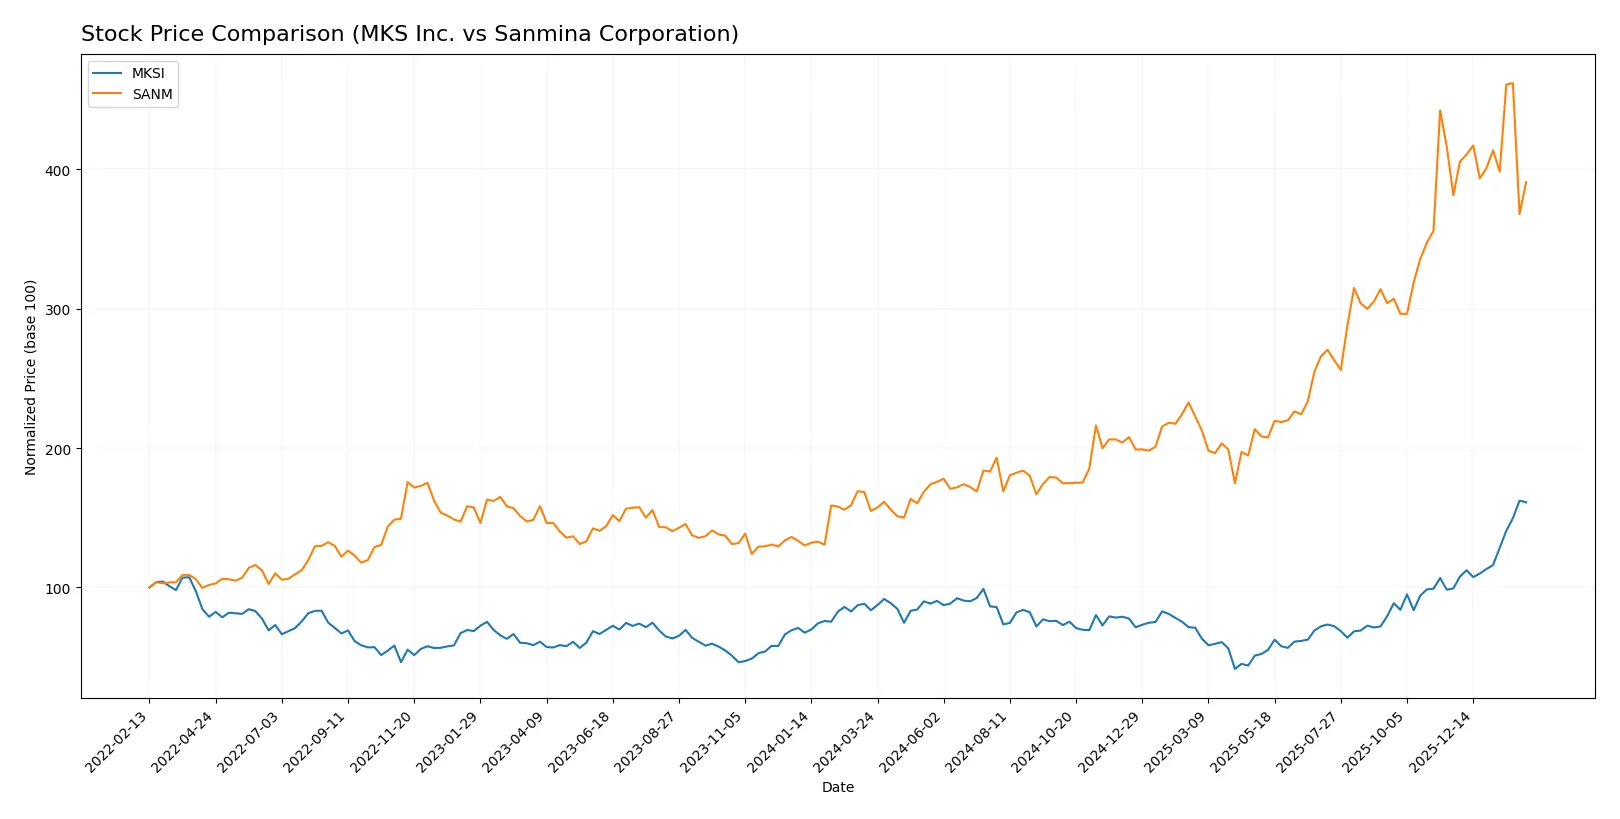
Trend Comparison
MKS Inc.’s stock rose 92.7% over the last 12 months with accelerating momentum and a high volatility of 31.39 standard deviation, reaching a peak at 235.41.
Sanmina Corporation’s stock surged 152.42% over the same period, but the trend shows deceleration with slightly higher volatility at 32.23 and a top price of 177.83.
Sanmina delivered the highest market performance by total price gain, though MKS shows stronger recent acceleration and buyer dominance.
Target Prices
Analysts present a constructive consensus on MKS Inc. and Sanmina Corporation with clear upside potential.
| Company | Target Low | Target High | Consensus |
|---|---|---|---|
| MKS Inc. | 151 | 265 | 223 |
| Sanmina Corporation | 200 | 200 | 200 |
MKS Inc.’s target consensus at 223 suggests a modest upside from the current 233.57 price, reflecting market confidence amid sector volatility. Sanmina’s steady target at 200 implies nearly 33% upside from its 150.47 price, signaling robust analyst optimism in its manufacturing solutions.

Don’t Let Luck Decide Your Entry Point
Optimize your entry points with our advanced ProRealTime indicators. You’ll get efficient buy signals with precise price targets for maximum performance. Start outperforming now!
How do institutions grade them?
Here is a comparison of recent institutional grades for MKS Inc. and Sanmina Corporation:
MKS Inc. Grades
The table below summarizes recent grades from reputable grading firms for MKS Inc.:
| Grading Company | Action | New Grade | Date |
|---|---|---|---|
| Morgan Stanley | Maintain | Overweight | 2026-01-22 |
| TD Cowen | Maintain | Buy | 2026-01-22 |
| Needham | Maintain | Buy | 2026-01-22 |
| Wells Fargo | Maintain | Equal Weight | 2026-01-22 |
| B of A Securities | Maintain | Buy | 2026-01-22 |
| Cantor Fitzgerald | Maintain | Overweight | 2026-01-20 |
| Keybanc | Maintain | Overweight | 2026-01-16 |
| Wells Fargo | Maintain | Equal Weight | 2026-01-15 |
| Needham | Maintain | Buy | 2026-01-13 |
| B of A Securities | Maintain | Buy | 2026-01-13 |
Sanmina Corporation Grades
Below are recent institutional grades for Sanmina Corporation from verified sources:
| Grading Company | Action | New Grade | Date |
|---|---|---|---|
| Argus Research | Maintain | Buy | 2026-01-28 |
| B of A Securities | Maintain | Neutral | 2025-07-11 |
| B of A Securities | Maintain | Neutral | 2025-06-09 |
| B of A Securities | Upgrade | Neutral | 2025-01-29 |
| Craig-Hallum | Maintain | Hold | 2024-11-05 |
| Craig-Hallum | Downgrade | Hold | 2024-04-30 |
| Sidoti & Co. | Upgrade | Buy | 2022-11-08 |
| Sidoti & Co. | Upgrade | Buy | 2022-11-07 |
| Sidoti & Co. | Downgrade | Neutral | 2022-10-31 |
| Sidoti & Co. | Downgrade | Neutral | 2022-10-30 |
Which company has the best grades?
MKS Inc. consistently receives Buy and Overweight ratings from multiple firms, reflecting stronger institutional confidence. Sanmina’s ratings cluster around Neutral and Hold, indicating more cautious sentiment. Investors may view MKS Inc.’s superior grades as a sign of comparatively higher market enthusiasm.
Risks specific to each company
The following categories identify the critical pressure points and systemic threats facing both firms in the 2026 market environment:
1. Market & Competition
MKS Inc.
- Operates in niche high-tech instrumentation with strong product integration but faces high competition and innovation pressure.
Sanmina Corporation
- Competes broadly in integrated manufacturing, exposed to commoditized segments and aggressive pricing pressures.
2. Capital Structure & Debt
MKS Inc.
- High debt-to-equity ratio (2.06) signals elevated leverage and financial risk. Interest coverage barely above 1.5x is a red flag.
Sanmina Corporation
- Very low leverage (D/E 0.17) with strong interest coverage (80x) highlights a robust balance sheet and low financial distress risk.
3. Stock Volatility
MKS Inc.
- Beta near 1.94 indicates high sensitivity to market swings, increasing investor risk in turbulent cycles.
Sanmina Corporation
- Beta around 1.03 shows moderate volatility, more aligned with market benchmarks, offering less erratic price behavior.
4. Regulatory & Legal
MKS Inc.
- Subject to technology and export regulations impacting semiconductor and industrial technology sectors.
Sanmina Corporation
- Faces regulatory scrutiny tied to defense contracts and environmental compliance, increasing operational complexity.
5. Supply Chain & Operations
MKS Inc.
- Complex, technology-intensive supply chain vulnerable to semiconductor shortages and logistics disruptions.
Sanmina Corporation
- Broad manufacturing footprint exposes it to varied supply chain risks but benefits from diversified supplier base.
6. ESG & Climate Transition
MKS Inc.
- Moderate ESG risk; pressure to enhance sustainability in energy-intensive manufacturing processes.
Sanmina Corporation
- Increasing ESG demands in defense and automotive sectors could raise compliance costs and reputational risk.
7. Geopolitical Exposure
MKS Inc.
- Global sales and supply chains susceptible to US-China tensions and export controls.
Sanmina Corporation
- Significant exposure to geopolitical risk via defense contracts and global manufacturing sites, requiring close monitoring.
Which company shows a better risk-adjusted profile?
The most impactful risk for MKS Inc. is its precarious capital structure with high leverage and weak interest coverage, signaling financial vulnerability. Sanmina’s dominant risk lies in its geopolitical exposure and regulatory complexity, given its defense sector ties. Overall, Sanmina exhibits a superior risk-adjusted profile due to stronger liquidity, lower debt, and moderate stock volatility, despite its geopolitical challenges. Notably, MKS’s beta near 1.94 underscores heightened market risk, reinforcing my concern over its financial leverage amid uncertain macro conditions.
Final Verdict: Which stock to choose?
MKS Inc. stands out with its unmatched efficiency in managing fixed assets, delivering strong gross and EBIT margins despite a challenging macro environment. Its high current ratio signals liquidity strength, but its heavy leverage and declining ROIC remain points of vigilance. It suits aggressive growth portfolios willing to navigate volatility.
Sanmina Corporation’s strategic moat lies in its solid asset turnover and conservative capital structure, which underpin its relative financial safety compared to MKS. While margins are thinner, its stable cash flow and lower debt make it appealing for investors favoring steady growth with moderate risk. It fits well in GARP (Growth at a Reasonable Price) portfolios.
If you prioritize capital efficiency and are comfortable with higher financial risk, MKS Inc. offers a compelling case through operational strength and growth acceleration. However, if you seek better stability and a cleaner balance sheet, Sanmina provides superior downside protection despite slower momentum. Each appeals to distinct investor profiles based on risk tolerance and growth expectations.
Disclaimer: Investment carries a risk of loss of initial capital. The past performance is not a reliable indicator of future results. Be sure to understand risks before making an investment decision.
Go Further
I encourage you to read the complete analyses of MKS Inc. and Sanmina Corporation to enhance your investment decisions: