Home > Comparison > Technology > SNDK vs MKSI
The strategic rivalry between Sandisk Corporation and MKS Inc. shapes the technology hardware sector’s evolution. Sandisk, a market leader in NAND flash storage devices, contrasts with MKS, a diversified provider of precision instruments and process control solutions. This head-to-head pits Sandisk’s storage innovation against MKS’s industrial process expertise. This analysis will assess which company’s operational model delivers superior risk-adjusted returns for a diversified portfolio amid ongoing technological advancements.
Table of contents
Companies Overview
Sandisk Corporation and MKS Inc. both stand as pivotal players in the hardware equipment sector, driving innovation and technology in distinct niches.
Sandisk Corporation: Flash Storage Innovator
Sandisk dominates the NAND flash storage market, generating revenue primarily through solid state drives and removable memory cards. In 2026, it focuses strategically on expanding embedded products and advancing wafer technology, reinforcing its leadership in high-performance storage solutions.
MKS Inc.: Precision Control Specialist
MKS Inc. excels in providing process control instruments and laser systems for semiconductor and industrial manufacturing. Its 2026 strategy emphasizes enhancing vacuum and analysis technologies, alongside laser-based PCB manufacturing systems, targeting precision and reliability in high-tech production environments.
Strategic Collision: Similarities & Divergences
Both companies operate in hardware but diverge in approach: Sandisk champions integrated storage solutions, while MKS prioritizes process instrumentation and control. They compete indirectly within advanced manufacturing ecosystems, with Sandisk focusing on data storage and MKS on process precision. Their distinct investment profiles reflect different technological moats and market dynamics within the broader tech hardware landscape.
Income Statement Comparison
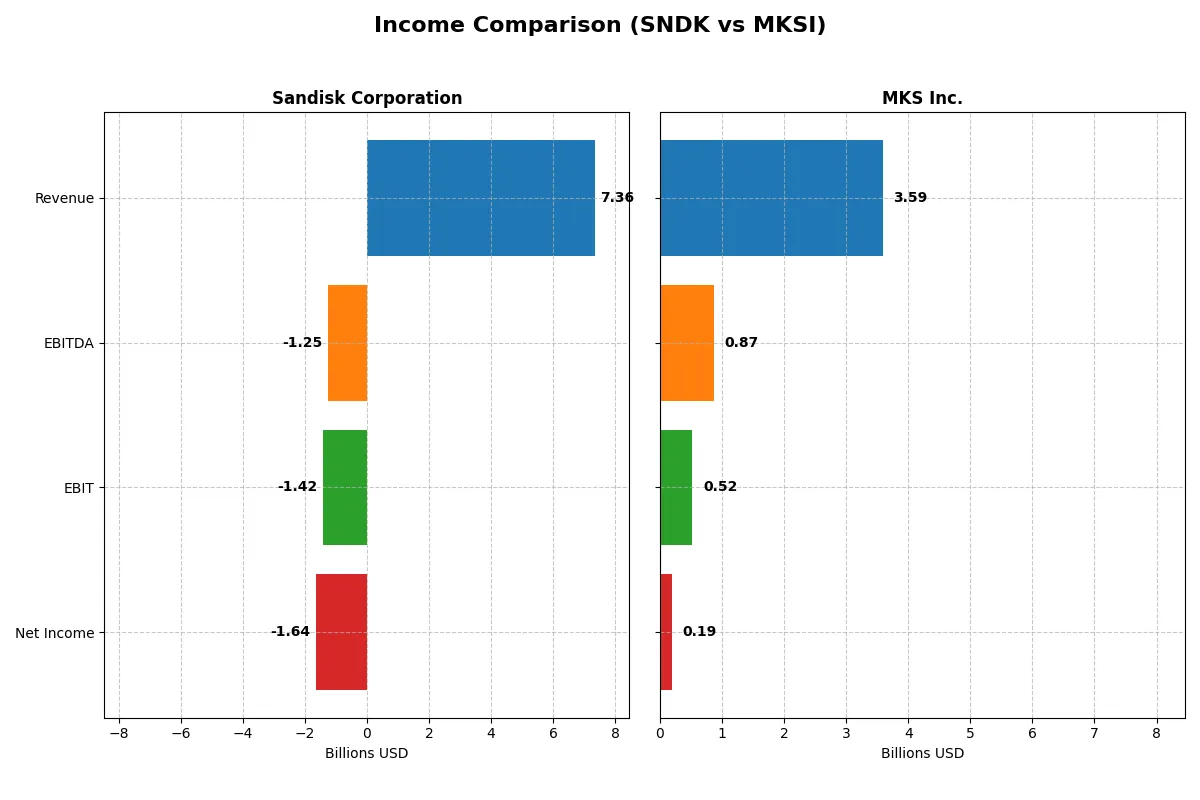
This data dissects the core profitability and scalability of both corporate engines to reveal who dominates the bottom line:
| Metric | Sandisk Corporation (SNDK) | MKS Inc. (MKSI) |
|---|---|---|
| Revenue | 7.36B | 3.59B |
| Cost of Revenue | 5.14B | 1.88B |
| Operating Expenses | 3.59B | 1.21B |
| Gross Profit | 2.21B | 1.71B |
| EBITDA | -1.25B | 870M |
| EBIT | -1.42B | 522M |
| Interest Expense | 63M | 345M |
| Net Income | -1.64B | 190M |
| EPS | -11.32 | 2.82 |
| Fiscal Year | 2025 | 2024 |
Income Statement Analysis: The Bottom-Line Duel
This income statement comparison reveals which company operates with greater efficiency and profitability amid recent market conditions.
Sandisk Corporation Analysis
Sandisk’s revenue declined 25% from 2022 to 2025 but rebounded 10% in 2025 alone. Despite a healthy gross margin of 30%, it reported a net loss of -1.64B in 2025, deepening from prior years. Operating expenses grew faster than revenue, eroding EBIT margin to -19%, signaling deteriorating operational efficiency and mounting losses.
MKS Inc. Analysis
MKS’s revenue climbed 54% over 2020-2024, though it slipped slightly by 1% in 2024. It sustained a robust gross margin near 48% and turned a net profit of 190M in 2024, reversing a severe loss in 2023. EBIT margin improved to 15%, reflecting strong operational leverage and effective cost control, despite elevated interest expenses.
Margin Resilience vs. Recovery Momentum
MKS delivers superior profitability and margin strength, recovering swiftly from a prior loss with solid operational gains. Conversely, Sandisk struggles with margin compression and growing net losses despite revenue stabilization. For investors seeking margin resilience and improving bottom-line results, MKS offers a more attractive profile amid uncertain cycles.
Financial Ratios Comparison
These vital ratios act as a diagnostic tool to expose the underlying fiscal health, valuation premiums, and capital efficiency of the companies compared below:
| Ratios | Sandisk Corporation (SNDK) | MKS Inc. (MKSI) |
|---|---|---|
| ROE | -17.8% (2025) | 8.18% (2024) |
| ROIC | -11.9% (2025) | 6.31% (2024) |
| P/E | -4.17 (2025) | 37.0 (2024) |
| P/B | 0.74 (2025) | 3.03 (2024) |
| Current Ratio | 3.56 (2025) | 3.19 (2024) |
| Quick Ratio | 2.11 (2025) | 2.04 (2024) |
| D/E (Debt to Equity) | 0.22 (2025) | 2.06 (2024) |
| Debt-to-Assets | 15.7% (2025) | 55.6% (2024) |
| Interest Coverage | -21.9 (2025) | 1.44 (2024) |
| Asset Turnover | 0.57 (2025) | 0.42 (2024) |
| Fixed Asset Turnover | 11.9 (2025) | 3.55 (2024) |
| Payout ratio | 0% (2025) | 31.1% (2024) |
| Dividend yield | 0% (2025) | 0.84% (2024) |
| Fiscal Year | 2025 | 2024 |
Efficiency & Valuation Duel: The Vital Signs
Financial ratios act as a company’s DNA, unveiling hidden risks and operational strengths critical for investment decisions.
Sandisk Corporation
Sandisk shows weak profitability with a negative ROE of -17.81% and a net margin of -22.31%, signaling operational challenges. Its valuation is attractive, with a P/E ratio below zero and a P/B of 0.74, indicating undervaluation. The firm does not pay dividends but invests heavily in R&D (15.4% of revenue), aiming for future growth.
MKS Inc.
MKS posts modest profitability, with an ROE of 8.18% and a net margin of 5.3%, reflecting moderate efficiency. The stock appears expensive, trading at a P/E of 37 and P/B at 3.03. It offers a small dividend yield of 0.84%, but carries high leverage (D/E 2.06) and interest burden, increasing financial risk.
Valuation Appeal vs. Operational Strain
Sandisk’s cheaper valuation contrasts with its negative returns, while MKS carries a premium price amid moderate profitability and elevated debt. Sandisk fits investors who tolerate operational turnaround risk; MKS suits those prioritizing stable, albeit costly, earnings.
Which one offers the Superior Shareholder Reward?
Sandisk Corporation (SNDK) pays no dividends and lacks share buybacks, reflecting negative free cash flow and operating losses in recent years. Conversely, MKS Inc. (MKSI) combines a modest 0.84% dividend yield with consistent buyback programs supported by positive free cash flow and solid operating margins. MKSI’s payout ratio hovers around 31%, balancing income with reinvestment. Despite heavier leverage, MKSI’s dividend and buybacks offer a sustainable shareholder return model. I conclude MKSI provides a superior total return profile for 2026 investors given its disciplined capital allocation and durable profitability.
Comparative Score Analysis: The Strategic Profile
The radar chart reveals the fundamental DNA and trade-offs of Sandisk Corporation and MKS Inc., highlighting their distinct financial strengths and valuation profiles:
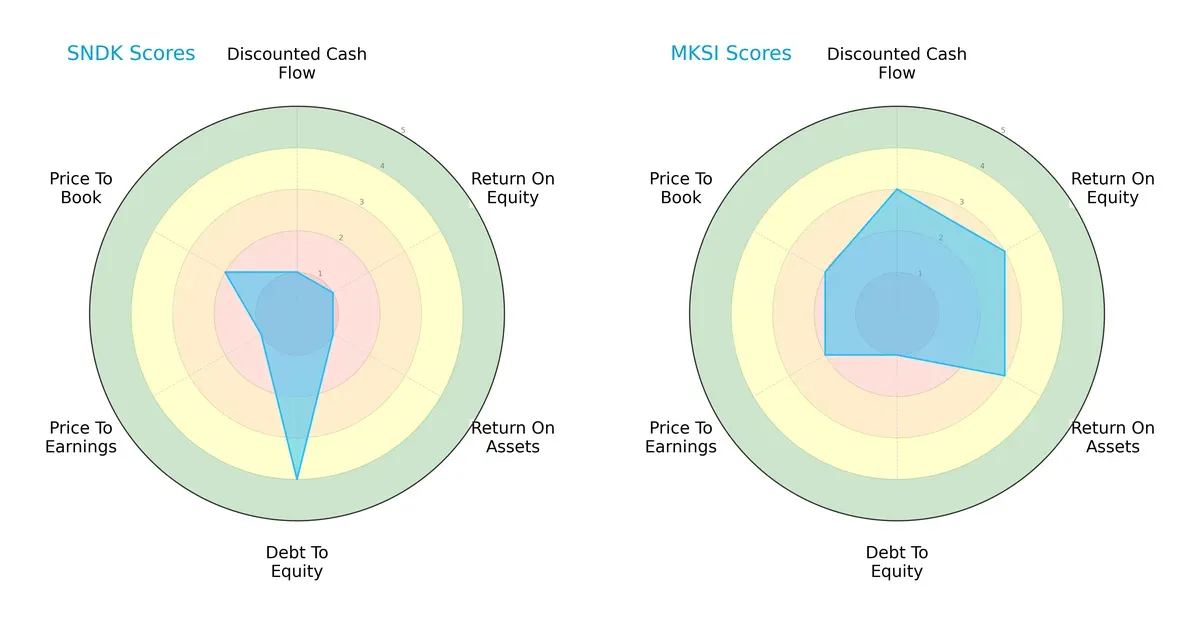
Sandisk leans heavily on a strong balance sheet with a favorable debt-to-equity score (4), but it struggles with profitability metrics, scoring very low on ROE (1) and ROA (1). Its valuation scores (PE 1, PB 2) suggest undervaluation, yet this is paired with weak cash flow (DCF 1). MKS Inc. presents a more balanced profile, showing moderate strength in profitability (ROE 3, ROA 3) and cash flow (DCF 3), albeit with a high leverage risk (debt-to-equity 1). Overall, MKS exhibits a more consistent operational performance, while Sandisk relies on capital structure robustness amid operational challenges.
Bankruptcy Risk: Solvency Showdown
The Altman Z-Score difference shows Sandisk in a very safe zone (19.0) versus MKS in the grey zone (2.5), indicating:
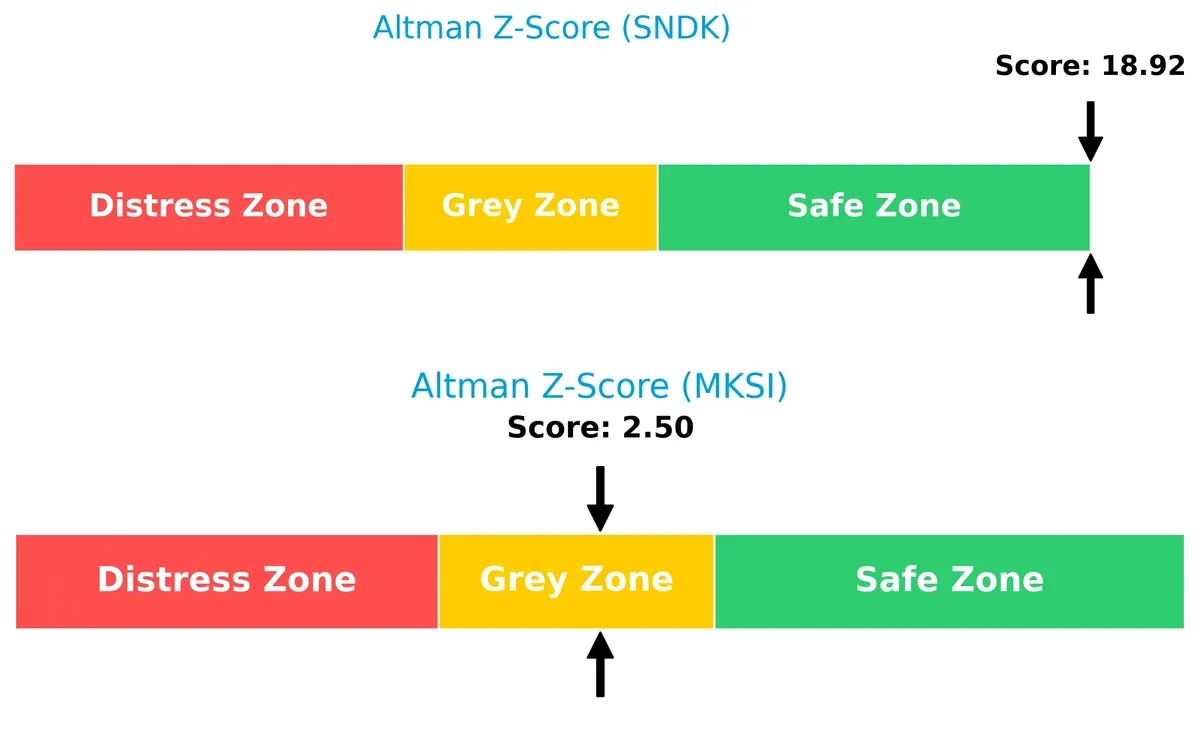
Sandisk’s extremely high Z-Score signals exceptional financial stability and low bankruptcy risk, even in volatile cycles. MKS, with a borderline score near 1.8–3, faces moderate solvency risk, requiring cautious monitoring of its debt levels.
Financial Health: Quality of Operations
Piotroski F-Scores position MKS at 7 (strong) and Sandisk at 5 (average), reflecting:
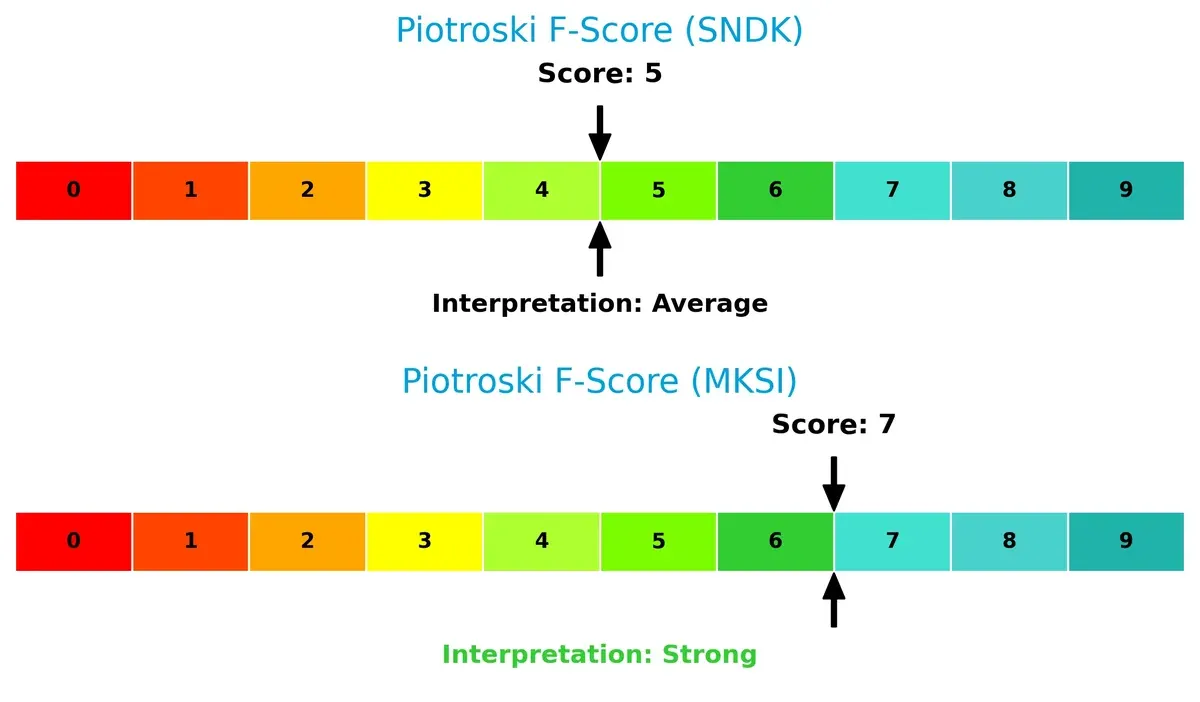
MKS demonstrates superior internal financial health, efficient asset use, and profitability. Sandisk’s average score signals some red flags in operational quality, suggesting potential internal weaknesses investors should consider carefully.
How are the two companies positioned?
This section dissects the operational DNA of Sandisk and MKS by comparing their revenue distribution and internal dynamics. The goal is to confront their economic moats to reveal which model offers the most resilient competitive advantage today.
Revenue Segmentation: The Strategic Mix
This visual comparison dissects how Sandisk Corporation and MKS Inc. diversify their income streams and reveals where their primary sector bets lie:
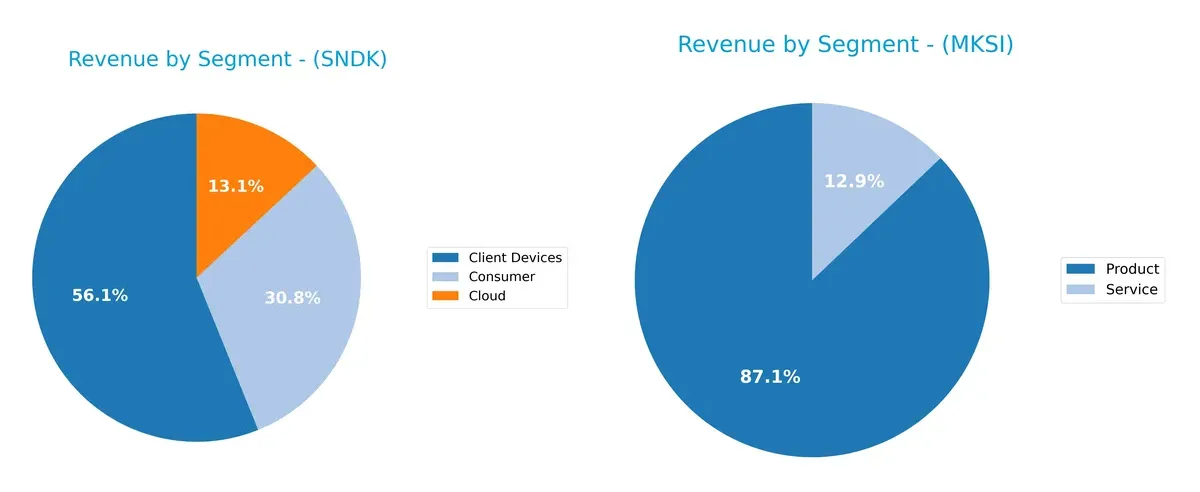
Sandisk anchors its revenue in Client Devices at $4.13B, with Consumer ($2.27B) and Cloud ($960M) diversifying moderately. MKS relies heavily on a single segment, Product, generating $3.12B, with Services at $462M. Sandisk’s broader mix suggests resilience through ecosystem lock-in, while MKS’s concentration on Product risks volatility but signals infrastructure dominance in its niche.
Strengths and Weaknesses Comparison
This table compares the Strengths and Weaknesses of Sandisk Corporation and MKS Inc.:
Sandisk Corporation Strengths
- Strong product diversification across Client Devices, Cloud, and Consumer segments
- High quick ratio at 2.11 indicating good short-term liquidity
- Low debt-to-assets ratio at 15.73% reflecting conservative leverage
- High fixed asset turnover of 11.88 signaling efficient asset use
- Solid global presence with significant revenues from China, US, EMEA, and Asia
MKS Inc. Strengths
- Diverse revenue streams from Product and Service segments
- Favorable quick ratio at 2.04 supports liquidity
- Consistent revenue from multiple geographic areas including US, China, Korea, and others
- Moderate fixed asset turnover of 3.55 showing asset utilization
- Stable presence in key industrial markets worldwide
Sandisk Corporation Weaknesses
- Negative profitability ratios with net margin at -22.31% and ROE at -17.81%
- Unfavorable high WACC of 25.99% undermining returns
- Negative interest coverage ratio at -22.48 suggests risk in servicing debt
- Current ratio of 3.56 flagged as unfavorable possibly indicating inefficient working capital
- Zero dividend yield limits shareholder income
MKS Inc. Weaknesses
- High leverage with debt-to-assets at 55.65% and D/E ratio of 2.06
- Unfavorable net margin at only 5.3% and weak ROE at 8.18%
- Elevated WACC at 11.45% limits capital efficiency
- Poor interest coverage at 1.51 signals debt servicing strain
- Unfavorable P/E and P/B ratios reflect valuation concerns
- Low asset turnover at 0.42 implies suboptimal asset use
Sandisk exhibits strengths in asset efficiency and conservative leverage but struggles with profitability and capital cost. MKS shows broad market reach and liquidity but faces challenges with high debt and weaker profitability metrics. These contrasts highlight differing strategic priorities and financial health profiles.
The Moat Duel: Analyzing Competitive Defensibility
A structural moat protects long-term profits from relentless competition erosion. Without it, gains quickly vanish in commoditized markets:
Sandisk Corporation: Intangible Assets and Scale Moat
Sandisk’s competitive edge hinges on proprietary NAND flash technology and scale. This moat shows in its strong gross margin but declining ROIC signals margin pressure. New storage innovations in 2026 could either deepen the moat or accelerate value erosion.
MKS Inc.: Process Control and Precision Engineering Moat
MKS relies on specialized process control systems creating high switching costs. Unlike Sandisk, MKS sustains more stable margins and modest growth. Its expansion into photonics and laser tech in 2026 offers a chance to strengthen its niche moat.
Scale and Specialization: Which Moat Holds Firmer?
Both firms face declining ROIC, signaling value destruction. Yet, MKS’s focused engineering moat is deeper and better preserved than Sandisk’s broader but weakening scale advantage. MKS stands better positioned to defend market share in 2026.
Which stock offers better returns?
Over the past year, Sandisk Corporation and MKS Inc. both posted strong price gains, with Sandisk showing more pronounced acceleration and higher volatility in trading dynamics.
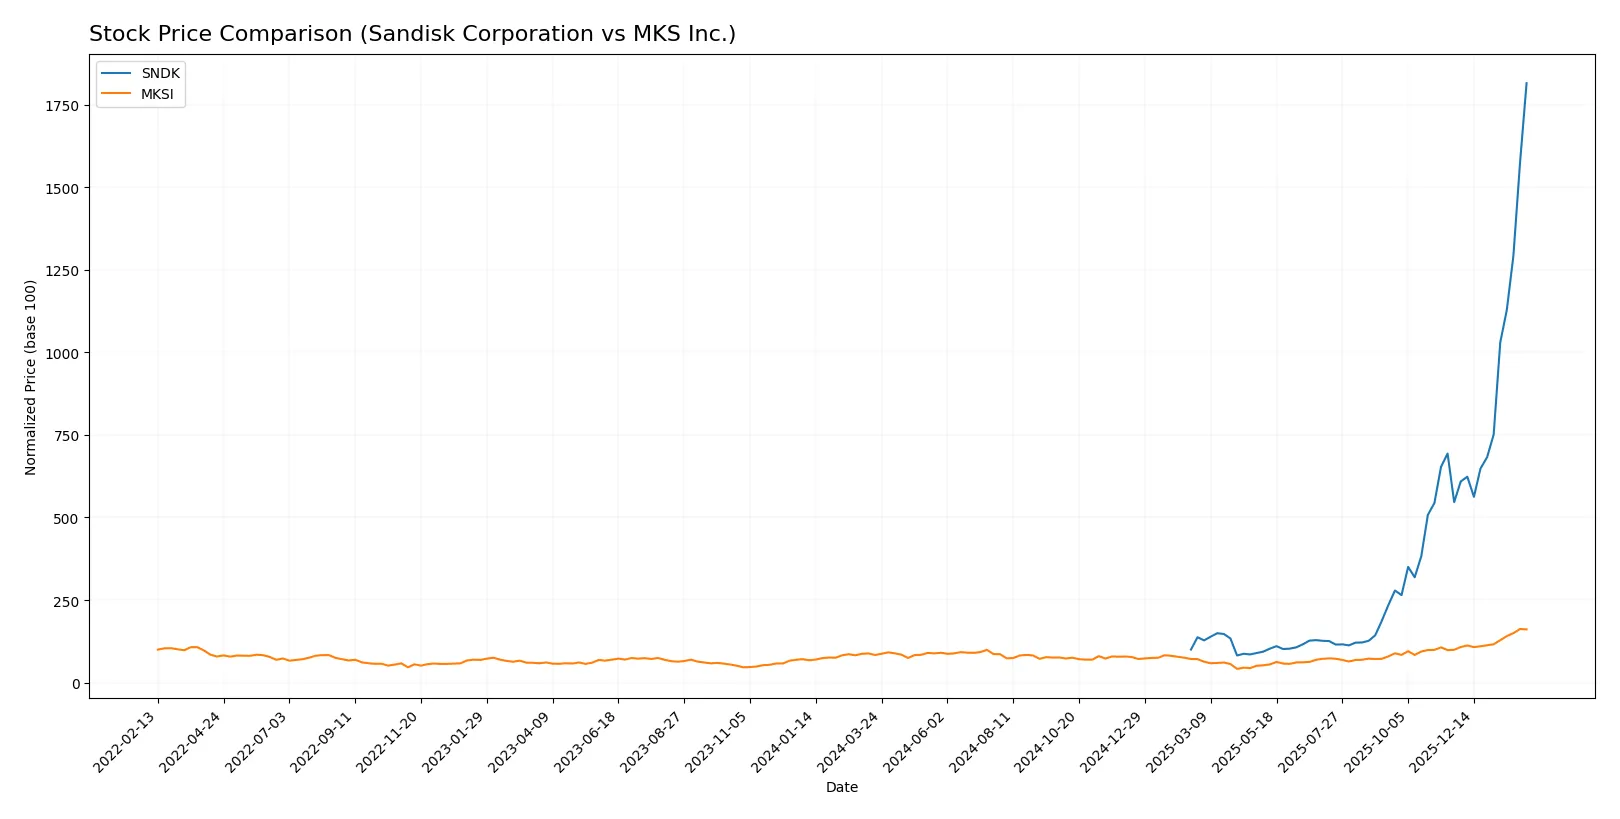
Trend Comparison
Sandisk’s stock soared 1715.12% over 12 months, marking a bullish trend with accelerating momentum and a high price range between 30.11 and 665.24. Volatility is significant, reflected by a 144.54 standard deviation.
MKS Inc. gained 92.7% in the same period, also bullish with acceleration. Its price ranged from 60.29 to 235.41, showing moderate volatility at a 31.39 standard deviation.
Sandisk outperformed MKS substantially, delivering the highest market returns and stronger recent acceleration over the past year.
Target Prices
The analyst consensus presents a bullish outlook for both Sandisk Corporation and MKS Inc.
| Company | Target Low | Target High | Consensus |
|---|---|---|---|
| Sandisk Corporation | 220 | 1,000 | 675 |
| MKS Inc. | 151 | 265 | 223 |
Sandisk’s consensus target of 675 is slightly above its current price of 665.24, indicating modest upside potential. MKS’s consensus target of 223 is just below its current price of 233.57, suggesting a slight downside risk.

Don’t Let Luck Decide Your Entry Point
Optimize your entry points with our advanced ProRealTime indicators. You’ll get efficient buy signals with precise price targets for maximum performance. Start outperforming now!
How do institutions grade them?
Sandisk Corporation Grades
The following table summarizes recent grades from leading financial institutions for Sandisk Corporation.
| Grading Company | Action | New Grade | Date |
|---|---|---|---|
| Barclays | Maintain | Equal Weight | 2026-02-02 |
| Citigroup | Maintain | Buy | 2026-02-02 |
| RBC Capital | Maintain | Sector Perform | 2026-01-30 |
| Wedbush | Maintain | Outperform | 2026-01-30 |
| Jefferies | Maintain | Buy | 2026-01-30 |
| Goldman Sachs | Maintain | Buy | 2026-01-30 |
| Cantor Fitzgerald | Maintain | Overweight | 2026-01-30 |
| Morgan Stanley | Maintain | Overweight | 2026-01-30 |
| Citigroup | Maintain | Buy | 2026-01-20 |
| Benchmark | Maintain | Buy | 2026-01-15 |
MKS Inc. Grades
Below is a summary of recent grading actions from reputable firms for MKS Inc.
| Grading Company | Action | New Grade | Date |
|---|---|---|---|
| Morgan Stanley | Maintain | Overweight | 2026-01-22 |
| TD Cowen | Maintain | Buy | 2026-01-22 |
| Needham | Maintain | Buy | 2026-01-22 |
| Wells Fargo | Maintain | Equal Weight | 2026-01-22 |
| B of A Securities | Maintain | Buy | 2026-01-22 |
| Cantor Fitzgerald | Maintain | Overweight | 2026-01-20 |
| Keybanc | Maintain | Overweight | 2026-01-16 |
| Wells Fargo | Maintain | Equal Weight | 2026-01-15 |
| Needham | Maintain | Buy | 2026-01-13 |
| B of A Securities | Maintain | Buy | 2026-01-13 |
Which company has the best grades?
Sandisk Corporation shows a broader consensus of Buy and Outperform grades, while MKS Inc. mostly receives Buy and Overweight ratings. Sandisk’s higher frequency of positive grades may indicate stronger institutional conviction, potentially influencing investor confidence.
Risks specific to each company
The following categories identify the critical pressure points and systemic threats facing Sandisk Corporation and MKS Inc. in the 2026 market environment:
1. Market & Competition
Sandisk Corporation
- Faces intense competition in NAND flash and storage devices; rapid innovation cycles threaten market share.
MKS Inc.
- Operates in diverse segments with specialized process control solutions; competition from integrated suppliers is moderate.
2. Capital Structure & Debt
Sandisk Corporation
- Maintains low debt levels (D/E 0.22), reducing financial risk; however, interest coverage is negative, signaling earnings stress.
MKS Inc.
- High leverage (D/E 2.06) increases financial risk; interest coverage is barely positive (1.51), indicating tight debt servicing capacity.
3. Stock Volatility
Sandisk Corporation
- Extremely high beta (4.80) signals large price swings and market sensitivity; riskier for conservative investors.
MKS Inc.
- Beta is elevated (1.94) but significantly lower than Sandisk’s, implying more moderate stock volatility.
4. Regulatory & Legal
Sandisk Corporation
- Subject to technology export controls and IP litigation risks common in hardware manufacturing.
MKS Inc.
- Faces regulatory scrutiny in manufacturing and environmental compliance; legal risks tied to complex product lines.
5. Supply Chain & Operations
Sandisk Corporation
- Vulnerable to semiconductor supply disruptions; relies heavily on NAND flash suppliers and wafer fabs.
MKS Inc.
- Complex global supply chain for precision components; supply interruptions could impact manufacturing cycles.
6. ESG & Climate Transition
Sandisk Corporation
- Pressure to reduce carbon footprint amid energy-intensive manufacturing; ESG disclosures improving but still evolving.
MKS Inc.
- Faces ESG challenges in energy use and waste management; proactive in sustainability but has room to improve.
7. Geopolitical Exposure
Sandisk Corporation
- Exposure to US-China trade tensions impacting supply chain and sales in Asia-Pacific markets.
MKS Inc.
- Geopolitical risks arise from global manufacturing footprint and international customer base, especially in Asia.
Which company shows a better risk-adjusted profile?
Sandisk’s greatest risk is extreme stock volatility coupled with negative interest coverage, signaling earnings pressure despite low debt. MKS’s key risk is its heavy leverage and weak interest coverage, threatening financial stability. Despite Sandisk’s volatility, its stronger balance sheet and safer Altman Z-score provide a better risk-adjusted profile. MKS’s elevated debt levels and “grey zone” bankruptcy risk warrant caution. Recent data show Sandisk’s debt-to-equity at a prudent 0.22 versus MKS’s risky 2.06, justifying my concern over MKS’s financial leverage.
Final Verdict: Which stock to choose?
Sandisk Corporation’s superpower lies in its resilient liquidity and operational efficiency, supporting a strong cash runway despite profitability challenges. Its declining returns on invested capital remain a point of vigilance. Sandisk fits portfolios seeking aggressive growth with tolerance for volatility and turnaround potential.
MKS Inc. boasts a strategic moat through its consistent gross margins and strong income quality, reflecting robust recurring revenues. While it carries higher leverage and weaker solvency metrics than Sandisk, it offers comparatively more stability. MKS suits investors favoring GARP—growth at a reasonable price—with moderate risk appetite.
If you prioritize aggressive growth and operational strength in a turnaround scenario, Sandisk presents a compelling choice due to its cash efficiency and market momentum. However, if you seek more stable income quality and a strategic moat, MKS offers better stability despite heavier debt and valuation premiums. Both stocks demand cautious monitoring of profitability trends and capital structure risks.
Disclaimer: Investment carries a risk of loss of initial capital. The past performance is not a reliable indicator of future results. Be sure to understand risks before making an investment decision.
Go Further
I encourage you to read the complete analyses of Sandisk Corporation and MKS Inc. to enhance your investment decisions: