MKS Inc. and Ouster, Inc. are two notable players in the hardware, equipment, and parts sector, each pushing innovation in their respective niches. MKS offers advanced instruments and control solutions for manufacturing processes, while Ouster specializes in cutting-edge digital lidar sensors for 3D vision applications. Their overlapping focus on technology and hardware innovation makes this comparison essential. Join me as we explore which company presents the most compelling investment opportunity today.

Table of contents
Companies Overview
I will begin the comparison between MKS Inc. and Ouster, Inc. by providing an overview of these two companies and their main differences.
MKS Inc. Overview
MKS Inc. delivers instruments, systems, and process control solutions that monitor and control critical manufacturing parameters globally. Its offerings span vacuum and pressure control, laser and photonics products, and laser-based PCB manufacturing systems. Serving semiconductor, industrial, life sciences, and defense sectors, MKS operates through direct sales and distributors. Headquartered in Andover, Massachusetts, it employs over 10,200 staff.
Ouster, Inc. Overview
Ouster, Inc. specializes in designing and manufacturing high-resolution digital lidar sensors and software that provide 3D vision capabilities for machinery, vehicles, robots, and infrastructure. Its product range includes scanning and solid-state flash sensors. Based in San Francisco, California, Ouster focuses on advancing lidar technology with a workforce of about 292 employees and a market cap significantly smaller than MKS.
Key similarities and differences
Both MKS and Ouster operate in the technology sector under hardware, equipment, and parts industries, focusing on advanced sensor and control technologies. MKS offers a broader range of products across various industrial applications with a large workforce, while Ouster concentrates on lidar sensor innovation with a smaller team and market cap. Their business models differ in scale, product diversity, and target markets, reflecting distinct strategic focuses within the hardware technology space.
Income Statement Comparison
This table presents a side-by-side comparison of key income statement metrics for MKS Inc. and Ouster, Inc. for the fiscal year 2024.

| Metric | MKS Inc. | Ouster, Inc. |
|---|---|---|
| Market Cap | 12.7B | 1.63B |
| Revenue | 3.59B | 111.1M |
| EBITDA | 870M | -79.9M |
| EBIT | 522M | -94.7M |
| Net Income | 190M | -97.0M |
| EPS | 2.82 | -2.08 |
| Fiscal Year | 2024 | 2024 |
Income Statement Interpretations
MKS Inc.
MKS Inc. showed a 54% revenue increase from 2020 to 2024, though net income declined by 46%, reflecting margin pressure over the period. Gross margin remained strong near 48%, with a recent improvement in EBIT margin to 14.6%. In 2024, revenue slightly decreased by 1%, but EBIT and net margin both more than doubled, signaling operational efficiency gains.
Ouster, Inc.
Ouster experienced a 488% revenue surge from 2020 to 2024 alongside a 9% net income growth, indicating rapid expansion. Gross margin improved favorably to 36%, although EBIT margin remained deeply negative at -85%. In 2024, revenue rose 33%, with gross profit and EBIT losses narrowing, reflecting improving cost control amid growth.
Which one has the stronger fundamentals?
MKS Inc. maintains higher absolute revenue and profitability with consistent positive margins, but its net income has declined overall, suggesting challenges in sustaining earnings. Ouster shows strong growth momentum and improving margins from a low base, but persistent net losses and negative EBIT margin highlight ongoing operational risks. Both companies present favorable income statement trends with distinct risk profiles.
Financial Ratios Comparison
The table below presents a side-by-side comparison of key financial ratios for MKS Inc. and Ouster, Inc. based on their most recent fiscal year data ending 2024.
| Ratios | MKS Inc. (MKSI) | Ouster, Inc. (OUST) |
|---|---|---|
| ROE | 8.18% | -53.64% |
| ROIC | 6.31% | -50.84% |
| P/E | 36.98 | -5.87 |
| P/B | 3.03 | 3.15 |
| Current Ratio | 3.19 | 2.80 |
| Quick Ratio | 2.04 | 2.59 |
| D/E (Debt-to-Equity) | 2.06 | 0.11 |
| Debt-to-Assets | 55.65% | 7.33% |
| Interest Coverage | 1.44 | -57.15 |
| Asset Turnover | 0.42 | 0.40 |
| Fixed Asset Turnover | 3.55 | 4.54 |
| Payout Ratio | 31.05% | 0% |
| Dividend Yield | 0.84% | 0% |
Interpretation of the Ratios
MKS Inc.
MKS Inc. shows a predominance of unfavorable ratios, including low return on equity (8.18%) and high debt levels (debt-to-assets 55.65%), indicating potential financial strain and moderate profitability. The quick ratio is favorable at 2.04, suggesting good short-term liquidity. The company pays dividends, with a 0.84% yield, but this is marked unfavorable, hinting at possible sustainability concerns.
Ouster, Inc.
Ouster, Inc. exhibits mixed financial health with several unfavorable profitability ratios: net margin at -87.35% and return on equity at -53.64%, reflecting significant losses. However, liquidity ratios (current ratio 2.8, quick ratio 2.59) and low leverage (debt-to-equity 0.11) are favorable. The company does not pay dividends, consistent with its negative earnings and focus on growth and R&D.
Which one has the best ratios?
Neither company presents a fully favorable financial profile; MKS Inc. struggles with leverage and profitability, while Ouster faces severe losses despite strong liquidity and low debt. MKS has fewer favorable ratios overall (14.29% vs. 42.86%), but Ouster’s extreme negative margins and return ratios weigh heavily. Both are rated unfavorable globally.
Strategic Positioning
This section compares the strategic positioning of MKS Inc. and Ouster, Inc., including market position, key segments, and exposure to technological disruption:
MKS Inc.
- Large market cap of 12.7B with established presence in hardware and equipment industries.
- Diversified product segments: vacuum control, photonics, equipment solutions, and services.
- Moderate exposure to technological disruption with mature manufacturing process controls.
Ouster, Inc.
- Smaller market cap of 1.6B, focused on emerging lidar sensor technology within hardware sector.
- Concentrated in high-resolution digital lidar sensors and related enabling software products.
- High exposure to disruption through innovative lidar sensor technology for 3D vision applications.
MKS Inc. vs Ouster, Inc. Positioning
MKS Inc. pursues a diversified strategy across multiple industrial and photonics segments, offering stability but facing broad competition. Ouster, Inc. focuses narrowly on lidar sensors, gaining innovation edge but with higher market risk due to concentration.
Which has the best competitive advantage?
Both companies are shedding value with ROIC below WACC; however, Ouster shows improving profitability trends, while MKS faces declining returns, indicating Ouster’s moat is slightly less unfavorable despite current value destruction.
Stock Comparison
The stock price movements of MKS Inc. and Ouster, Inc. over the past year reveal contrasting dynamics, with MKS showing sustained bullish momentum and Ouster experiencing a sharp overall gain followed by recent decline.
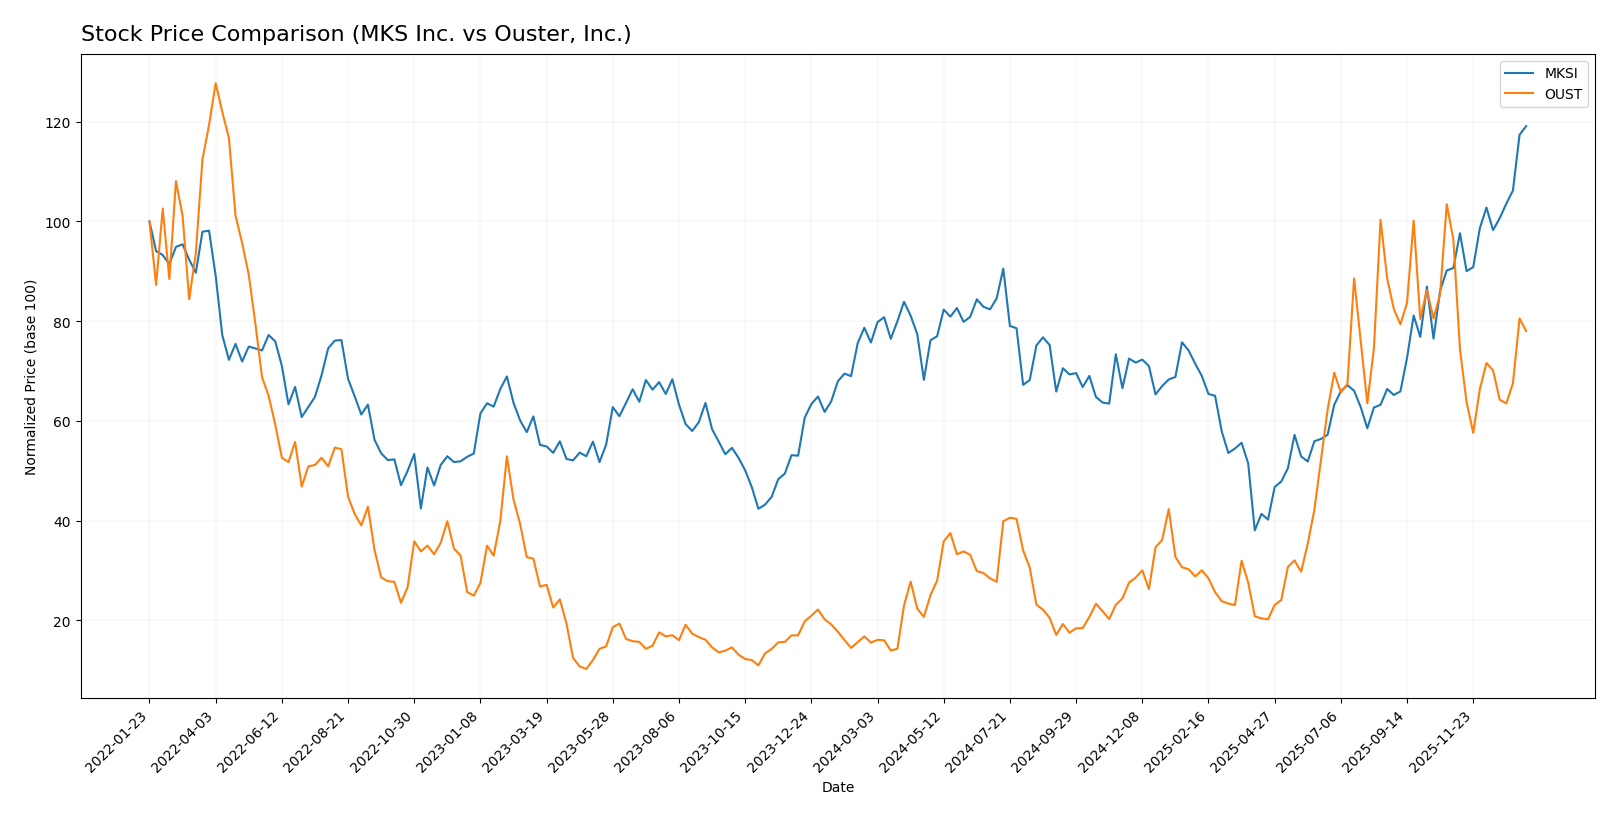
Trend Analysis
MKS Inc. exhibited a strong bullish trend over the past 12 months with a 57.33% price increase and accelerating momentum, reaching a high of 188.84 and showing significant volatility with a 24.26 standard deviation.
Ouster, Inc. recorded an impressive 402.61% gain over the past year but with decelerating momentum; however, its recent trend shows a 19.09% decline and seller dominance, indicating short-term bearish pressure.
Comparing both stocks, Ouster delivered the highest overall market performance despite recent weakness, while MKS maintained steady upward acceleration and stronger recent buyer dominance.
Target Prices
Here is the current consensus on target prices for MKS Inc. and Ouster, Inc. based on reliable analyst data.
| Company | Target High | Target Low | Consensus |
|---|---|---|---|
| MKS Inc. | 215 | 136 | 176.17 |
| Ouster, Inc. | 39 | 33 | 36.67 |
Analysts expect MKS Inc.’s stock to slightly underperform its current price of $189.28, indicating some downside risk. Ouster, Inc.’s consensus target is well above its current price of $27.11, suggesting potential upside.
Analyst Opinions Comparison
This section compares analysts’ ratings and grades for MKS Inc. and Ouster, Inc.:
Rating Comparison
MKS Inc. Rating
- Rating: B-, considered very favorable overall by analysts.
- Discounted Cash Flow Score: Moderate at 3, indicating reasonable valuation.
- ROE Score: Moderate at 3, showing efficient profit generation.
- ROA Score: Moderate at 3, reflecting effective asset utilization.
- Debt To Equity Score: Very unfavorable at 1, indicating high financial risk.
- Overall Score: Moderate at 2, summarizing the company’s standing.
Ouster, Inc. Rating
- Rating: C-, also considered very favorable overall.
- Discounted Cash Flow Score: Very unfavorable at 1, indicating poor valuation.
- ROE Score: Very unfavorable at 1, showing weak profit generation.
- ROA Score: Very unfavorable at 1, reflecting poor asset use.
- Debt To Equity Score: Moderate at 3, indicating balanced financial risk.
- Overall Score: Very unfavorable at 1, indicating weaker financial health.
Which one is the best rated?
Based strictly on the provided data, MKS Inc. is better rated with a B- rating, higher overall and profitability scores, though it carries more financial risk. Ouster, Inc. has generally lower scores except for a better debt-to-equity score.
Scores Comparison
Here is a comparison of the Altman Z-Score and Piotroski Score for MKS Inc. and Ouster, Inc.:
MKS Inc. Scores
- Altman Z-Score: 2.22, in the grey zone, moderate bankruptcy risk.
- Piotroski Score: 7, strong financial health indication.
Ouster, Inc. Scores
- Altman Z-Score: 3.66, in the safe zone, low bankruptcy risk.
- Piotroski Score: 4, average financial health indication.
Which company has the best scores?
Based on the provided scores, Ouster, Inc. has a better Altman Z-Score indicating lower bankruptcy risk, while MKS Inc. shows a stronger Piotroski Score reflecting better overall financial health.
Grades Comparison
Here is a detailed comparison of the recent grades assigned to MKS Inc. and Ouster, Inc.:
MKS Inc. Grades
The following table summarizes the latest grades from reputable grading companies for MKS Inc.:
| Grading Company | Action | New Grade | Date |
|---|---|---|---|
| B of A Securities | Maintain | Buy | 2026-01-13 |
| Needham | Maintain | Buy | 2026-01-13 |
| Mizuho | Maintain | Outperform | 2025-12-17 |
| Citigroup | Maintain | Buy | 2025-11-12 |
| Wells Fargo | Maintain | Equal Weight | 2025-11-07 |
| Keybanc | Maintain | Overweight | 2025-11-07 |
| Benchmark | Maintain | Buy | 2025-11-07 |
| Needham | Maintain | Buy | 2025-11-06 |
| Mizuho | Maintain | Outperform | 2025-10-16 |
| Needham | Maintain | Buy | 2025-10-13 |
MKS Inc. has consistently received positive grades, predominantly “Buy” and “Outperform,” indicating a generally favorable analyst sentiment.
Ouster, Inc. Grades
Below are the recent grades from credible grading firms for Ouster, Inc.:
| Grading Company | Action | New Grade | Date |
|---|---|---|---|
| Cantor Fitzgerald | Upgrade | Overweight | 2025-11-07 |
| Cantor Fitzgerald | Upgrade | Overweight | 2025-11-06 |
| WestPark Capital | Maintain | Buy | 2025-11-05 |
| Rosenblatt | Maintain | Buy | 2025-11-05 |
| WestPark Capital | Upgrade | Buy | 2025-08-13 |
| Oppenheimer | Maintain | Outperform | 2025-07-16 |
| WestPark Capital | Downgrade | Hold | 2025-06-12 |
| WestPark Capital | Upgrade | Buy | 2025-05-09 |
| Rosenblatt | Maintain | Buy | 2025-03-21 |
| Cantor Fitzgerald | Maintain | Overweight | 2025-03-21 |
Ouster, Inc.’s grades show more variability with upgrades and downgrades, but the majority remain Buy or Overweight, reflecting moderate optimism with some caution.
Which company has the best grades?
MKS Inc. has received a more consistent and stronger set of grades, mostly Buy and Outperform, compared to Ouster, Inc., which shows some fluctuation between Buy and Hold. This consistency in MKS Inc.’s grades may indicate steadier analyst confidence potentially appealing to investors seeking stability.
Strengths and Weaknesses
The table below summarizes the key strengths and weaknesses of MKS Inc. (MKSI) and Ouster, Inc. (OUST) based on their financial performance, market position, and operational metrics as of 2026.
| Criterion | MKS Inc. (MKSI) | Ouster, Inc. (OUST) |
|---|---|---|
| Diversification | High: Multiple product divisions and services with steady revenue streams (~$3.1B products, $462M services in 2024) | Low: Primarily focused on a single reportable segment (~$111M in 2024) |
| Profitability | Moderate: Net margin 5.3%, ROIC 6.31%, but ROIC below WACC, indicating value destruction | Poor: Negative net margin (-87.35%), negative ROIC (-50.84%), shedding value though improving ROIC trend |
| Innovation | Established in photonics and vacuum solutions, moderate innovation evidenced by steady product turnover | High growth potential with increasing ROIC trend, but currently unprofitable with significant losses |
| Global presence | Strong: Diversified global customer base across advanced manufacturing sectors | Limited: Smaller scale and emerging market presence |
| Market Share | Solid presence in niche industrial markets with established client base | Emerging player in lidar and sensor technologies, gaining traction but smaller market share |
Key takeaways: MKS Inc. offers diversified revenue and stable, albeit declining, profitability, reflecting some operational challenges. Ouster, while currently unprofitable, shows promising innovation and improving capital efficiency, suggesting potential for future growth if risks are managed carefully.
Risk Analysis
Below is a comparative table of key risks for MKS Inc. (MKSI) and Ouster, Inc. (OUST) based on the most recent 2024 data:
| Metric | MKS Inc. (MKSI) | Ouster, Inc. (OUST) |
|---|---|---|
| Market Risk | Beta 1.92, indicating above-average volatility | Beta 2.94, very high volatility |
| Debt level | High leverage: Debt-to-Equity 2.06, Debt-to-Assets 55.65% | Low leverage: Debt-to-Equity 0.11, Debt-to-Assets 7.33% |
| Regulatory Risk | Moderate, operates in regulated tech sectors | Moderate, emerging lidar tech with evolving standards |
| Operational Risk | Medium, complex manufacturing and supply chains | High, early-stage production and technology risks |
| Environmental Risk | Moderate, industrial processes with some emissions | Lower, but emerging tech may face environmental scrutiny |
| Geopolitical Risk | Moderate, US-based with global supply exposure | Moderate, US-based with international sales |
The most impactful risks are MKS Inc.’s high debt levels and interest coverage concerns, which elevate financial risk despite stable operations. Ouster’s biggest risk lies in its high market volatility and operational challenges as a newer, growth-stage company with substantial losses. Both companies face moderate regulatory and geopolitical uncertainties typical of the technology hardware sector.
Which Stock to Choose?
MKS Inc. (MKSI) shows a generally favorable income statement with a strong gross margin of 47.63% and improving EBIT and net margin growth over one year. However, its financial ratios reveal mostly unfavorable metrics, including a high debt ratio (55.65%) and weak return on equity (8.18%). The company’s rating is very favorable with a B- grade but its MOAT evaluation signals a declining ROIC below WACC, indicating value destruction.
Ouster, Inc. (OUST) presents a favorable income growth profile with substantial revenue and net income increases over the period, despite negative profitability metrics and a deeply negative net margin (-87.35%). Its financial ratios are mixed but include more favorable scores in debt management and liquidity. OUST holds a very favorable rating at C-, with a slightly unfavorable MOAT due to negative ROIC but a positive upward trend in profitability.
Investors seeking growth potential might find Ouster appealing given its strong income growth and improving profitability trend despite current losses. Conversely, those prioritizing stability and stronger ratings may view MKS Inc.’s more consistent income quality and rating more favorably, though its value destruction signals caution. The choice could depend on tolerance for risk and preference for growth versus established financial metrics.
Disclaimer: Investment carries a risk of loss of initial capital. The past performance is not a reliable indicator of future results. Be sure to understand risks before making an investment decision.
Go Further
I encourage you to read the complete analyses of MKS Inc. and Ouster, Inc. to enhance your investment decisions: