MKS Inc. and Novanta Inc. are two prominent players in the hardware, equipment, and parts industry, both specializing in advanced photonics and precision control technologies. While MKS focuses on process control and laser-based systems for semiconductor and industrial markets, Novanta excels in photonics, vision, and precision motion components for medical and industrial applications. This article will analyze their strategies and market positions to help you decide which company is the more attractive investment opportunity.
Table of contents
Companies Overview
I will begin the comparison between MKS Inc. and Novanta Inc. by providing an overview of these two companies and their main differences.
MKS Inc. Overview
MKS Inc. is a technology company specializing in instruments, systems, and process control solutions for manufacturing processes worldwide. It operates through segments including Vacuum & Analysis, Light & Motion, and Equipment & Solutions, serving semiconductor, industrial, life sciences, research, and defense markets. Headquartered in Andover, Massachusetts, MKS has a market cap of 12.7B USD and employs around 10,200 people.
Novanta Inc. Overview
Novanta Inc. designs and manufactures photonics, vision, and precision motion components and sub-systems for medical and industrial markets globally. Its segments include Photonics, Vision, and Precision Motion, offering laser systems, medical technologies, and motion control solutions. Based in Bedford, Massachusetts, Novanta has a market cap of 4.7B USD and employs approximately 3,000 people.
Key similarities and differences
Both companies operate in the technology sector, focusing on hardware, equipment, and parts with applications in industrial and medical fields. MKS offers broader solutions in vacuum, laser, and control systems, while Novanta emphasizes photonics, medical vision, and precision motion components. MKS is significantly larger in market cap and workforce, reflecting a wider market reach and product diversity.
Income Statement Comparison
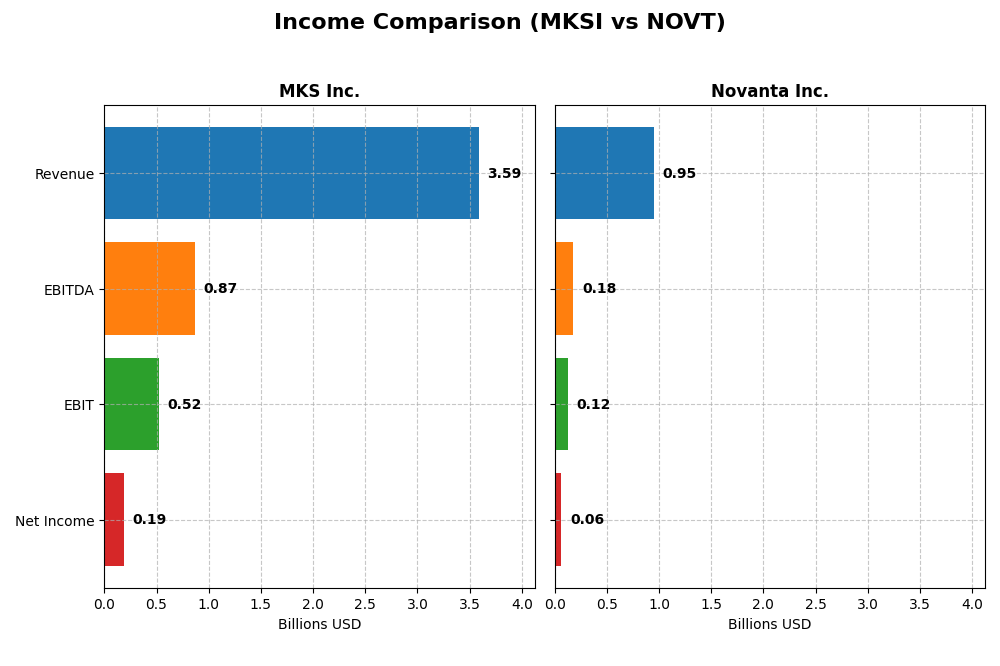
This table presents a side-by-side comparison of the latest fiscal year income statement metrics for MKS Inc. and Novanta Inc., providing key financial figures for 2024.
| Metric | MKS Inc. (MKSI) | Novanta Inc. (NOVT) |
|---|---|---|
| Market Cap | 12.7B | 4.7B |
| Revenue | 3.59B | 949M |
| EBITDA | 870M | 180M |
| EBIT | 522M | 124M |
| Net Income | 190M | 64M |
| EPS | 2.82 | 1.78 |
| Fiscal Year | 2024 | 2024 |
Income Statement Interpretations
MKS Inc.
MKS Inc. showed revenue growth of 53.9% over 2020-2024, but net income declined by 45.7%, reflecting volatility. Margins remain favorable with a gross margin of 47.6% and net margin of 5.3%. In 2024, revenue slightly fell by 1%, but EBIT and net margin improved significantly, indicating better operational efficiency despite top-line pressure.
Novanta Inc.
Novanta Inc. experienced steady revenue growth of 60.7% over the period, with net income rising 44%. Its gross margin of 44.4% and net margin of 6.75% are favorable, with interest expenses well controlled. In 2024, revenue increased 7.7%, while EBIT was stable; however, net margin and EPS declined, suggesting some margin pressure despite top-line gains.
Which one has the stronger fundamentals?
Both companies show favorable overall income statement evaluations with solid gross and EBIT margins. MKS Inc. demonstrates stronger recent margin improvements and operational gains, but with net income volatility. Novanta offers steadier revenue and net income growth with lower interest expense but faces recent margin contraction. Each shows strengths and weaknesses in fundamentals.
Financial Ratios Comparison
Below is a comparison of key financial ratios for MKS Inc. and Novanta Inc. based on their most recent fiscal year data for 2024.
| Ratios | MKS Inc. (MKSI) | Novanta Inc. (NOVT) |
|---|---|---|
| ROE | 8.18% | 8.59% |
| ROIC | 6.31% | 7.25% |
| P/E | 37.0 | 85.7 |
| P/B | 3.03 | 7.37 |
| Current Ratio | 3.19 | 2.58 |
| Quick Ratio | 2.04 | 1.72 |
| D/E (Debt-to-Equity) | 2.06 | 0.63 |
| Debt-to-Assets | 55.6% | 33.9% |
| Interest Coverage | 1.44 | 3.51 |
| Asset Turnover | 0.42 | 0.68 |
| Fixed Asset Turnover | 3.55 | 6.08 |
| Payout Ratio | 31.1% | 0.0% |
| Dividend Yield | 0.84% | 0.0% |
Interpretation of the Ratios
MKS Inc.
MKS Inc. shows a predominance of unfavorable ratios, including a low return on equity (8.18%) and a high debt-to-equity ratio (2.06), indicating financial leverage concerns. The current ratio is high at 3.19 but deemed unfavorable, suggesting possible asset inefficiency. Dividend yield is low at 0.84%, with payouts likely constrained by weak free cash flow to equity (-3.66B), posing sustainability risks.
Novanta Inc.
Novanta Inc. presents a more balanced profile with fewer unfavorable ratios and a higher proportion of neutral metrics. The company’s return on equity stands at 8.59%, slightly better than MKS, but its price-to-earnings ratio of 85.7 suggests high valuation risk. Novanta does not pay dividends, likely prioritizing reinvestment and growth, supported by neutral debt levels and favorable liquidity ratios.
Which one has the best ratios?
Novanta Inc. exhibits a relatively stronger ratio profile with more favorable liquidity and asset turnover metrics, and a lower debt burden compared to MKS Inc. However, both companies face valuation and profitability challenges, with Novanta’s lack of dividend reflecting a growth focus. Overall, Novanta’s ratios are slightly less unfavorable, reflecting a somewhat healthier financial position.
Strategic Positioning
This section compares the strategic positioning of MKS Inc. and Novanta Inc., focusing on market position, key segments, and exposure to technological disruption:
MKS Inc.
- Larger market cap at 12.7B USD, faces competitive pressure in hardware and equipment parts industry.
- Diversified segments: Vacuum & Analysis, Light & Motion, Equipment & Solutions serving semiconductors, industrial, life sciences, and defense.
- Exposure through advanced laser, photonics, and vacuum control products with evolving manufacturing tech.
Novanta Inc.
- Smaller market cap at 4.7B USD, competes in photonics and precision components markets.
- Concentrated segments: Photonics, Vision, Precision Motion targeting medical and industrial OEMs.
- Exposure via photonics-based lasers, vision tech, and precision motion in medical and industrial fields.
MKS Inc. vs Novanta Inc. Positioning
MKS operates a diversified business model across multiple industrial segments, benefiting from scale but facing broader market challenges. Novanta focuses on fewer specialized segments, leveraging niche expertise but with less revenue scale.
Which has the best competitive advantage?
Both companies currently shed value as ROIC is below WACC; MKS shows a very unfavorable declining ROIC, while Novanta’s slightly unfavorable status reflects improving profitability, indicating a modestly stronger competitive moat for Novanta.
Stock Comparison
The stock prices of MKS Inc. and Novanta Inc. over the past year reveal contrasting dynamics, with MKS showing strong gains and Novanta facing declines, highlighting divergent market sentiment and trading activity.
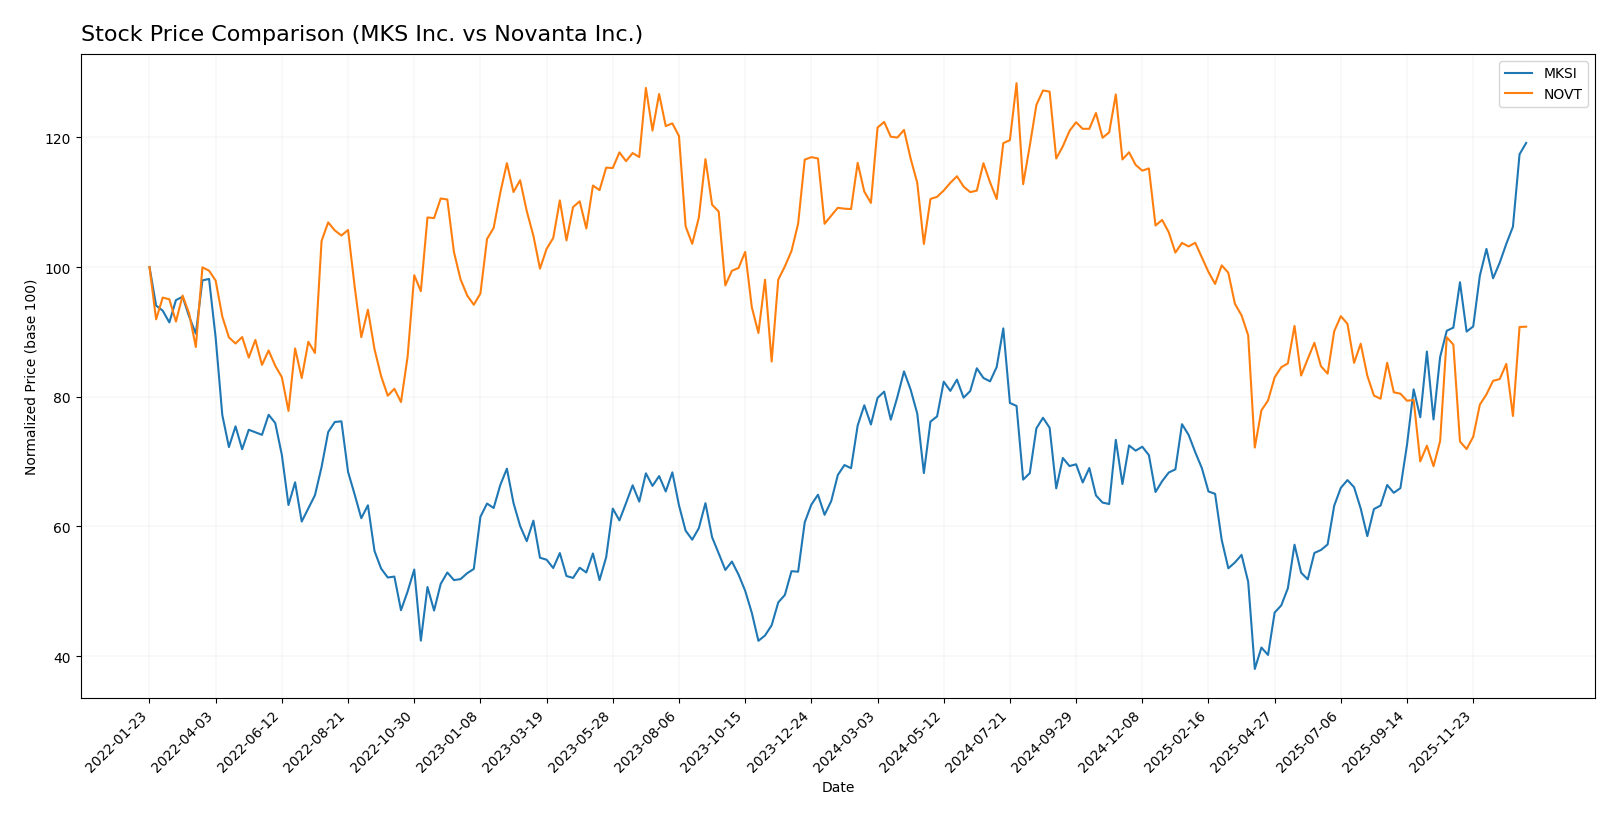
Trend Analysis
MKS Inc. exhibited a bullish trend over the past 12 months with a 57.33% price increase and accelerating momentum. The stock’s price ranged from a low of 60.29 to a high of 188.84, marked by high volatility (24.26 std deviation).
Novanta Inc. showed a bearish trend over the same period with a 17.37% price decline despite accelerating trend behavior. Price fluctuated between 99.96 and 185.16, with volatility near 25.04 std deviation. Recent months saw a mild positive change of 3.14%.
Comparing both stocks, MKS delivered the highest market performance with a robust 57.33% gain, contrasting Novanta’s 17.37% loss, reflecting stronger buyer dominance and volume trends in MKS.
Target Prices
The current analyst consensus provides clear target price ranges for MKS Inc. and Novanta Inc., reflecting varied expectations.
| Company | Target High | Target Low | Consensus |
|---|---|---|---|
| MKS Inc. | 215 | 136 | 176.17 |
| Novanta Inc. | 160 | 160 | 160 |
Analysts expect MKS Inc. to trade moderately above its current price of $189.24, while Novanta Inc.’s consensus target of $160 suggests upside potential compared to its current price of $131.16.
Analyst Opinions Comparison
This section compares analysts’ ratings and grades for MKS Inc. and Novanta Inc.:
Rating Comparison
MKS Inc. Rating
- Rating: B-, considered very favorable by analysts.
- Discounted Cash Flow Score: 3, indicating moderate value assessment.
- ROE Score: 3, showing moderate efficiency in profit generation from equity.
- ROA Score: 3, reflecting moderate asset utilization effectiveness.
- Debt To Equity Score: 1, a very unfavorable indicator of financial risk.
- Overall Score: 2, a moderate summary rating.
Novanta Inc. Rating
- Rating: C+, also rated very favorable by analysts.
- Discounted Cash Flow Score: 3, also indicating moderate value assessment.
- ROE Score: 3, similarly moderate efficiency in profit generation from equity.
- ROA Score: 3, equal moderate asset utilization effectiveness.
- Debt To Equity Score: 1, equally very unfavorable financial risk indicator.
- Overall Score: 2, also a moderate summary rating.
Which one is the best rated?
Both MKS Inc. and Novanta Inc. share identical moderate scores across key financial metrics and overall rating. MKS holds a slightly higher rating grade (B- versus C+), but both are considered very favorable by analysts.
Scores Comparison
Here is a comparison of the Altman Z-Score and Piotroski Score for MKS Inc. and Novanta Inc.:
MKS Scores
- Altman Z-Score: 2.22, indicating moderate bankruptcy risk in grey zone
- Piotroski Score: 7, reflecting strong financial health
Novanta Scores
- Altman Z-Score: 5.39, indicating low bankruptcy risk in safe zone
- Piotroski Score: 6, reflecting average financial health
Which company has the best scores?
Novanta has a safer Altman Z-Score in the safe zone, while MKS has a stronger Piotroski Score. Based strictly on these scores, Novanta shows lower bankruptcy risk, but MKS demonstrates stronger financial health.
Grades Comparison
The following presents the latest verified grades for MKS Inc. and Novanta Inc.:
MKS Inc. Grades
This table summarizes the recent grades assigned to MKS Inc. by reputable grading companies.
| Grading Company | Action | New Grade | Date |
|---|---|---|---|
| B of A Securities | Maintain | Buy | 2026-01-13 |
| Needham | Maintain | Buy | 2026-01-13 |
| Mizuho | Maintain | Outperform | 2025-12-17 |
| Citigroup | Maintain | Buy | 2025-11-12 |
| Wells Fargo | Maintain | Equal Weight | 2025-11-07 |
| Keybanc | Maintain | Overweight | 2025-11-07 |
| Benchmark | Maintain | Buy | 2025-11-07 |
| Needham | Maintain | Buy | 2025-11-06 |
| Mizuho | Maintain | Outperform | 2025-10-16 |
| Needham | Maintain | Buy | 2025-10-13 |
Overall, MKS Inc. maintains a predominantly positive rating trend, with several “Buy” and “Outperform” grades reflecting a generally favorable outlook.
Novanta Inc. Grades
This table shows the recent grades for Novanta Inc. from recognized grading firms.
| Grading Company | Action | New Grade | Date |
|---|---|---|---|
| Baird | Maintain | Neutral | 2025-08-11 |
| Baird | Maintain | Neutral | 2025-03-03 |
| Baird | Maintain | Neutral | 2024-11-06 |
| Baird | Maintain | Neutral | 2024-08-07 |
| Baird | Maintain | Neutral | 2023-05-11 |
| Baird | Maintain | Neutral | 2023-05-10 |
| William Blair | Upgrade | Outperform | 2022-05-11 |
| William Blair | Upgrade | Outperform | 2022-05-10 |
| Berenberg | Maintain | Hold | 2020-11-13 |
| Baird | Maintain | Neutral | 2020-05-13 |
Novanta Inc. shows a stable rating pattern with mostly “Neutral” and some “Outperform” grades, indicating a cautious but slightly positive stance.
Which company has the best grades?
MKS Inc. holds significantly stronger grades with multiple “Buy” and “Outperform” ratings, compared to Novanta Inc.’s predominately “Neutral” grades. This suggests MKS Inc. is viewed more favorably by analysts, which may influence investor sentiment and portfolio considerations.
Strengths and Weaknesses
Below is a comparison of key strengths and weaknesses for MKS Inc. (MKSI) and Novanta Inc. (NOVT) based on their recent financial and operational data.
| Criterion | MKS Inc. (MKSI) | Novanta Inc. (NOVT) |
|---|---|---|
| Diversification | Broad product range including vacuum, photonics, and equipment | Focused on precision manufacturing, robotics, advanced surgery |
| Profitability | ROIC 6.31% but below WACC (11.04%), value destroying, net margin 5.3% | ROIC 7.25%, below WACC (10.82%), slightly unfavorable, net margin 6.75% |
| Innovation | Moderate innovation in vacuum and photonics sectors | Strong innovation focus in precision medicine and robotics |
| Global presence | Established with diverse industrial solutions globally | Global but more niche medical and industrial applications |
| Market Share | Solid in vacuum and photonics markets | Growing presence in medical and automation sectors |
Key takeaways: MKS Inc. maintains a broad product portfolio but struggles with profitability and value creation. Novanta shows improving profitability trends with a focus on innovative medical and automation technologies, offering a more promising growth trajectory despite current slight value destruction. Both require cautious consideration due to profitability concerns.
Risk Analysis
Below is a comparative table highlighting key risks for MKS Inc. (MKSI) and Novanta Inc. (NOVT) based on the latest 2024 data:
| Metric | MKS Inc. (MKSI) | Novanta Inc. (NOVT) |
|---|---|---|
| Market Risk | High beta 1.92, volatile price range | Moderate beta 1.60, less volatile |
| Debt level | High debt-to-equity 2.06, debt/assets 55.65% (unfavorable) | Moderate debt-to-equity 0.63, debt/assets 33.92% (neutral) |
| Regulatory Risk | Moderate; operates in tech/manufacturing with compliance demands | Moderate; medical and industrial markets face regulatory scrutiny |
| Operational Risk | Medium; complexity in diverse tech segments | Medium; diversified photonics and precision motion components |
| Environmental Risk | Moderate; manufacturing processes may impact environment | Moderate; industrial and medical equipment manufacturing impacts |
| Geopolitical Risk | Moderate; supply chain exposure in global markets | Moderate; global market exposure with medical tech |
Both companies face notable market and operational risks typical of technology hardware industries. MKS shows higher financial leverage, implying greater debt-related risk, while Novanta carries a more moderate debt profile. The most impactful risk for MKS is its elevated debt level combined with a high beta, increasing vulnerability to market downturns. For Novanta, valuation risks are significant due to a high P/E ratio, suggesting sensitivity to market sentiment shifts. Investors should weigh these risks carefully in portfolio decisions.
Which Stock to Choose?
MKS Inc. (MKSI) shows a mixed income evolution with a slight revenue decline recently but favorable gross and EBIT margins. Its profitability ratios are generally low, with an ROE at 8.18% and a declining ROIC below its WACC, signaling value destruction. Debt levels are high, reflected in unfavorable leverage ratios and a moderate credit rating (B-).
Novanta Inc. (NOVT) exhibits steady revenue growth and favorable gross and EBIT margins. Profitability is moderate, with ROE at 8.59% and a slightly improving ROIC though still below WACC, indicating slight value erosion. Debt is more conservatively managed than MKSI, with neutral leverage ratios and a comparable rating (C+).
For investors, MKSI’s stronger income statement performance contrasts with its unfavorable leverage and value destruction, while NOVT offers steadier growth and improving profitability with better debt metrics. Risk-tolerant investors seeking growth might find MKSI’s profile appealing, whereas risk-averse investors prioritizing financial stability may lean toward NOVT’s more balanced fundamentals.
Disclaimer: Investment carries a risk of loss of initial capital. The past performance is not a reliable indicator of future results. Be sure to understand risks before making an investment decision.
Go Further
I encourage you to read the complete analyses of MKS Inc. and Novanta Inc. to enhance your investment decisions: