In the dynamic world of technology hardware, MKS Inc. and MicroVision, Inc. stand out as innovators with distinct but overlapping market focuses. MKS Inc. provides advanced instrumentation and control solutions primarily for manufacturing processes, while MicroVision specializes in lidar sensors and scanning technologies for automotive safety and augmented reality. This article will analyze both companies to help you decide which presents the most compelling investment opportunity in 2026.
Table of contents
Companies Overview
I will begin the comparison between MKS Inc. and MicroVision, Inc. by providing an overview of these two companies and their main differences.
MKS Inc. Overview
MKS Inc. provides instruments, systems, and process control solutions that measure, monitor, and control manufacturing processes globally. It operates in segments including Vacuum & Analysis, Light & Motion, and Equipment & Solutions, serving semiconductor, industrial technology, life sciences, research, and defense markets. Founded in 1961 and headquartered in Andover, Massachusetts, MKS is a well-established player in the hardware and equipment industry with over 10K employees.
MicroVision, Inc. Overview
MicroVision develops lidar sensors and laser beam scanning technology for automotive safety, autonomous driving, and augmented reality applications. Its offerings include micro-displays for AR headsets, interactive display modules, and consumer lidar for smart home systems. Founded in 1993 and based in Redmond, Washington, MicroVision employs 185 people and primarily sells to original equipment and design manufacturers within the technology hardware sector.
Key similarities and differences
Both companies operate in the hardware and equipment industry, focusing on advanced technological solutions. MKS has a broader portfolio covering process control and laser-based manufacturing systems across multiple sectors, while MicroVision specializes in lidar and scanning technologies for automotive and AR applications. MKS is significantly larger in market cap and workforce, reflecting its established market presence compared to MicroVision’s niche focus and smaller scale.
Income Statement Comparison
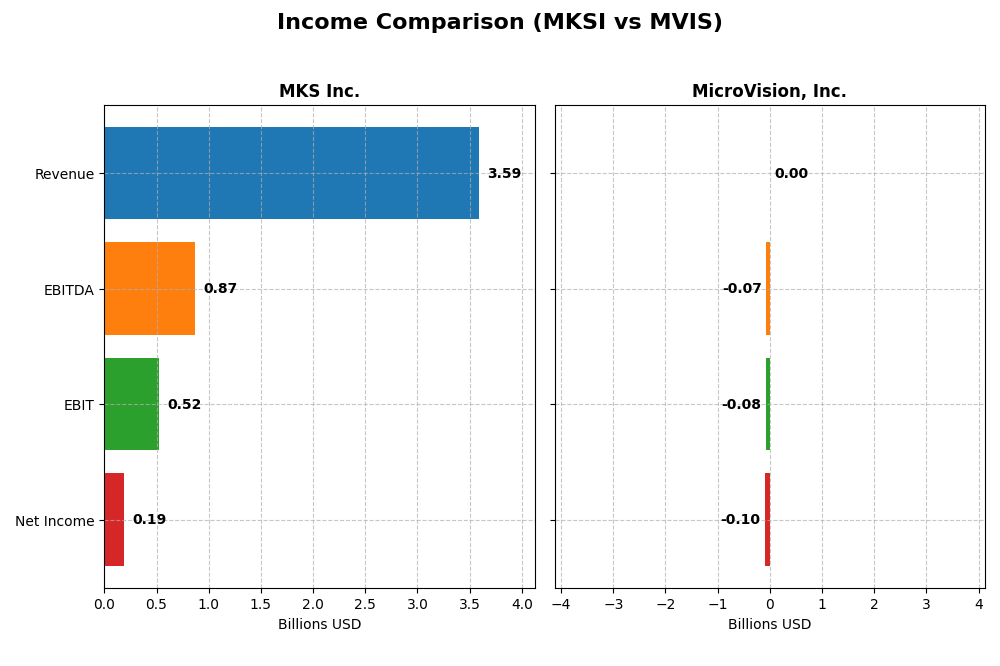
The table below compares key income statement metrics for MKS Inc. and MicroVision, Inc. for the fiscal year 2024, presenting a clear snapshot of their financial performance.
| Metric | MKS Inc. | MicroVision, Inc. |
|---|---|---|
| Market Cap | 12.7B | 292M |
| Revenue | 3.59B | 4.70M |
| EBITDA | 870M | -71M |
| EBIT | 522M | -75M |
| Net Income | 190M | -97M |
| EPS | 2.82 | -0.46 |
| Fiscal Year | 2024 | 2024 |
Income Statement Interpretations
MKS Inc.
MKS Inc. showed a revenue growth of 53.91% over 2020-2024, though 2024 revenue slightly declined by 0.99%. Net income experienced a significant overall decrease of 45.71%, with a net margin contraction of 64.73%. In 2024, the company reversed previous losses, improving EBIT by 134.66% and net margin by 110.42%, signaling a recovery in profitability despite stable margins overall.
MicroVision, Inc.
MicroVision’s revenue grew 51.97% over the five-year period but dropped 35.31% in 2024. The company reported persistent net losses, with net income declining by over 610% overall, and net margin remaining deeply negative. Despite a modest 14.85% EBIT growth in 2024, the gross margin and net margin deteriorated sharply, reflecting ongoing challenges in controlling costs relative to revenue.
Which one has the stronger fundamentals?
MKS Inc. exhibits stronger fundamentals, supported by favorable gross, EBIT, and net margins alongside a positive earnings recovery in 2024. Conversely, MicroVision faces unfavorable margins, persistent net losses, and steep declines in profitability metrics despite revenue growth. Overall, MKS’s income statement reflects a more stable and improving financial condition over the period analyzed.
Financial Ratios Comparison
Below is a comparison of key financial ratios for MKS Inc. and MicroVision, Inc. based on their most recent fiscal year data.
| Ratios | MKS Inc. (MKSI) | MicroVision, Inc. (MVIS) |
|---|---|---|
| ROE | 8.18% | -198.72% |
| ROIC | 6.31% | -83.73% |
| P/E | 37.0 | -2.83 |
| P/B | 3.03 | 5.63 |
| Current Ratio | 3.19 | 1.79 |
| Quick Ratio | 2.04 | 1.74 |
| D/E (Debt-to-Equity) | 2.06 | 1.06 |
| Debt-to-Assets | 55.6% | 42.6% |
| Interest Coverage | 1.44 | -19.19 |
| Asset Turnover | 0.42 | 0.04 |
| Fixed Asset Turnover | 3.55 | 0.20 |
| Payout Ratio | 31.1% | 0% |
| Dividend Yield | 0.84% | 0% |
Interpretation of the Ratios
MKS Inc.
MKS Inc. shows mostly unfavorable ratios, with concerns around its high debt levels (debt to equity 2.06, debt to assets 55.65%) and weak returns (ROE 8.18%, below WACC 11.04%). The current ratio is above 3 but considered unfavorable, while the quick ratio is favorable at 2.04. The company pays dividends but with a low yield (0.84%) and payout risks due to limited free cash flow coverage.
MicroVision, Inc.
MicroVision’s ratios are predominantly unfavorable, with extremely negative profitability metrics (net margin -2063.78%, ROE -198.72%) and poor asset turnover (0.04). Liquidity ratios are favorable (current ratio 1.79, quick ratio 1.74), but interest coverage is deeply negative (-16.87). The company does not pay dividends, reflecting its focus on reinvestment and ongoing development, typical for its high R&D intensity.
Which one has the best ratios?
Both companies face significant challenges in their ratios, but MKS Inc. shows somewhat better profitability and liquidity metrics compared to MicroVision. However, MKS’s high leverage and weak returns remain concerns. MicroVision’s deeply negative returns and cash flow metrics highlight ongoing operational difficulties, despite better liquidity. Overall, neither company presents a fully favorable ratio profile.
Strategic Positioning
This section compares the strategic positioning of MKS Inc. and MicroVision, Inc., including market position, key segments, and exposure to technological disruption:
MKS Inc.
- Large market cap of 12.7B in hardware, facing moderate competitive pressure with diverse products.
- Diverse product segments: vacuum control, photonics, laser systems, and equipment solutions.
- Moderate exposure to disruption with established manufacturing process control and laser tech.
MicroVision, Inc.
- Smaller market cap of 292M, operating in hardware with niche focus, facing competitive pressure in lidar.
- Focused on lidar sensors, laser scanning, micro-displays, and AR headset technologies.
- High exposure to disruption, developing emerging lidar and AR scanning technologies.
MKS Inc. vs MicroVision, Inc. Positioning
MKS Inc. pursues a diversified strategy across multiple manufacturing technologies, offering stability but facing broad competition. MicroVision concentrates on innovative lidar and AR solutions, presenting growth potential with higher technological risk.
Which has the best competitive advantage?
Neither company currently exhibits a strong competitive advantage; MKS is shedding value with declining returns, while MicroVision also sheds value but shows improving profitability trends.
Stock Comparison
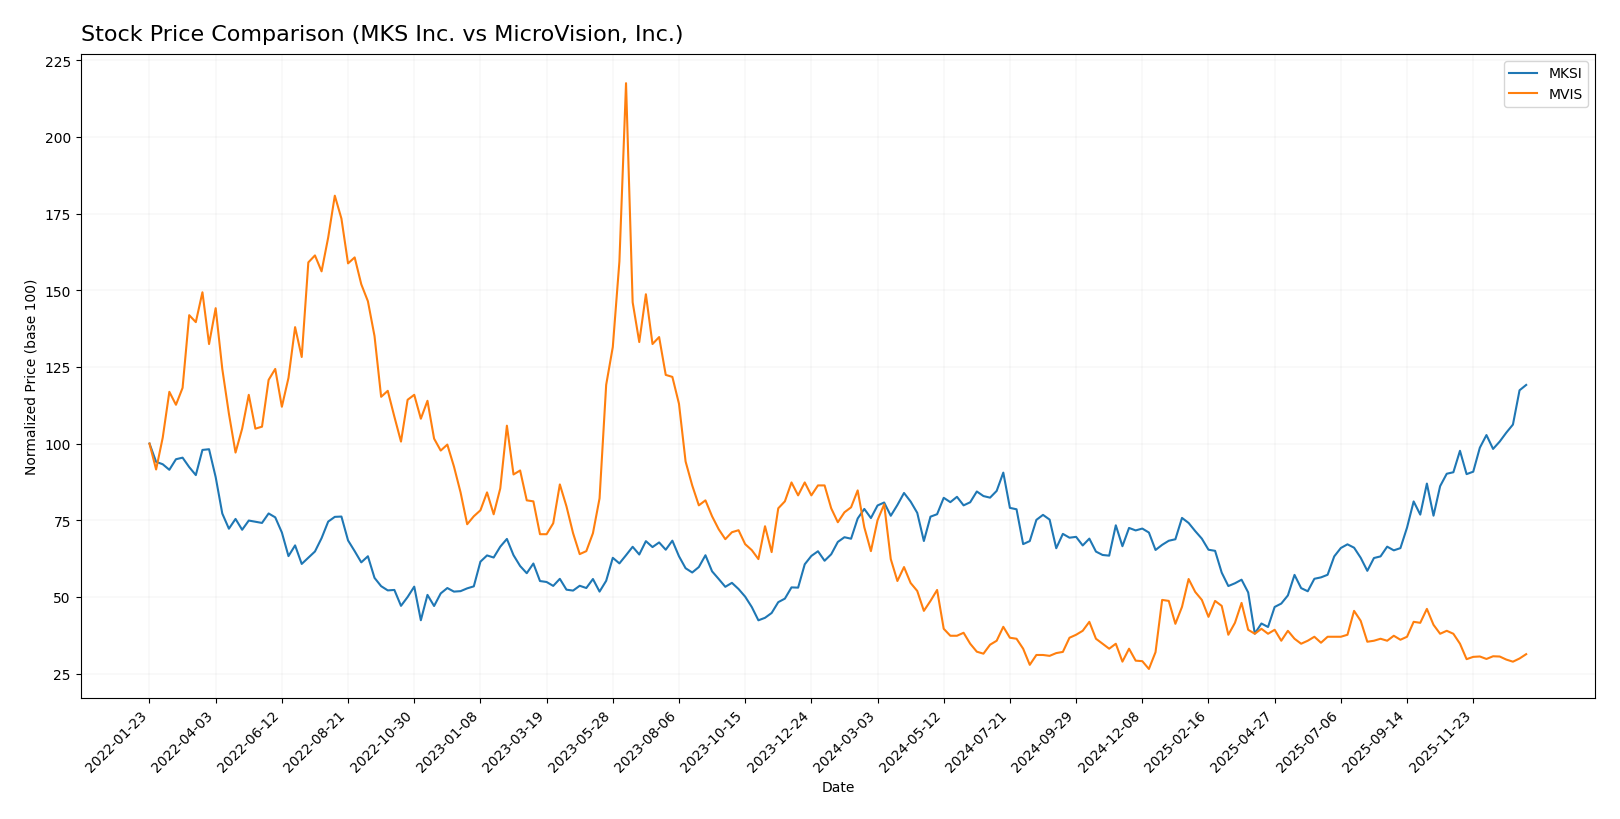
The stock price movements of MKS Inc. and MicroVision, Inc. over the past year reveal contrasting dynamics, with MKS showing strong upward momentum and MicroVision experiencing significant decline.
Trend Analysis
MKS Inc. demonstrated a bullish trend over the past 12 months with a 57.33% price increase, showing acceleration and notable volatility with a standard deviation of 24.26. The stock reached a high of 188.84 and a low of 60.29.
MicroVision, Inc. exhibited a bearish trend with a 51.74% price decline over the same period, accompanied by deceleration and low volatility at 0.29 standard deviation. Its highest and lowest prices were 2.47 and 0.82 respectively.
Comparing both, MKS Inc. delivered the highest market performance with a strong positive gain, while MicroVision, Inc. faced a substantial downturn and weaker buyer interest.
Target Prices
Analysts provide a clear consensus on target prices for the companies covered.
| Company | Target High | Target Low | Consensus |
|---|---|---|---|
| MKS Inc. | 215 | 136 | 176.17 |
| MicroVision, Inc. | 5 | 5 | 5 |
For MKS Inc., the consensus target price of 176.17 USD is slightly below the current stock price of 189.42 USD, indicating moderate downside potential. MicroVision’s target consensus at 5 USD suggests significant upside from its current price near 0.96 USD, reflecting bullish analyst expectations.
Analyst Opinions Comparison
This section compares analysts’ ratings and grades for MKS Inc. and MicroVision, Inc.:
Rating Comparison
MKS Inc. Rating
- Rating: B- indicating a very favorable overall evaluation.
- Discounted Cash Flow Score: 3, rated moderate, suggesting average valuation outlook.
- ROE Score: 3, moderate, showing decent profit generation from equity.
- ROA Score: 3, moderate, reflecting effective asset utilization.
- Debt To Equity Score: 1, very unfavorable, indicating higher financial risk.
- Overall Score: 2, moderate, representing average financial standing.
MicroVision, Inc. Rating
- Rating: C- indicating a very favorable overall evaluation.
- Discounted Cash Flow Score: 1, very unfavorable, indicating poor valuation.
- ROE Score: 1, very unfavorable, indicating weak profit generation.
- ROA Score: 1, very unfavorable, showing poor asset efficiency.
- Debt To Equity Score: 2, moderate, suggesting better financial stability.
- Overall Score: 1, very unfavorable, indicating weak overall financial health.
Which one is the best rated?
Based strictly on the provided data, MKS Inc. holds a better overall rating and stronger scores in discounted cash flow, ROE, and ROA. MicroVision, Inc. has a slightly better debt-to-equity score but weaker overall and financial performance scores.
Scores Comparison
Here is a comparison of the Altman Z-Score and Piotroski Score for the two companies:
MKS Scores
- Altman Z-Score: 2.22, placing MKS in the grey zone, moderate bankruptcy risk.
- Piotroski Score: 7, indicating strong financial health.
MicroVision Scores
- Altman Z-Score: -6.42, placing MicroVision in the distress zone, high bankruptcy risk.
- Piotroski Score: 1, indicating very weak financial health.
Which company has the best scores?
Based on the data, MKS shows better financial stability with a grey zone Altman Z-Score and a strong Piotroski Score. MicroVision’s scores indicate high financial distress and very weak health.
Grades Comparison
Here is a detailed comparison of recent grades assigned to MKS Inc. and MicroVision, Inc.:
MKS Inc. Grades
The following table summarizes recent grades from established grading companies for MKS Inc.:
| Grading Company | Action | New Grade | Date |
|---|---|---|---|
| B of A Securities | Buy | Buy | 2026-01-13 |
| Needham | Buy | Buy | 2026-01-13 |
| Mizuho | Maintain | Outperform | 2025-12-17 |
| Citigroup | Buy | Buy | 2025-11-12 |
| Wells Fargo | Hold | Equal Weight | 2025-11-07 |
| Keybanc | Buy | Overweight | 2025-11-07 |
| Benchmark | Buy | Buy | 2025-11-07 |
| Needham | Buy | Buy | 2025-11-06 |
| Mizuho | Maintain | Outperform | 2025-10-16 |
| Needham | Buy | Buy | 2025-10-13 |
MKS Inc. consistently maintains a positive outlook with multiple buy and outperform ratings from reliable grading firms over recent months.
MicroVision, Inc. Grades
Below is a summary of recent grades from recognized grading companies for MicroVision, Inc.:
| Grading Company | Action | New Grade | Date |
|---|---|---|---|
| D. Boral Capital | Buy | Buy | 2025-12-16 |
| D. Boral Capital | Buy | Buy | 2025-11-12 |
| WestPark Capital | Buy | Buy | 2025-10-21 |
| WestPark Capital | Buy | Buy | 2025-09-05 |
| D. Boral Capital | Buy | Buy | 2025-09-02 |
| WestPark Capital | Buy | Buy | 2025-08-27 |
| D. Boral Capital | Buy | Buy | 2025-08-11 |
| D. Boral Capital | Buy | Buy | 2025-05-21 |
| D. Boral Capital | Buy | Buy | 2025-05-13 |
| WestPark Capital | Buy | Buy | 2025-03-27 |
MicroVision, Inc. shows a uniform buy rating trend from its grading companies, signaling consistent positive sentiment.
Which company has the best grades?
Both MKS Inc. and MicroVision, Inc. have received predominantly buy ratings, but MKS Inc. displays a broader range of positive grades, including outperform and overweight ratings from major institutions. This wider recognition may suggest a stronger consensus on MKS’s growth potential, which could influence investor confidence differently compared to MicroVision’s uniformly positive but narrower grading pattern.
Strengths and Weaknesses
Below is a comparison of key strengths and weaknesses for MKS Inc. (MKSI) and MicroVision, Inc. (MVIS) based on their recent financial and operational data.
| Criterion | MKS Inc. (MKSI) | MicroVision, Inc. (MVIS) |
|---|---|---|
| Diversification | High: Broad product portfolio across photonics, vacuum, and equipment segments generating $3.1B product revenue and $462M services (2024) | Low: Revenue primarily from product sales ($4.1M) and licenses, less diversified |
| Profitability | Moderate: Net margin 5.3%, ROIC 6.31% but declining profitability, shedding value (ROIC < WACC) | Poor: Negative net margin (-2064%), negative ROIC (-83.7%), shedding value but improving ROIC trend |
| Innovation | Strong: Focus on advanced manufacturing and photonics solutions supporting diverse industries | Moderate: Focus on innovative lidar and sensing tech, yet financial performance weak |
| Global presence | Established global presence with multiple divisions and solid service segment | Smaller scale, more niche market focus, limited global reach |
| Market Share | Significant in specialized industrial markets, supported by steady product revenues | Niche player in sensing technologies, market share limited by competition and scale |
Key takeaway: MKS Inc. offers greater diversification and steadier revenue streams but struggles with declining profitability and value creation. MicroVision shows innovation potential with improving ROIC trends but faces significant financial challenges and lacks diversification. Investors should weigh stability against growth risks carefully.
Risk Analysis
Below is a comparative table highlighting key risks for MKS Inc. (MKSI) and MicroVision, Inc. (MVIS) based on their latest financial and operational data from 2024.
| Metric | MKS Inc. (MKSI) | MicroVision, Inc. (MVIS) |
|---|---|---|
| Market Risk | Beta 1.92 – higher volatility | Beta 1.27 – moderate volatility |
| Debt level | High leverage: DE 2.06, 56% debt-to-assets | Moderate leverage: DE 1.06, 43% debt-to-assets |
| Regulatory Risk | Moderate – tech & industrial regulations | Moderate – automotive & AR tech regulations |
| Operational Risk | Complex manufacturing processes | Niche tech with R&D execution risks |
| Environmental Risk | Moderate – industrial manufacturing footprint | Low – primarily tech and sensor products |
| Geopolitical Risk | US-based, exposed to supply chain disruptions | US-based, global automotive supply exposure |
Synthesis: MKS Inc. carries significant financial risk from high debt and moderate operational complexity, with a moderate chance of financial distress (Altman Z-score 2.22, grey zone). MicroVision faces critical financial instability with a distress-level Altman Z-score (-6.42) and weak profitability metrics, increasing bankruptcy risk. Market volatility impacts both, but debt and operational execution are the most impactful risks for investors to consider.
Which Stock to Choose?
MKS Inc. (MKSI) shows stable income quality with a favorable gross margin of 47.63% and a positive EBIT margin of 14.56%. Despite a slight revenue decline in 2024, profitability improved significantly, though its debt levels and current ratio remain unfavorable, reflected in a very favorable B- rating.
MicroVision, Inc. (MVIS) faces significant challenges with a deeply negative net margin of -2063.78% and poor profitability indicators. Its financial ratios reveal unfavorable leverage and coverage metrics, despite a neutral WACC and some favorable liquidity ratios; overall, it holds a very favorable C- rating but shows financial distress.
For investors, MKSI might appear more favorable due to its improving income statement and stronger financial ratios despite some debt concerns, while MVIS could be seen as riskier but with potential for turnaround given its improving ROIC trend; choice may depend on risk tolerance and preference for stability versus speculative growth.
Disclaimer: Investment carries a risk of loss of initial capital. The past performance is not a reliable indicator of future results. Be sure to understand risks before making an investment decision.
Go Further
I encourage you to read the complete analyses of MKS Inc. and MicroVision, Inc. to enhance your investment decisions: