In the fast-evolving world of technology hardware, MKS Inc. and Mesa Laboratories, Inc. stand out with their innovative solutions in process control and life sciences tools. Both companies operate in overlapping sectors, focusing on precision instruments and quality control, yet differ in market scale and specialization. This comparison will help investors understand which company offers the most compelling opportunity for growth and stability in 2026. Let’s explore which stock deserves a place in your portfolio.
Table of contents
Companies Overview
I will begin the comparison between MKS Inc. and Mesa Laboratories, Inc. by providing an overview of these two companies and their main differences.
MKS Inc. Overview
MKS Inc. specializes in instruments, systems, and process control solutions that measure, monitor, and control critical manufacturing parameters globally. Its product portfolio includes vacuum and analysis, power solutions, laser products, and laser-based systems primarily serving semiconductor, industrial technologies, life sciences, research, and defense markets. The company is headquartered in Andover, Massachusetts, and operates with about 10,200 employees.
Mesa Laboratories, Inc. Overview
Mesa Laboratories develops and sells life sciences tools and quality control products across multiple regions, including the US, Europe, and Asia Pacific. Its segments cover sterilization control, biopharmaceutical development, calibration solutions, and clinical genomics, serving industries such as healthcare, pharmaceuticals, and medical devices. Headquartered in Lakewood, Colorado, the company employs approximately 736 people.
Key similarities and differences
Both companies operate in the technology sector within the hardware, equipment, and parts industry, focusing on specialized instruments and solutions for health, safety, and manufacturing processes. However, MKS Inc. has a broader industrial and defense market focus with a larger workforce and product diversity, while Mesa Laboratories concentrates on life sciences and clinical applications with a smaller scale and more targeted product lines.
Income Statement Comparison
The following table presents a side-by-side comparison of key income statement metrics for MKS Inc. and Mesa Laboratories, Inc. based on their most recent fiscal year data.
| Metric | MKS Inc. (MKSI) | Mesa Laboratories, Inc. (MLAB) |
|---|---|---|
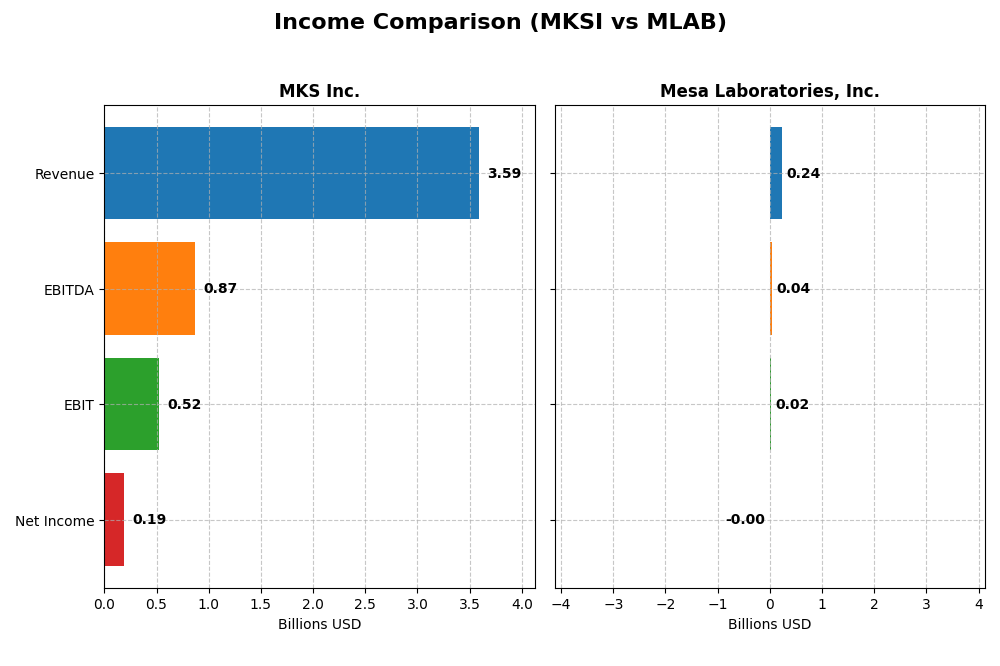
| Market Cap | 12.7B | 469M |
| Revenue | 3.59B | 241M |
| EBITDA | 870M | 42M |
| EBIT | 522M | 18M |
| Net Income | 190M | -2M |
| EPS | 2.82 | -0.36 |
| Fiscal Year | 2024 | 2025 |
Income Statement Interpretations
MKS Inc.
MKS Inc. demonstrated a steady revenue increase of 53.9% over 2020-2024, although it saw a slight 0.99% revenue decline in 2024. Net income fluctuated significantly, with a sharp loss in 2023 but a rebound to $190M in 2024. Margins showed mixed trends: gross margin remained favorable at 47.63%, EBIT margin improved notably, and net margin grew strongly in 2024 despite an overall decline over the period.
Mesa Laboratories, Inc.
Mesa Laboratories reported a 79.9% revenue growth over 2021-2025, with an 11.5% increase in 2025 alone. Net income was volatile, suffering heavy losses overall and a negative net margin of -0.82% in 2025. Gross margin was solid at 62.61%, while EBIT margin remained neutral at 7.39%. The company experienced significant improvement in EBIT and net margin growth in the latest year, indicating operational progress.
Which one has the stronger fundamentals?
Both companies exhibit favorable overall income statement evaluations, with MKS Inc. showing robust margin recovery and stable revenue growth despite recent setbacks. Mesa Laboratories boasts higher gross margins and recent revenue acceleration but carries consistent net losses and weak profitability. MKS’s mixed but improving profitability contrasts with Mesa’s positive operational trends offset by ongoing net income challenges.
Financial Ratios Comparison
The table below compares key financial ratios for MKS Inc. and Mesa Laboratories, Inc. based on the most recent available fiscal data.
| Ratios | MKS Inc. (MKSI) 2024 | Mesa Laboratories, Inc. (MLAB) 2025 |
|---|---|---|
| ROE | 8.18% | -1.24% |
| ROIC | 6.31% | -1.45% |
| P/E | 37.0 | -326.3 |
| P/B | 3.03 | 4.03 |
| Current Ratio | 3.19 | 0.63 |
| Quick Ratio | 2.04 | 0.47 |
| D/E (Debt-to-Equity) | 2.06 | 1.14 |
| Debt-to-Assets | 55.6% | 41.9% |
| Interest Coverage | 1.44 | 1.38 |
| Asset Turnover | 0.42 | 0.56 |
| Fixed Asset Turnover | 3.55 | 7.45 |
| Payout Ratio | 31.1% | -175.7% |
| Dividend Yield | 0.84% | 0.54% |
Interpretation of the Ratios
MKS Inc.
MKS Inc. shows mostly unfavorable ratios with only 14.29% favorable and 71.43% unfavorable, indicating potential financial weaknesses. Key concerns include high debt levels, weak return on equity (8.18%), and an elevated price-to-earnings ratio (36.98). The company pays a dividend with a 0.84% yield, but the payout appears risky due to limited coverage from free cash flow and high leverage.
Mesa Laboratories, Inc.
Mesa Laboratories also presents an unfavorable ratio profile, though slightly better with 21.43% favorable and 64.29% unfavorable ratios. It struggles with negative net margin (-0.82%) and returns on equity (-1.24%) and invested capital (-1.45%). The firm pays dividends with a 0.54% yield, but the dividend sustainability is questionable given weak profitability and low liquidity ratios below 1.
Which one has the best ratios?
Neither MKS Inc. nor Mesa Laboratories has a clearly favorable financial ratio profile, both facing significant challenges. MKS Inc. suffers from high leverage and weak returns, while Mesa Laboratories contends with negative profitability and liquidity issues. Despite slight differences, both companies carry risks reflected in their predominantly unfavorable ratios.
Strategic Positioning
This section compares the strategic positioning of MKS Inc. and Mesa Laboratories, Inc., focusing on market position, key segments, and exposure to technological disruption:
MKS Inc.
- Large market cap (~12.7B USD) with presence in semiconductor, industrial, and defense markets.
- Diverse segments including vacuum solutions, photonics, and equipment for PCB manufacturing.
- Operates in technologically advanced sectors with specialized control and laser-based systems.
Mesa Laboratories, Inc.
- Smaller market cap (~469M USD) focused on life sciences and medical industries.
- Key segments in sterilization control, biopharmaceutical development, calibration, and clinical genomics.
- Focused on quality control and genetic analysis tools, facing moderate technological innovation challenges.
MKS Inc. vs Mesa Laboratories, Inc. Positioning
MKS Inc. pursues a diversified strategy across multiple advanced technology segments, offering broader market exposure. Mesa Laboratories concentrates on life sciences tools and quality control, providing niche specialization but narrower market reach.
Which has the best competitive advantage?
Both companies show very unfavorable MOAT evaluations with declining ROIC trends and value destruction, indicating neither currently demonstrates a sustainable competitive advantage based on invested capital efficiency.
Stock Comparison
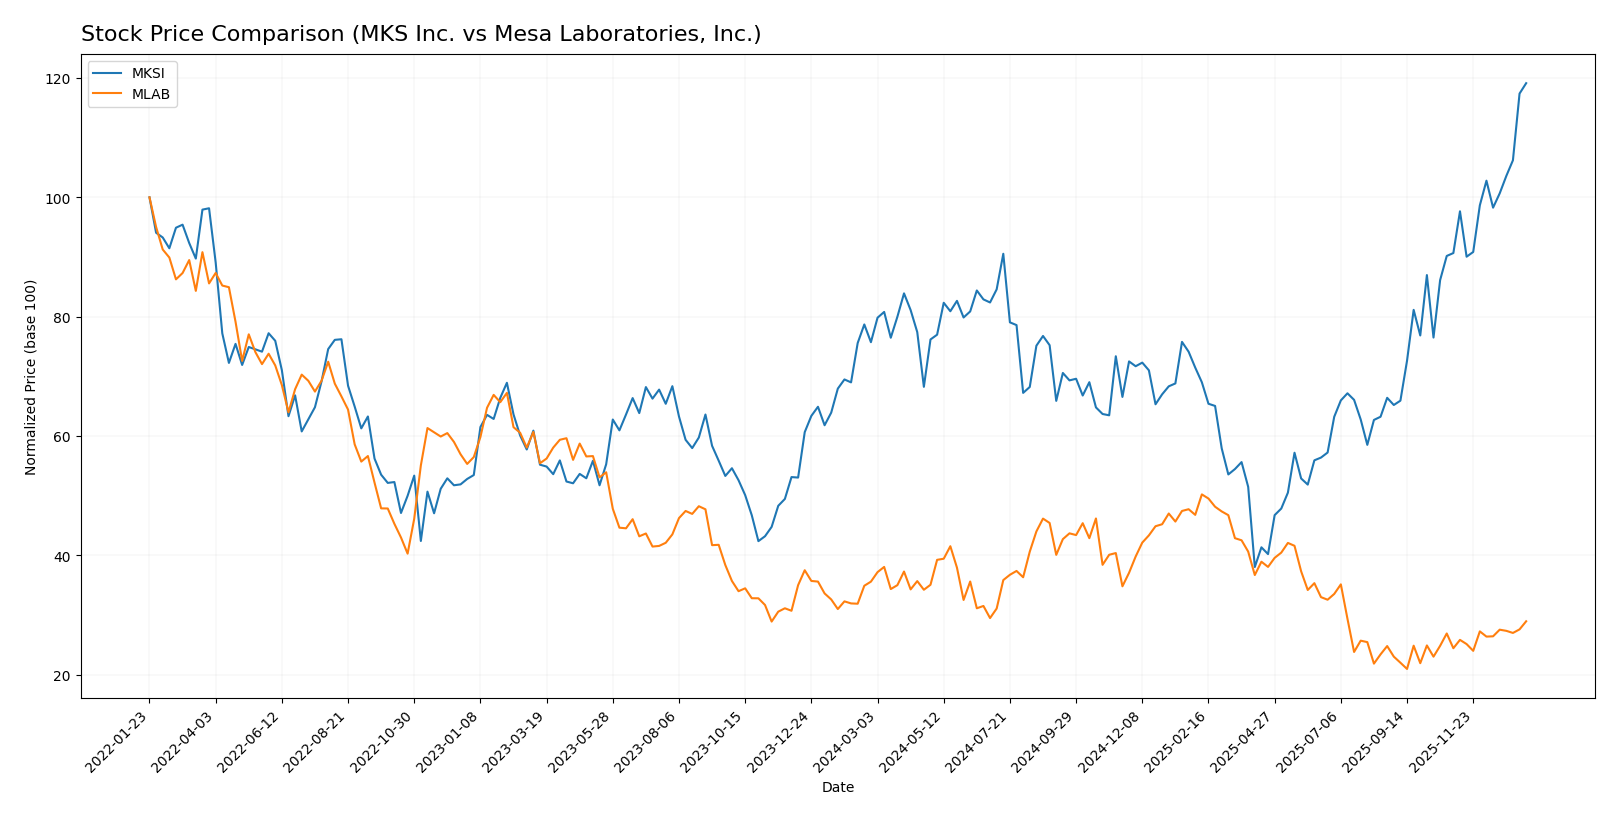
The stock prices of MKS Inc. and Mesa Laboratories, Inc. have shown contrasting trajectories over the past year, with MKS Inc. exhibiting strong bullish momentum and Mesa Laboratories facing a bearish trend despite recent signs of recovery.
Trend Analysis
MKS Inc. has shown a bullish trend over the past 12 months with a 57.33% price increase, marked by acceleration and high volatility (std deviation 24.26). The stock hit a high of 188.84 and a low of 60.29.
Mesa Laboratories, Inc. experienced a bearish trend over the same period with an 18.67% price decline, also with acceleration and notable volatility (std deviation 23.26). The highest price reached was 147.79 and the lowest was 61.66.
Comparing both, MKS Inc. has delivered the highest market performance with a significant positive price change, whereas Mesa Laboratories shows overall negative performance despite recent gains.
Target Prices
Analysts present a mixed but generally optimistic target consensus for MKS Inc. and Mesa Laboratories, Inc.
| Company | Target High | Target Low | Consensus |
|---|---|---|---|
| MKS Inc. | 215 | 136 | 176.17 |
| Mesa Laboratories, Inc. | 83 | 83 | 83 |
For MKS Inc., the consensus target price of 176.17 is slightly below the current stock price of 189.46, suggesting some expected downside or consolidation. Mesa Laboratories’ consensus target of 83 is just under its current price of 84.91, indicating a stable outlook with limited upside.
Analyst Opinions Comparison
This section compares analysts’ ratings and financial scores for MKS Inc. and Mesa Laboratories, Inc.:
Rating Comparison
MKS Inc. Rating
- Rating: B-, considered Very Favorable
- Discounted Cash Flow Score: 3, Moderate valuation signal
- ROE Score: 3, showing moderate efficiency in equity use
- ROA Score: 3, moderate asset utilization
- Debt To Equity Score: 1, very unfavorable financial risk
- Overall Score: 2, moderate overall financial standing
Mesa Laboratories, Inc. Rating
- Rating: C+, also considered Very Favorable
- Discounted Cash Flow Score: 5, indicating Very Favorable DCF
- ROE Score: 1, very unfavorable efficiency in generating profit
- ROA Score: 1, very unfavorable asset utilization
- Debt To Equity Score: 1, very unfavorable financial risk
- Overall Score: 2, moderate overall financial standing
Which one is the best rated?
MKS Inc. holds a better rating (B-) compared to Mesa Laboratories’ C+, reflecting stronger returns on equity and assets despite both having the same moderate overall score and very unfavorable debt levels.
Scores Comparison
Here is a comparison of the financial scores for MKS Inc. and Mesa Laboratories, Inc.:
MKS Inc. Scores
- Altman Z-Score: 2.22, placing MKS in the grey zone with moderate bankruptcy risk.
- Piotroski Score: 7, indicating strong financial health and good investment potential.
Mesa Laboratories, Inc. Scores
- Altman Z-Score: 1.36, placing Mesa Labs in the distress zone with high bankruptcy risk.
- Piotroski Score: 5, indicating average financial strength and investment quality.
Which company has the best scores?
MKS Inc. has higher Altman Z-Score and Piotroski Score values than Mesa Laboratories, Inc., suggesting relatively better financial stability and strength based on these metrics.
Grades Comparison
Here is the comparison of recent analyst grades and ratings for MKS Inc. and Mesa Laboratories, Inc.:
MKS Inc. Grades
This table summarizes recent analyst grades from recognized grading companies for MKS Inc.:
| Grading Company | Action | New Grade | Date |
|---|---|---|---|
| B of A Securities | Maintain | Buy | 2026-01-13 |
| Needham | Maintain | Buy | 2026-01-13 |
| Mizuho | Maintain | Outperform | 2025-12-17 |
| Citigroup | Maintain | Buy | 2025-11-12 |
| Wells Fargo | Maintain | Equal Weight | 2025-11-07 |
| Keybanc | Maintain | Overweight | 2025-11-07 |
| Benchmark | Maintain | Buy | 2025-11-07 |
| Needham | Maintain | Buy | 2025-11-06 |
| Mizuho | Maintain | Outperform | 2025-10-16 |
| Needham | Maintain | Buy | 2025-10-13 |
MKS Inc. shows a strong and consistent pattern of Buy and Outperform ratings, with a few equal weight and overweight opinions.
Mesa Laboratories, Inc. Grades
This table shows recent analyst grades from recognized grading companies for Mesa Laboratories, Inc.:
| Grading Company | Action | New Grade | Date |
|---|---|---|---|
| Wells Fargo | Maintain | Equal Weight | 2025-12-15 |
| Wells Fargo | Upgrade | Equal Weight | 2025-08-08 |
| Wells Fargo | Maintain | Underweight | 2025-05-30 |
| Evercore ISI Group | Maintain | Outperform | 2024-10-01 |
| Evercore ISI Group | Maintain | Outperform | 2024-08-06 |
| Evercore ISI Group | Maintain | Outperform | 2024-07-02 |
| Evercore ISI Group | Maintain | Outperform | 2024-04-04 |
| Evercore ISI Group | Upgrade | Outperform | 2024-01-04 |
| Evercore ISI Group | Downgrade | In Line | 2021-01-04 |
| Evercore ISI Group | Downgrade | In Line | 2021-01-03 |
Mesa Laboratories has a more mixed rating history, with recent equal weight and underweight grades from Wells Fargo, but several past Outperform ratings from Evercore ISI Group.
Which company has the best grades?
MKS Inc. has received generally stronger and more consistent Buy and Outperform grades compared to Mesa Laboratories, Inc., whose recent ratings trend toward Hold/Equal Weight. This suggests MKS Inc. currently enjoys more favorable analyst sentiment, which may impact investor confidence and portfolio decisions.
Strengths and Weaknesses
Below is a comparison of key strengths and weaknesses for MKS Inc. (MKSI) and Mesa Laboratories, Inc. (MLAB) based on the most recent financial and operational data.
| Criterion | MKS Inc. (MKSI) | Mesa Laboratories, Inc. (MLAB) |
|---|---|---|
| Diversification | Highly diversified product portfolio with significant revenue from products ($3.12B) and services ($462M) | More focused product offering with $198M product revenue and $43M service revenue |
| Profitability | Modest net margin (5.3%), neutral ROIC (6.31%), but overall value destroying (ROIC < WACC) | Negative net margin (-0.82%), negative ROIC (-1.45%), also value destroying |
| Innovation | Moderate innovation with stable product segments and notable fixed asset turnover (3.55, favorable) | Higher fixed asset turnover (7.45, favorable), but declining profitability and innovation impact unclear |
| Global presence | Strong global presence with broad industrial focus and multiple segments | More niche market focus, less global scale, more vulnerable to market fluctuations |
| Market Share | Solid market share in vacuum and photonics solutions, but challenged by declining ROIC and high debt | Smaller market share, struggling with profitability and liquidity issues |
Key takeaways: Both companies currently face profitability challenges with returns below their cost of capital, indicating value destruction. MKS Inc. benefits from greater diversification and a stronger global footprint, while Mesa Laboratories shows higher asset efficiency but struggles with negative margins and weaker liquidity. Caution is advised when considering investments in either company given their unfavorable financial health.
Risk Analysis
Below is a comparative table highlighting key risks for MKS Inc. and Mesa Laboratories, Inc. based on the most recent financial and market data available.
| Metric | MKS Inc. (MKSI) | Mesa Laboratories, Inc. (MLAB) |
|---|---|---|
| Market Risk | High beta at 1.92, volatile price range (54.84-193.39) | Moderate beta at 0.89, price range 55.45-155.12 |
| Debt level | High debt-to-equity ratio (2.06), debt/assets 55.65% (unfavorable) | Moderate debt-to-equity (1.14), debt/assets 41.88% (neutral) |
| Regulatory Risk | Moderate – operates in semiconductor and industrial tech sectors with evolving regulations | Moderate – life sciences and medical sectors face stringent regulatory compliance |
| Operational Risk | Medium – complex manufacturing and global supply chain | Medium – relies on specialized calibration and genomic testing products |
| Environmental Risk | Moderate – manufacturing processes may involve hazardous materials | Low to moderate – focus on lab instruments with less environmental footprint |
| Geopolitical Risk | Medium – global sales expose to trade tensions, especially in tech | Low to medium – international but less exposed to volatile regions |
In synthesis, MKS Inc. carries significant market and financial leverage risks, with a high beta and heavy debt burden increasing volatility and vulnerability to interest costs. Mesa Laboratories exhibits weaker profitability and liquidity with distress-level bankruptcy risk and average operational strength. The most impactful risk for MKS is its debt level combined with market volatility, while Mesa faces operational and financial distress risks that investors should monitor closely.
Which Stock to Choose?
MKS Inc. (MKSI) shows a mixed income evolution with a slight revenue decline recently but favorable gross and EBIT margins. Profitability remains modest with an ROE of 8.18%, while debt levels are high and financial ratios mostly unfavorable. Its rating is very favorable (B-), supported by a strong Piotroski score and moderate Altman Z-Score.
Mesa Laboratories, Inc. (MLAB) has experienced positive revenue growth and favorable gross margins, yet net margins remain negative. Profitability ratios are unfavorable, and the company carries moderate debt with weak liquidity. The overall rating is very favorable (C+), though it faces a distress zone Altman Z-Score and average Piotroski score.
Investors focused on quality and financial strength might find MKSI more aligned with their profile due to its stronger rating and income statement evaluation, despite its debt concerns. Conversely, those with a tolerance for volatility and seeking growth from improving revenues might see potential in MLAB, given its favorable income growth but weaker financial ratios and rating.
Disclaimer: Investment carries a risk of loss of initial capital. The past performance is not a reliable indicator of future results. Be sure to understand risks before making an investment decision.
Go Further
I encourage you to read the complete analyses of MKS Inc. and Mesa Laboratories, Inc. to enhance your investment decisions: