Home > Comparison > Real Estate > MAA vs UDR
The strategic rivalry between Mid-America Apartment Communities, Inc. and UDR, Inc. shapes the real estate investment trust sector’s competitive landscape. MAA operates a broad portfolio of over 100K apartment units across multiple U.S. regions, emphasizing scale and geographic diversity. UDR focuses on selective multifamily asset management with a slightly smaller footprint but a strong track record of operational efficiency. This analysis evaluates which company’s growth and risk profile better suits a diversified portfolio in 2026.

Table of contents
Companies Overview
Mid-America Apartment Communities and UDR, Inc. stand as major players shaping the residential REIT landscape in the US.
Mid-America Apartment Communities, Inc.: Regional Apartment Powerhouse
Mid-America Apartment Communities, Inc. holds a dominant market position as a residential REIT focusing on the Southeast, Southwest, and Mid-Atlantic regions. Its core revenue stems from owning, managing, and developing over 102K apartment units. In 2020, the company prioritized full-cycle investment performance through acquisition and redevelopment strategies targeting quality apartment communities.
UDR, Inc.: Multifamily REIT with a Long-Term Track Record
UDR, Inc. operates as a leading multifamily residential REIT with ownership in 51.6K apartment homes across targeted U.S. markets. Its competitive advantage lies in managing and redeveloping attractive real estate communities to deliver dependable returns. In 2020, UDR emphasized maintaining high service standards for residents and associates while expanding its portfolio through strategic acquisitions and developments.
Strategic Collision: Similarities & Divergences
Both firms compete in residential real estate but differ in scale and geographic focus. Mid-America adopts a broad regional concentration with a larger unit base, while UDR targets select markets with a service-oriented approach. Their battle for market share centers on portfolio quality and development expertise. These distinctions highlight contrasting investment profiles: Mid-America’s scale-driven growth versus UDR’s emphasis on operational excellence and resident experience.
Income Statement Comparison
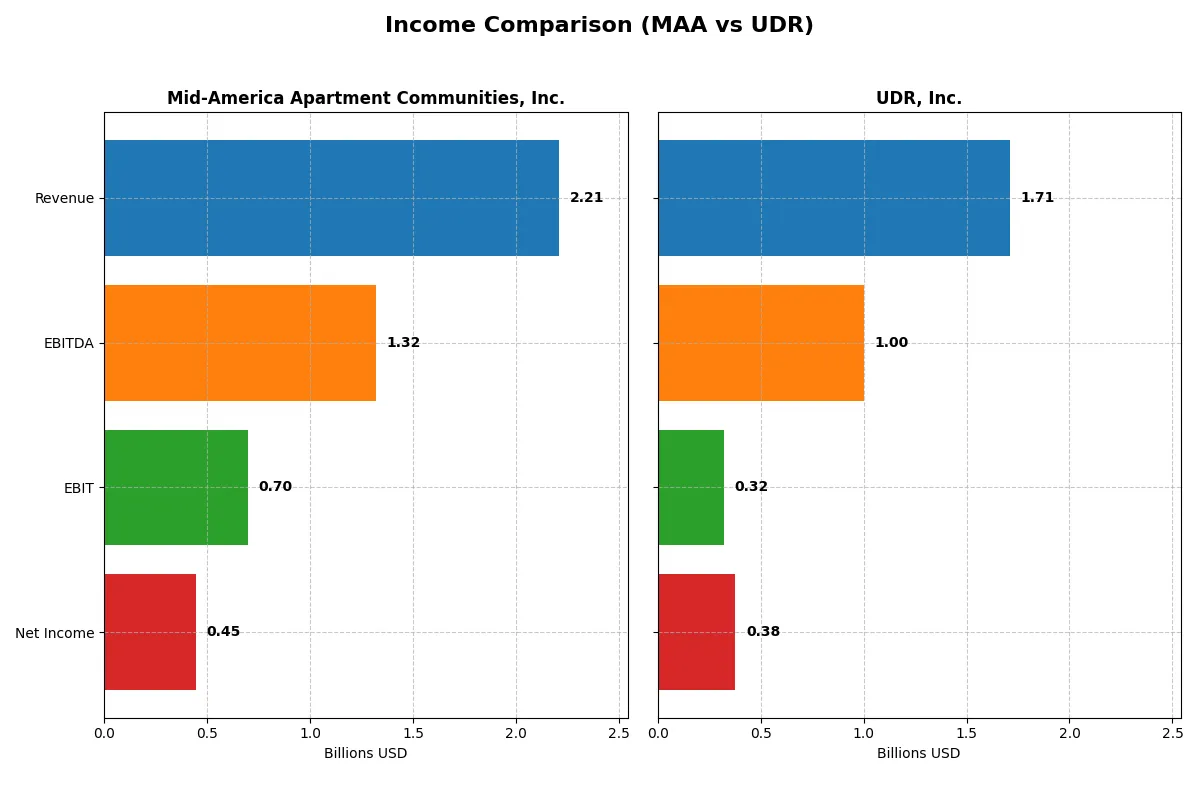
The following data dissects the core profitability and scalability of both corporate engines to reveal who dominates the bottom line:
| Metric | Mid-America Apartment Communities, Inc. (MAA) | UDR, Inc. (UDR) |
|---|---|---|
| Revenue | 2.21B | 1.71B |
| Cost of Revenue | 1.51B | 1.27B |
| Operating Expenses | 83.6M | 115.8M |
| Gross Profit | 703.1M | 438.2M |
| EBITDA | 1.32B | 1.00B |
| EBIT | 696.0M | 322.4M |
| Interest Expense | 185.3M | 0 |
| Net Income | 446.9M | 377.7M |
| EPS | 3.79 | 1.13 |
| Fiscal Year | 2025 | 2025 |
Income Statement Analysis: The Bottom-Line Duel
This income statement comparison reveals which company runs a leaner, more profitable engine amid evolving market conditions.
Mid-America Apartment Communities, Inc. Analysis
MAA’s revenue rose steadily from 1.78B in 2021 to 2.21B in 2025, reflecting solid top-line growth. However, net income declined from 530M to 444M over the same period, signaling margin pressure. The 2025 gross margin of 31.8% remains strong, but net margin contracted to 20.2%, showing challenges in converting sales to profits.
UDR, Inc. Analysis
UDR grew revenue from 1.29B in 2021 to 1.71B in 2025, outpacing MAA’s growth rate. Net income surged from 146M to 378M, demonstrating impressive bottom-line momentum. Its 2025 gross margin of 25.6% is lower than MAA’s, but net margin improved to 22.1%, reflecting efficient cost control and superior capital allocation in recent years.
Growth Power vs. Margin Resilience
UDR outperforms MAA with stronger revenue and net income growth, fueled by expanding net margins and operational efficiency. MAA shows better gross margins but struggles to sustain net income growth amid rising expenses. Investors seeking dynamic earnings expansion may prefer UDR’s profile, while those valuing stable gross profitability might lean toward MAA.
Financial Ratios Comparison
These vital ratios act as a diagnostic tool to expose the underlying fiscal health, valuation premiums, and capital efficiency of these companies:
| Ratios | Mid-America Apartment Communities, Inc. (MAA) | UDR, Inc. (UDR) |
|---|---|---|
| ROE | 7.86% | 11.49% |
| ROIC | 5.58% | 29.38% |
| P/E | 36.36 | 32.08 |
| P/B | 2.86 | 3.68 |
| Current Ratio | 0.16 | 3.31 |
| Quick Ratio | 0.16 | 3.31 |
| D/E | 0.95 | 1.88 |
| Debt-to-Assets | 45.14% | 58.34% |
| Interest Coverage | 3.34 | 0 |
| Asset Turnover | 0.18 | 0.16 |
| Fixed Asset Turnover | 0 | 9.13 |
| Payout ratio | 159.48% | 149.99% |
| Dividend yield | 4.39% | 4.68% |
| Fiscal Year | 2025 | 2025 |
Efficiency & Valuation Duel: The Vital Signs
Financial ratios act as a company’s DNA, unveiling hidden risks and operational strengths crucial for investment decisions.
Mid-America Apartment Communities, Inc.
MAA shows moderate profitability with a 7.86% ROE and a solid 20.23% net margin, yet its 36.36 P/E suggests the stock is expensive. The company supports shareholders with a healthy 4.39% dividend yield, reflecting a preference for income distribution over aggressive reinvestment. However, a low current ratio signals liquidity concerns.
UDR, Inc.
UDR delivers stronger profitability, boasting an 11.49% ROE and a robust 29.38% ROIC, indicating efficient capital use. Despite a high 32.08 P/E and 3.68 P/B ratio, the stock remains stretched. UDR offers a slightly higher 4.68% dividend yield and maintains a strong quick ratio, though elevated debt levels increase financial risk.
Dividend Yield and Capital Efficiency in Focus
UDR offers a better balance of profitability and operational efficiency, while MAA emphasizes shareholder income amid liquidity risks. Investors seeking capital efficiency and growth may prefer UDR, whereas income-focused investors might lean toward MAA’s dividend profile.
Which one offers the Superior Shareholder Reward?
I see Mid-America Apartment Communities, Inc. (MAA) delivers a 4.39% dividend yield with a high 160% payout ratio, signaling aggressive distribution partly funded by free cash flow. MAA’s buybacks complement dividends, sustaining total shareholder return despite a stretched payout. UDR, Inc. offers a slightly higher 4.68% yield but with a 150% payout ratio, also suggesting heavy reliance on capital beyond earnings. UDR’s buyback activity is less visible, raising concerns about distribution sustainability. I find MAA’s balanced approach to dividends and buybacks more sustainable and attractive for total return in 2026.
Comparative Score Analysis: The Strategic Profile
The radar chart reveals the fundamental DNA and trade-offs of Mid-America Apartment Communities and UDR, Inc., highlighting their financial strengths and valuation nuances:
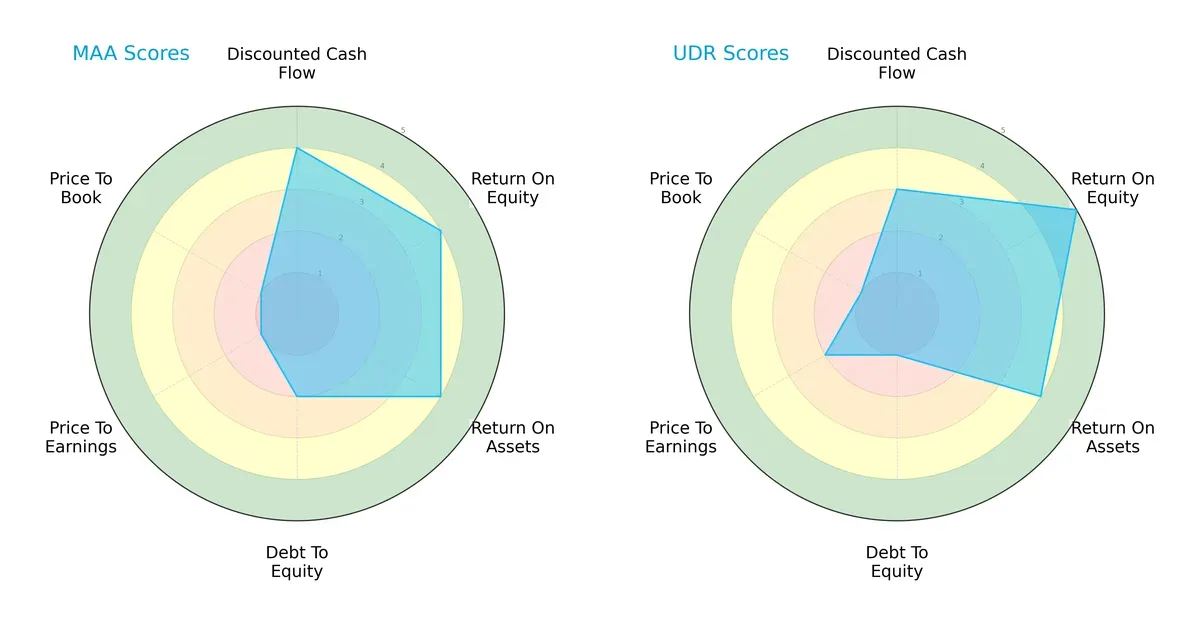
Mid-America Apartment Communities (MAA) shows a balanced edge in discounted cash flow and profitability metrics, scoring 4 in DCF, ROE, and ROA. However, it carries heavier debt (score 2) and suffers from very unfavorable valuation scores (P/E and P/B at 1). UDR excels in ROE with a top score of 5 and maintains strong asset returns but has an even weaker debt profile (score 1) and slightly better valuation (P/E 2 vs. 1). MAA has a more balanced operational profile, while UDR leans on superior equity returns despite financial leverage risks.
Bankruptcy Risk: Solvency Showdown
The Altman Z-Scores place both firms in the distress zone, signaling elevated bankruptcy risk in this market cycle:
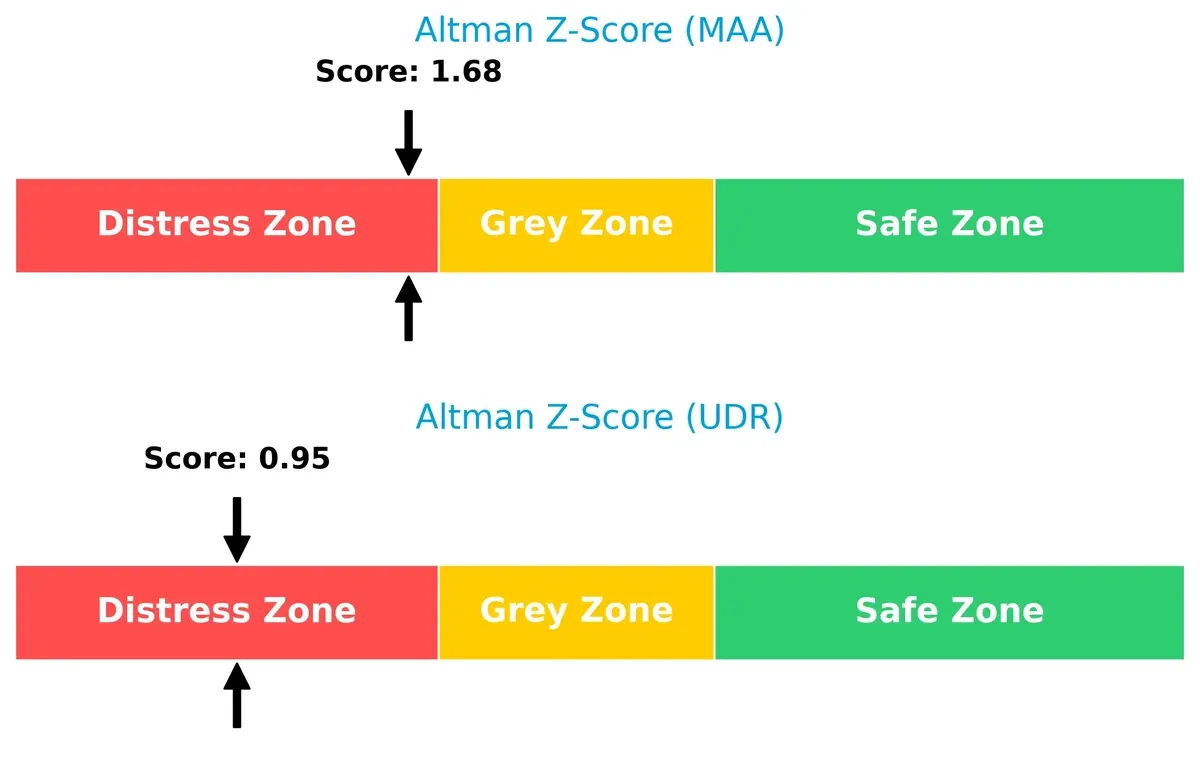
MAA’s score of 1.68 sits closer to the grey zone threshold than UDR’s 0.95, indicating MAA holds marginally better long-term solvency prospects. Nonetheless, both companies face significant financial distress risk, demanding caution from investors.
Financial Health: Quality of Operations
UDR shines with a Piotroski F-Score of 8, signaling very strong financial health and operational quality, while MAA’s score of 6 marks average strength and some red flags:
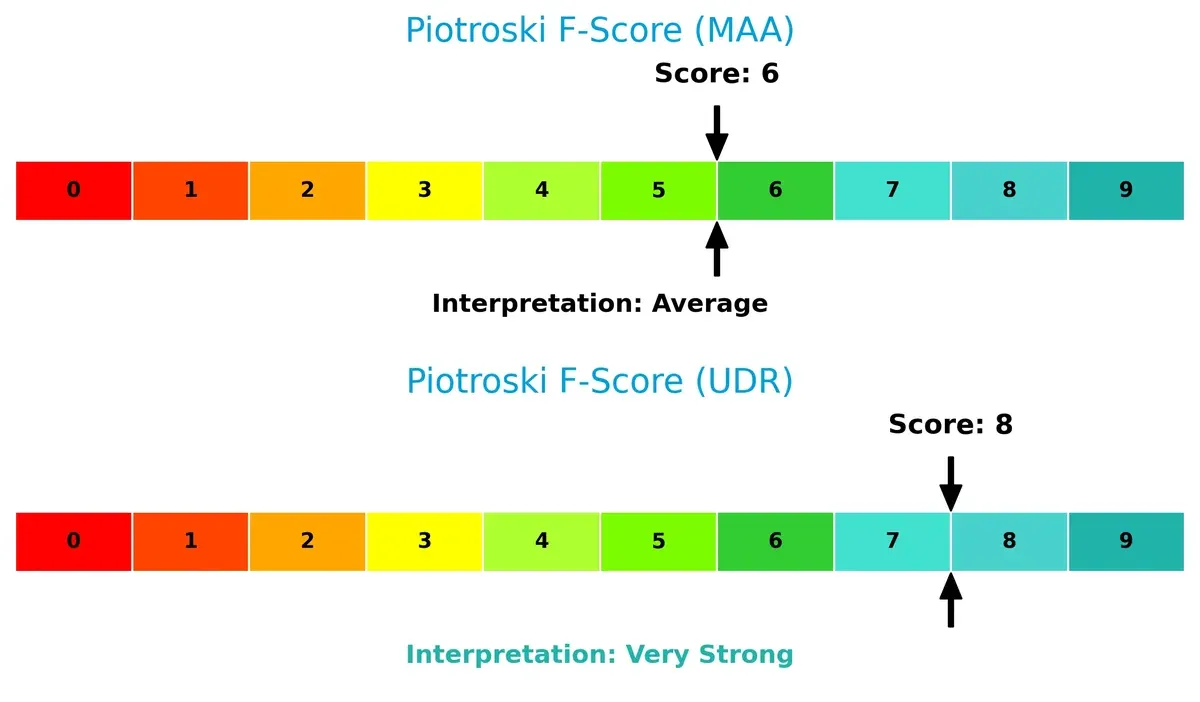
UDR’s higher score reflects robust profitability, liquidity, and efficient capital use. MAA’s lower score suggests room for improvement in internal financial controls and operational metrics. Investors should note UDR’s superior quality as a key differentiator.
How are the two companies positioned?
This section dissects MAA and UDR’s operational DNA by comparing revenue distribution across segments and analyzing internal strengths and weaknesses. The goal is to confront their economic moats to identify the more resilient, sustainable competitive advantage today.
Revenue Segmentation: The Strategic Mix
This visual comparison dissects how Mid-America Apartment Communities, Inc. and UDR, Inc. diversify their income streams and where their primary sector bets lie:
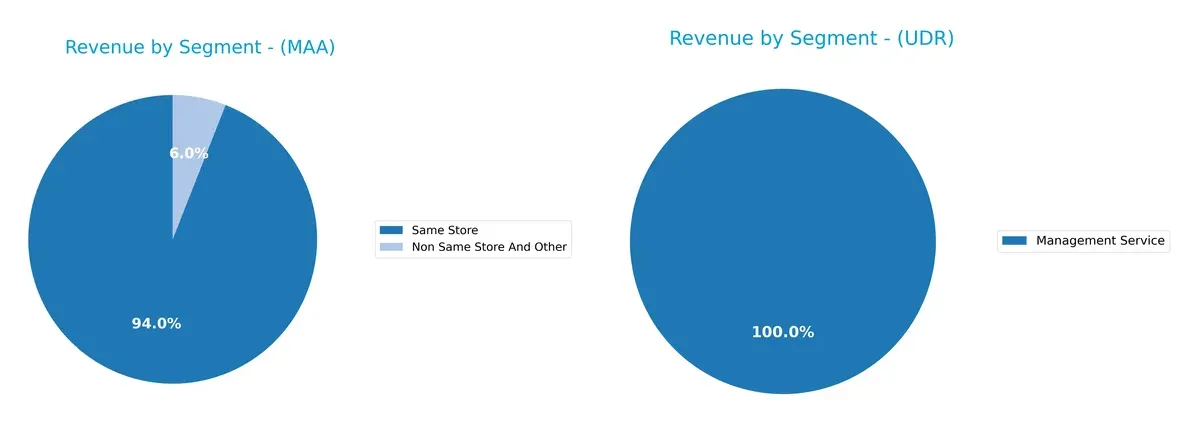
Mid-America Apartment Communities, Inc. anchors its revenue in the Same Store segment, generating over 2B in 2025, dwarfing Non Same Store and Other at 132M. This concentration signals strong operational focus and stable cash flow but some concentration risk. UDR, Inc. shows a narrower data set, primarily reporting Management Service revenues around 6.8M in 2023, suggesting limited diversification or incomplete segmentation disclosure. MAA pivots on core rental income, while UDR’s segmentation lacks breadth for conclusive strategy insights.
Strengths and Weaknesses Comparison
This table compares the strengths and weaknesses of Mid-America Apartment Communities, Inc. (MAA) and UDR, Inc. (UDR):
MAA Strengths
- Favorable net margin at 20.23%
- WACC lower than ROIC, indicating value creation
- Stable dividend yield at 4.39%
- Consistent same store revenue growth over years
UDR Strengths
- Higher net margin at 22.06%
- Strong ROIC at 29.38% well above WACC
- Favorable quick ratio and infinite interest coverage
- Diversified geographic revenue across multiple U.S. regions
- Higher dividend yield at 4.68%
MAA Weaknesses
- Low current and quick ratios at 0.16, signaling liquidity risk
- Unfavorable ROE at 7.86% below cost of capital
- High PE ratio at 36.36 may indicate overvaluation
- Poor asset turnover metrics suggest operational inefficiency
UDR Weaknesses
- Unfavorable debt to equity and debt to assets ratios, indicating higher leverage
- High PE and PB ratios signal valuation concerns
- Current ratio high but marked unfavorable, suggesting potential working capital issues
- Asset turnover at 0.16 is weak despite strong fixed asset turnover
Both companies show solid profitability and dividend yields, but MAA faces liquidity constraints and weaker operational efficiency. UDR benefits from better capital returns and geographic diversification but carries higher leverage and valuation risks. These contrasting profiles highlight different strategic focuses within the same sector.
The Moat Duel: Analyzing Competitive Defensibility
A structural moat is the only true shield protecting long-term profits from relentless competition erosion. Here’s how two residential REITs stack up:
Mid-America Apartment Communities, Inc. (MAA): Geographic Scale and Asset Redevelopment Moat
MAA’s moat hinges on its broad regional footprint and redevelopment expertise. This grants margin stability despite recent profit declines. Emerging markets and redevelopment projects could deepen the moat, but value destruction warns caution.
UDR, Inc.: Operational Efficiency and Value Creation Moat
UDR’s moat derives from superior capital allocation and operational efficiency, evidenced by a robust ROIC well above WACC. Its accelerating profitability and expanding footprint position it to disrupt markets and extend its moat further.
Scale and Capital Efficiency: The Core Competitive Battle
UDR possesses a wider and deeper moat, consistently creating value with growing ROIC and strong margin expansion. MAA’s scale matters, but its value destruction signals weaker competitive defense. UDR better defends market share with disciplined capital use.
Which stock offers better returns?
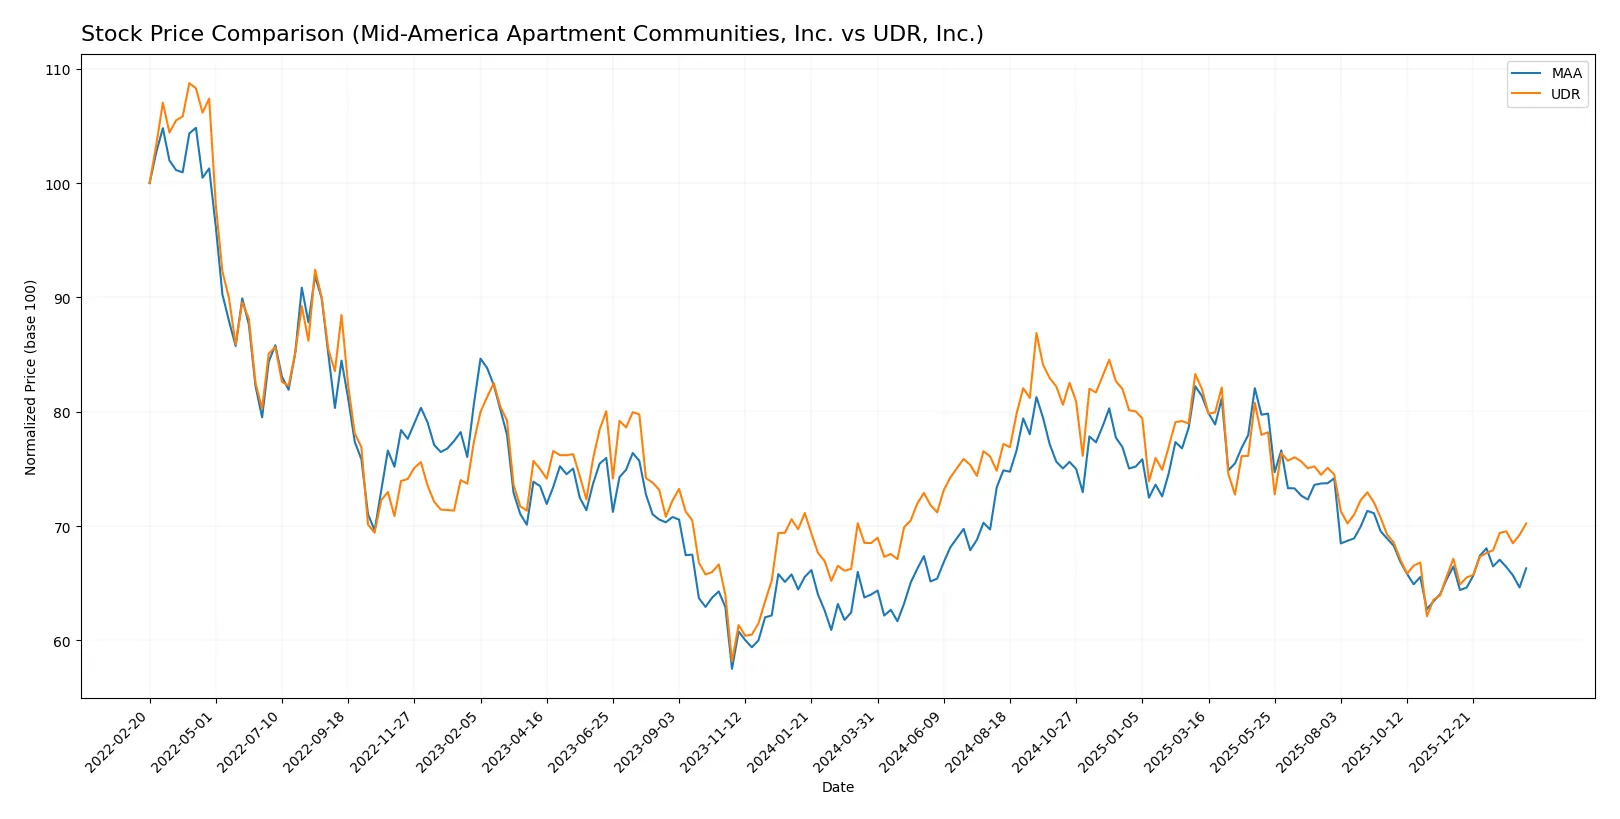
Over the past year, both stocks showed bullish trends with accelerating momentum, but Mid-America Apartment Communities, Inc. displayed higher volatility and a stronger price increase.
Trend Comparison
Mid-America Apartment Communities, Inc. gained 3.59% over the last 12 months, showing a bullish trend with accelerating momentum and price ranging from 126.08 to 168.12.
UDR, Inc. rose 2.5% over the same period, also bullish with acceleration, but experienced lower volatility and a price range from 33.69 to 47.13.
Mid-America Apartment Communities delivered a higher overall return, while UDR showed stronger recent gains and a more dominant buyer presence.
Target Prices
Analysts present a moderate upside potential for Mid-America Apartment Communities and UDR, reflecting steady confidence in their residential REIT profiles.
| Company | Target Low | Target High | Consensus |
|---|---|---|---|
| Mid-America Apartment Communities, Inc. | 134 | 158 | 144.5 |
| UDR, Inc. | 38 | 44 | 41.18 |
The consensus target prices suggest room for share price appreciation relative to current levels of $135.55 for MAA and $38.09 for UDR, indicating moderate analyst optimism.

Don’t Let Luck Decide Your Entry Point
Optimize your entry points with our advanced ProRealTime indicators. You’ll get efficient buy signals with precise price targets for maximum performance. Start outperforming now!
How do institutions grade them?
Here is a summary of recent institutional grades for Mid-America Apartment Communities, Inc. and UDR, Inc.:
Mid-America Apartment Communities, Inc. Grades
The following table shows the latest grades from reputable grading companies for MAA:
| Grading Company | Action | New Grade | Date |
|---|---|---|---|
| Keybanc | Maintain | Overweight | 2026-02-11 |
| Cantor Fitzgerald | Maintain | Neutral | 2026-02-09 |
| RBC Capital | Maintain | Sector Perform | 2026-02-06 |
| Mizuho | Maintain | Outperform | 2026-01-12 |
| BMO Capital | Upgrade | Outperform | 2026-01-09 |
| UBS | Maintain | Neutral | 2026-01-08 |
| Evercore ISI Group | Maintain | In Line | 2025-12-15 |
| BTIG | Maintain | Buy | 2025-12-05 |
| Scotiabank | Downgrade | Sector Perform | 2025-12-05 |
| Wells Fargo | Maintain | Overweight | 2025-11-25 |
UDR, Inc. Grades
The following table shows the latest grades from reputable grading companies for UDR:
| Grading Company | Action | New Grade | Date |
|---|---|---|---|
| RBC Capital | Maintain | Sector Perform | 2026-02-11 |
| Evercore ISI Group | Maintain | Outperform | 2026-02-11 |
| Cantor Fitzgerald | Maintain | Neutral | 2026-02-11 |
| Truist Securities | Upgrade | Buy | 2026-01-20 |
| Goldman Sachs | Maintain | Sell | 2026-01-20 |
| UBS | Maintain | Buy | 2026-01-08 |
| JP Morgan | Downgrade | Underweight | 2025-12-18 |
| Truist Securities | Maintain | Hold | 2025-12-01 |
| Barclays | Maintain | Overweight | 2025-11-25 |
| Mizuho | Maintain | Neutral | 2025-11-24 |
Which company has the best grades?
Mid-America Apartment Communities maintains more consistent positive grades, with multiple outperform and overweight ratings. UDR shows a mixed profile, including upgrades but also a notable sell and underweight rating. Investors may interpret MAA’s steadier institutional support as a sign of broader market confidence.
Risks specific to each company
The following categories identify critical pressure points and systemic threats facing both firms in the 2026 market environment:
1. Market & Competition
Mid-America Apartment Communities, Inc. (MAA)
- Focused on Southeast, Southwest, and Mid-Atlantic regions; faces regional market saturation risks.
UDR, Inc. (UDR)
- Operates in targeted U.S. markets; competitive pressure from national REITs and new developments.
2. Capital Structure & Debt
Mid-America Apartment Communities, Inc. (MAA)
- Debt-to-equity at 0.95, moderate leverage; interest coverage of 3.76 indicates manageable debt service.
UDR, Inc. (UDR)
- High leverage with debt-to-equity of 1.88; excellent interest coverage reflects strong earnings capacity.
3. Stock Volatility
Mid-America Apartment Communities, Inc. (MAA)
- Beta of 0.78 suggests moderate volatility, less sensitive to market swings.
UDR, Inc. (UDR)
- Beta of 0.71 indicates slightly lower volatility, offering relative stability.
4. Regulatory & Legal
Mid-America Apartment Communities, Inc. (MAA)
- Subject to U.S. residential real estate regulations; no recent legal issues reported.
UDR, Inc. (UDR)
- Faces similar regulatory environment; compliance costs may rise with evolving housing laws.
5. Supply Chain & Operations
Mid-America Apartment Communities, Inc. (MAA)
- Large portfolio (102,772 units) demands efficient property management; operational risks in redevelopment projects.
UDR, Inc. (UDR)
- Smaller portfolio (51,649 units) with focus on quality management; development pipeline may strain resources.
6. ESG & Climate Transition
Mid-America Apartment Communities, Inc. (MAA)
- Increasing pressure to upgrade properties for energy efficiency; potential cost impact on redevelopment.
UDR, Inc. (UDR)
- Proactive on ESG initiatives with higher operational efficiency; better positioned for climate transition risks.
7. Geopolitical Exposure
Mid-America Apartment Communities, Inc. (MAA)
- Primarily U.S.-focused, limiting geopolitical risks; regional economic shifts remain a concern.
UDR, Inc. (UDR)
- Also U.S.-centric; exposure limited but local market disruptions can affect occupancy rates.
Which company shows a better risk-adjusted profile?
UDR faces higher financial leverage risk but compensates with superior operational efficiency and a stronger Piotroski score. MAA struggles with weaker liquidity ratios and a concerning Altman Z-score, indicating financial distress. UDR’s stronger capital allocation and ESG positioning yield a more balanced risk-adjusted profile in 2026.
Final Verdict: Which stock to choose?
Mid-America Apartment Communities (MAA) shines with its robust cash generation and dividend yield, making it a reliable income engine. Its point of vigilance lies in its strained liquidity ratios, which could pressure short-term flexibility. MAA suits investors seeking steady income with moderate growth appetite.
UDR, Inc. boasts a powerful moat through exceptional ROIC well above its cost of capital, indicating efficient capital deployment and sustainable competitive advantage. Compared to MAA, UDR offers stronger profitability and operational efficiency, albeit with higher leverage. It fits well within a GARP — Growth at a Reasonable Price — portfolio.
If you prioritize stable income and conservative risk, MAA is the compelling choice due to its consistent cash flow and dividend stability. However, if you seek growth underpinned by a resilient economic moat and superior capital returns, UDR offers better stability and value creation despite higher leverage. Each scenario demands careful risk management aligned with your investment profile.
Disclaimer: Investment carries a risk of loss of initial capital. The past performance is not a reliable indicator of future results. Be sure to understand risks before making an investment decision.
Go Further
I encourage you to read the complete analyses of Mid-America Apartment Communities, Inc. and UDR, Inc. to enhance your investment decisions: