Investors seeking growth in the technology hardware sector often face the challenge of choosing between established innovators and emerging disruptors. Trimble Inc. (TRMB) and MicroVision, Inc. (MVIS) both operate in hardware and equipment but target different niches—Trimble with advanced positioning and construction technologies, and MicroVision focusing on lidar sensors and augmented reality solutions. In this article, I will analyze which company presents a more compelling investment opportunity for 2026.

Table of contents
Companies Overview
I will begin the comparison between Trimble Inc. and MicroVision, Inc. by providing an overview of these two companies and their main differences.
Trimble Inc. Overview
Trimble Inc. provides technology solutions that help professionals and field mobile workers improve or transform their work processes globally. It operates across segments including Buildings and Infrastructure, Geospatial, Resources and Utilities, and Transportation, offering software and systems for construction, surveying, precision agriculture, and fleet management. Founded in 1978 and headquartered in California, Trimble holds a significant market position with a $19B market cap.
MicroVision, Inc. Overview
MicroVision, Inc. develops lidar sensors and related technologies for automotive safety, autonomous driving, and augmented reality. Its products include laser beam scanning modules, micro-displays for AR headsets, and interactive display technologies used in smart devices and home systems. Founded in 1993 and based in Washington, MicroVision is a smaller player with a $298M market cap focusing on innovative scanning and sensing technologies.
Key similarities and differences
Both companies operate in the hardware, equipment, and parts industry within the technology sector and trade on the NASDAQ. Trimble has a diversified product portfolio serving multiple industries with established solutions, while MicroVision specializes in lidar and display technologies for niche applications like autonomous vehicles and AR. Trimble’s workforce and market capitalization are substantially larger, reflecting its broader scale and market reach compared to MicroVision’s focused innovation approach.
Income Statement Comparison
This table compares the most recent fiscal year income statement figures for Trimble Inc. and MicroVision, Inc., highlighting key financial metrics for investors’ evaluation.
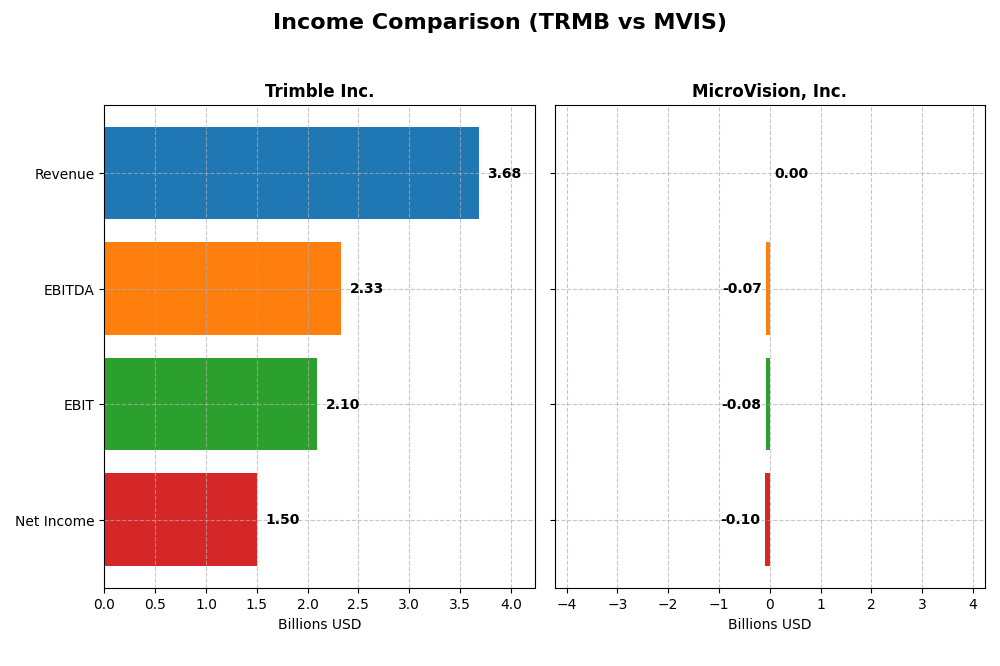
| Metric | Trimble Inc. (TRMB) | MicroVision, Inc. (MVIS) |
|---|---|---|
| Market Cap | 18.97B | 298M |
| Revenue | 3.68B | 4.70M |
| EBITDA | 2.33B | -71.0M |
| EBIT | 2.10B | -75.2M |
| Net Income | 1.50B | -96.9M |
| EPS | 6.13 | -0.46 |
| Fiscal Year | 2024 | 2024 |
Income Statement Interpretations
Trimble Inc.
Trimble Inc. showed steady revenue growth of 17.02% over 2020-2024, though revenue declined slightly by 3.04% in 2024. Net income surged 285.84% overall, with a strong jump in 2024, reflecting a favorable net margin increase to 40.84%. Margins remained robust, supported by a high gross margin of 65.06% and EBIT margin near 57%, indicating operational efficiency.
MicroVision, Inc.
MicroVision’s revenue increased 51.97% over the five years but fell 35.31% in 2024. The company reported persistent net losses, with net income deteriorating by over 600% overall and a negative net margin exceeding 2000%. Margins remain severely negative, with gross margin at -60.35% and EBIT margin at -1601.26%, highlighting ongoing challenges in profitability despite some EBIT growth in the last year.
Which one has the stronger fundamentals?
Trimble’s income statement exhibits strong fundamentals with consistent revenue and net income growth, healthy profitability margins, and favorable operational metrics. In contrast, MicroVision shows significant losses, negative margins, and declining net income despite revenue gains. The data suggest Trimble maintains a more stable and profitable financial foundation relative to MicroVision’s ongoing financial difficulties.
Financial Ratios Comparison
The table below presents a side-by-side comparison of key financial ratios for Trimble Inc. (TRMB) and MicroVision, Inc. (MVIS) based on their most recent fiscal year data.
| Ratios | Trimble Inc. (TRMB) 2024 | MicroVision, Inc. (MVIS) 2024 |
|---|---|---|
| ROE | 26.2% | -198.7% |
| ROIC | 4.5% | -83.7% |
| P/E | 11.5 | -2.8 |
| P/B | 3.02 | 5.63 |
| Current Ratio | 1.27 | 1.79 |
| Quick Ratio | 1.16 | 1.74 |
| D/E | 0.26 | 1.06 |
| Debt-to-Assets | 16.0% | 42.6% |
| Interest Coverage | 5.08 | -19.2 |
| Asset Turnover | 0.39 | 0.039 |
| Fixed Asset Turnover | 11.8 | 0.20 |
| Payout ratio | 0 | 0 |
| Dividend yield | 0 | 0 |
Interpretation of the Ratios
Trimble Inc.
Trimble Inc. shows mostly favorable financial ratios with a strong net margin of 40.84% and return on equity at 26.18%, indicating solid profitability and shareholder value. However, its return on invested capital at 4.49% and asset turnover at 0.39 are less impressive, suggesting efficiency concerns. The company does not pay dividends, indicating a possible focus on reinvestment or growth.
MicroVision, Inc.
MicroVision has predominantly unfavorable ratios, including a highly negative net margin of -2063.78% and return on equity at -198.72%, reflecting significant profitability challenges. Although its current and quick ratios are favorable, high debt-to-equity at 1.06 and negative interest coverage highlight financial risks. The company does not pay dividends, likely due to ongoing losses and a growth or development phase.
Which one has the best ratios?
Trimble Inc. holds the advantage with a higher proportion of favorable ratios (57.14%) and a positive global evaluation, signaling stronger profitability and financial health. In contrast, MicroVision’s ratios are mostly unfavorable (64.29%), reflecting operational and financial difficulties. Thus, Trimble presents a comparatively more stable financial profile.
Strategic Positioning
This section compares the strategic positioning of Trimble Inc. and MicroVision, Inc., including Market position, Key segments, and Exposure to technological disruption:
Trimble Inc.
- Large market cap of 19B in hardware and equipment, facing competitive pressure in multiple industrial sectors.
- Diverse segments: Buildings, Geospatial, Resources, Utilities, Transportation with broad technology solutions.
- Exposure to disruption through advanced positioning and autonomous systems across industries.
MicroVision, Inc.
- Small market cap of 298M, focused on niche lidar sensor technology.
- Concentrated on lidar sensors, micro-display tech, and AR headset modules.
- High exposure to disruption in automotive safety and augmented reality.
Trimble Inc. vs MicroVision, Inc. Positioning
Trimble has a diversified business model across several industrial sectors, providing stability but facing broad competition. MicroVision specializes in emerging lidar and AR technologies, offering focused innovation but higher market risk due to narrow scope.
Which has the best competitive advantage?
Both companies are shedding value, but Trimble shows a very unfavorable moat with declining profitability, while MicroVision has a slightly unfavorable moat with improving ROIC, indicating a modest potential competitive advantage trend.
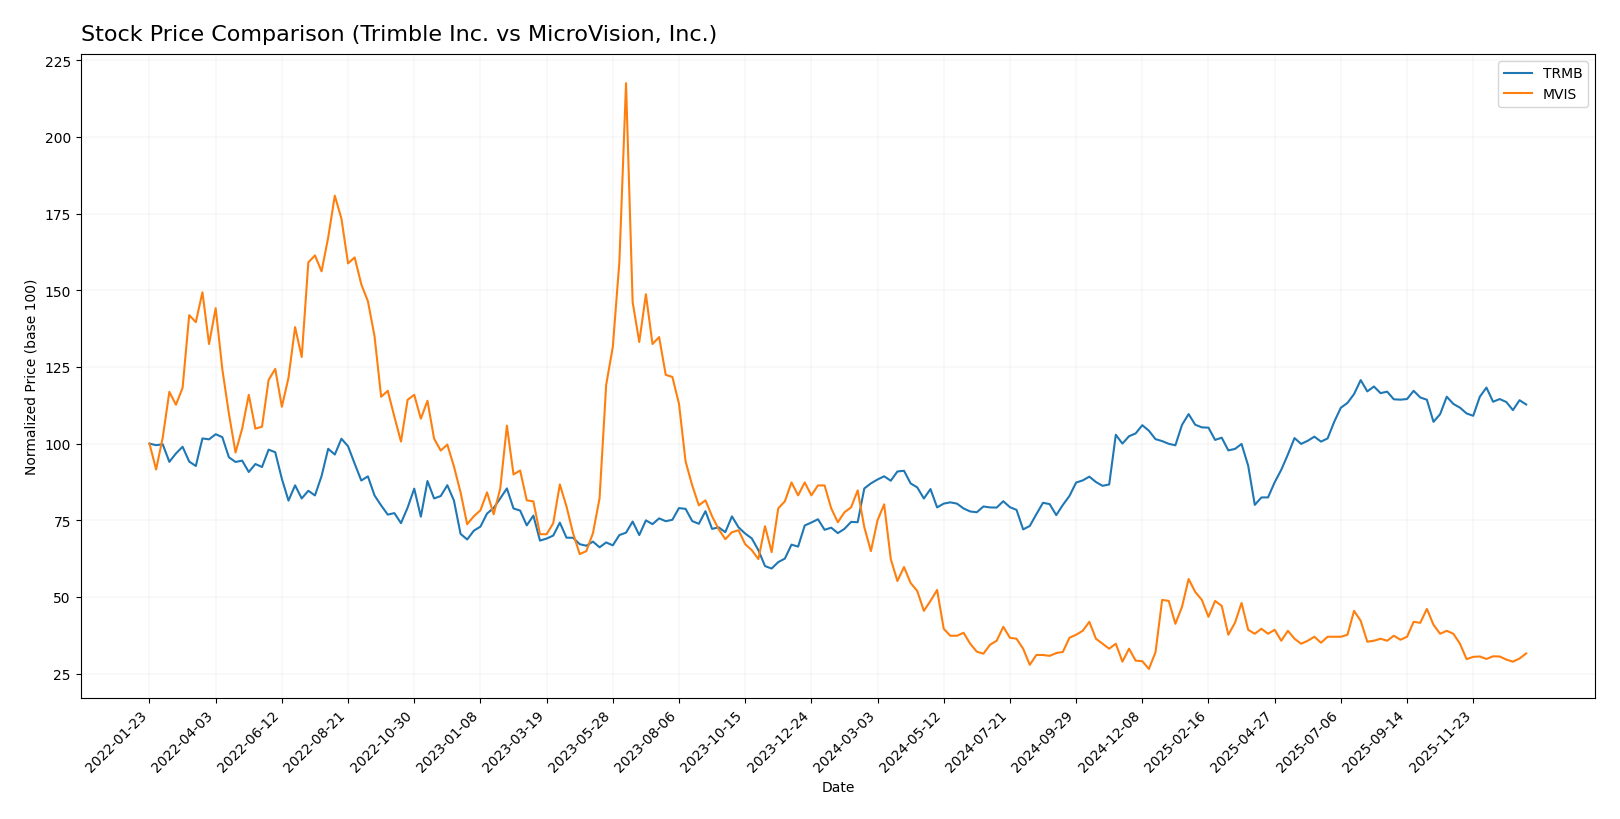
Stock Comparison
The stock price movements of Trimble Inc. and MicroVision, Inc. over the past year reveal contrasting dynamics, with Trimble showing strong gains while MicroVision experiences significant declines amid varying trading volumes.
Trend Analysis
Trimble Inc. exhibited a bullish trend over the past 12 months with a 29.56% price increase, though the trend showed deceleration. The stock reached a high of 85.24 and a low of 50.86, with notable volatility (std deviation 9.79). Recent weeks saw a near-neutral price change (-0.16%) amid reduced buyer dominance.
MicroVision, Inc. faced a bearish trend with a 51.38% decline over the same period, also decelerating. Price volatility was low (std deviation 0.29), with a high of 2.47 and a low of 0.82. The recent period showed a sharper 16.89% drop and continued seller dominance.
Comparing both, Trimble delivered the highest market performance with a strong positive price change, contrasting with MicroVision’s steep and sustained decline over the last year.
Target Prices
The current analyst consensus for target prices shows a moderate upside potential for the stocks analyzed.
| Company | Target High | Target Low | Consensus |
|---|---|---|---|
| Trimble Inc. | 102 | 94 | 98.2 |
| MicroVision, Inc. | 5 | 5 | 5 |
Analysts expect Trimble Inc.’s stock to appreciate from its current price of $79.73 toward a consensus target of $98.2, indicating room for growth. MicroVision, Inc. shows a target consensus at $5, substantially above its current price near $0.98, suggesting high upside but likely accompanied by higher risk.
Analyst Opinions Comparison
This section compares analysts’ ratings and financial scores for Trimble Inc. and MicroVision, Inc.:
Rating Comparison
Trimble Inc. Rating
- Rating: B-, indicating a very favorable overall assessment
- Discounted Cash Flow Score: 3, a moderate score reflecting fair valuation assessment
- ROE Score: 3, moderate efficiency in generating profit from equity
- ROA Score: 3, moderate effectiveness in asset utilization
- Debt To Equity Score: 2, moderate financial risk level
- Overall Score: 2, moderate overall financial standing
MicroVision, Inc. Rating
- Rating: C-, also described as very favorable overall
- Discounted Cash Flow Score: 1, very unfavorable, suggesting potential overvaluation
- ROE Score: 1, very unfavorable, indicating low efficiency
- ROA Score: 1, very unfavorable, showing poor asset utilization
- Debt To Equity Score: 2, moderate financial risk level
- Overall Score: 1, very unfavorable overall financial standing
Which one is the best rated?
Trimble Inc. holds higher ratings and better scores across discounted cash flow, ROE, ROA, and overall financial standing compared to MicroVision, which shows very unfavorable scores in most categories except debt to equity.
Scores Comparison
Here is a comparison of the Altman Z-Score and Piotroski Score for the two companies:
Trimble Inc. Scores
- Altman Z-Score: 4.56, indicating a safe zone with low bankruptcy risk.
- Piotroski Score: 6, classified as average financial strength.
MicroVision, Inc. Scores
- Altman Z-Score: -6.42, indicating distress zone and high bankruptcy risk.
- Piotroski Score: 1, classified as very weak financial strength.
Which company has the best scores?
Based strictly on the data, Trimble Inc. has a significantly higher Altman Z-Score and a stronger Piotroski Score compared to MicroVision, indicating better financial stability and strength.
Grades Comparison
Here is a comparison of the latest reliable grades assigned to Trimble Inc. and MicroVision, Inc.:
Trimble Inc. Grades
The following table summarizes recent grades from reputable financial institutions for Trimble Inc.:
| Grading Company | Action | New Grade | Date |
|---|---|---|---|
| Barclays | Maintain | Overweight | 2026-01-12 |
| Keybanc | Upgrade | Overweight | 2025-12-16 |
| Piper Sandler | Maintain | Overweight | 2025-11-07 |
| JP Morgan | Maintain | Overweight | 2025-09-19 |
| JP Morgan | Maintain | Overweight | 2025-08-07 |
| Oppenheimer | Maintain | Outperform | 2025-08-07 |
| Raymond James | Maintain | Outperform | 2025-08-07 |
| Oppenheimer | Maintain | Outperform | 2025-07-17 |
| JP Morgan | Maintain | Overweight | 2025-07-10 |
| JP Morgan | Maintain | Overweight | 2025-05-14 |
Trimble’s grades consistently show a positive outlook, with most firms maintaining an Overweight or Outperform rating.
MicroVision, Inc. Grades
Below is a summary of recent grades from established firms for MicroVision, Inc.:
| Grading Company | Action | New Grade | Date |
|---|---|---|---|
| D. Boral Capital | Maintain | Buy | 2025-12-16 |
| D. Boral Capital | Maintain | Buy | 2025-11-12 |
| WestPark Capital | Maintain | Buy | 2025-10-21 |
| WestPark Capital | Maintain | Buy | 2025-09-05 |
| D. Boral Capital | Maintain | Buy | 2025-09-02 |
| WestPark Capital | Maintain | Buy | 2025-08-27 |
| D. Boral Capital | Maintain | Buy | 2025-08-11 |
| D. Boral Capital | Maintain | Buy | 2025-05-21 |
| D. Boral Capital | Maintain | Buy | 2025-05-13 |
| WestPark Capital | Maintain | Buy | 2025-03-27 |
MicroVision’s grades are uniformly positive, with all recent ratings maintaining a Buy status.
Which company has the best grades?
Both Trimble Inc. and MicroVision, Inc. have received predominantly positive grades, with consensus ratings of Buy from multiple firms. Trimble’s grades include several Overweight and Outperform ratings from major banks, indicating a strong institutional endorsement. MicroVision’s consistent Buy ratings reflect steady confidence but come from fewer grading companies. Investors may view Trimble’s broader and more varied positive grades as a signal of stronger market support.
Strengths and Weaknesses
Below is a comparative overview of key strengths and weaknesses for Trimble Inc. and MicroVision, Inc. based on the latest financial and operational data.
| Criterion | Trimble Inc. | MicroVision, Inc. |
|---|---|---|
| Diversification | Strong, with multiple segments including Buildings, Geospatial, and Transportation. | Limited, mostly focused on product and license revenue. |
| Profitability | High net margin (40.8%) and ROE (26.2%), but ROIC (4.5%) below cost of capital. | Negative margins and returns, but improving ROIC trend. |
| Innovation | Moderate, steady product development across sectors. | High, with growing ROIC indicating improving innovation efficiency. |
| Global presence | Broad, serving diverse industries worldwide. | Narrower, more niche market focus. |
| Market Share | Established, with solid presence in infrastructure and geospatial markets. | Small and emerging, with fluctuating revenue streams. |
Trimble excels in diversification and profitability metrics, though it faces challenges in capital efficiency. MicroVision shows potential through innovation and improving profitability trends but remains riskier due to negative margins and limited diversification. Investors should weigh Trimble’s stability against MicroVision’s growth prospects and higher risk.
Risk Analysis
Below is a comparison of key risk factors for Trimble Inc. (TRMB) and MicroVision, Inc. (MVIS) based on the latest data from 2024.
| Metric | Trimble Inc. (TRMB) | MicroVision, Inc. (MVIS) |
|---|---|---|
| Market Risk | Beta 1.59, moderate volatility | Beta 1.27, moderate volatility |
| Debt level | Low debt-to-equity 0.26, favorable | High debt-to-equity 1.06, unfavorable |
| Regulatory Risk | Moderate, technology sector | Moderate, automotive & AR tech |
| Operational Risk | Diversified segments, stable ops | Small size, tech development risk |
| Environmental Risk | Moderate, precision ag & transport | Moderate, lidar production impact |
| Geopolitical Risk | US-based, global supply exposure | US-based, niche tech exposure |
Trimble shows stronger financial stability with low debt and a solid Altman Z-score in the safe zone, reducing bankruptcy risk. MicroVision faces high financial distress with negative margins, high leverage, and an Altman Z-score in the distress zone, indicating significant bankruptcy risk. Market and operational risks are higher for MicroVision due to its size and tech development stage.
Which Stock to Choose?
Trimble Inc. (TRMB) shows a generally favorable income evolution with a solid net margin of 40.84% and strong growth in EBIT and EPS. Its financial ratios are mostly positive, including a favorable ROE of 26.18% and low debt levels, supported by a very favorable overall rating. However, its MOAT evaluation indicates value destruction with declining ROIC below WACC.
MicroVision, Inc. (MVIS) exhibits an unfavorable income statement marked by large negative margins and losses. Its financial ratios are predominantly unfavorable, reflecting negative ROE and ROIC, with higher debt levels and a very unfavorable rating overall. The MOAT evaluation suggests slight improvement but continuing value destruction, alongside weak solvency scores.
Investors seeking companies with stronger profitability and stable financial health might find Trimble’s profile more favorable, while those with higher risk tolerance or interest in turnaround potentials could interpret MicroVision’s growing ROIC trend as a sign of emerging improvement despite current challenges.
Disclaimer: Investment carries a risk of loss of initial capital. The past performance is not a reliable indicator of future results. Be sure to understand risks before making an investment decision.
Go Further
I encourage you to read the complete analyses of Trimble Inc. and MicroVision, Inc. to enhance your investment decisions: