Home > Comparison > Technology > TDY vs MVIS
The strategic rivalry between Teledyne Technologies Incorporated and MicroVision, Inc. shapes innovation within the Technology sector’s Hardware, Equipment & Parts industry. Teledyne operates as a diversified industrial powerhouse with broad instrumentation and aerospace applications. MicroVision focuses on niche lidar and display technologies, targeting emerging autonomous and augmented reality markets. This analysis aims to determine which firm’s operational model offers superior risk-adjusted returns for a diversified portfolio navigating technological disruption.
Table of contents
Companies Overview
Teledyne Technologies and MicroVision each play critical roles in the evolving hardware and equipment sector.
Teledyne Technologies Incorporated: Industrial and Defense Technology Powerhouse
Teledyne dominates industrial growth markets with advanced instrumentation, digital imaging, aerospace, and defense electronics. Its revenue streams derive from diverse segments such as marine monitoring, thermal imaging, and aerospace subsystems. In 2026, the company emphasizes technology development and systems integration to deepen its foothold in defense and environmental applications.
MicroVision, Inc.: Innovator in Lidar and Augmented Reality
MicroVision focuses on laser beam scanning technologies powering lidar sensors for automotive safety and autonomous driving. Its revenue relies on selling to OEMs and ODMs, with products spanning lidar, micro-displays, and interactive modules for AR headsets and smart devices. The firm prioritizes advancing long-range lidar and PicoP scanning technology to expand its market reach.
Strategic Collision: Similarities & Divergences
Teledyne advocates a broad-based industrial and defense systems approach, while MicroVision targets niche, cutting-edge lidar and AR solutions. Both compete in high-tech hardware but diverge sharply—Teledyne through integrated subsystems, MicroVision via specialized sensor innovation. Their distinct investment profiles reflect this: Teledyne offers scale and stability; MicroVision presents higher growth potential with elevated risk.
Income Statement Comparison
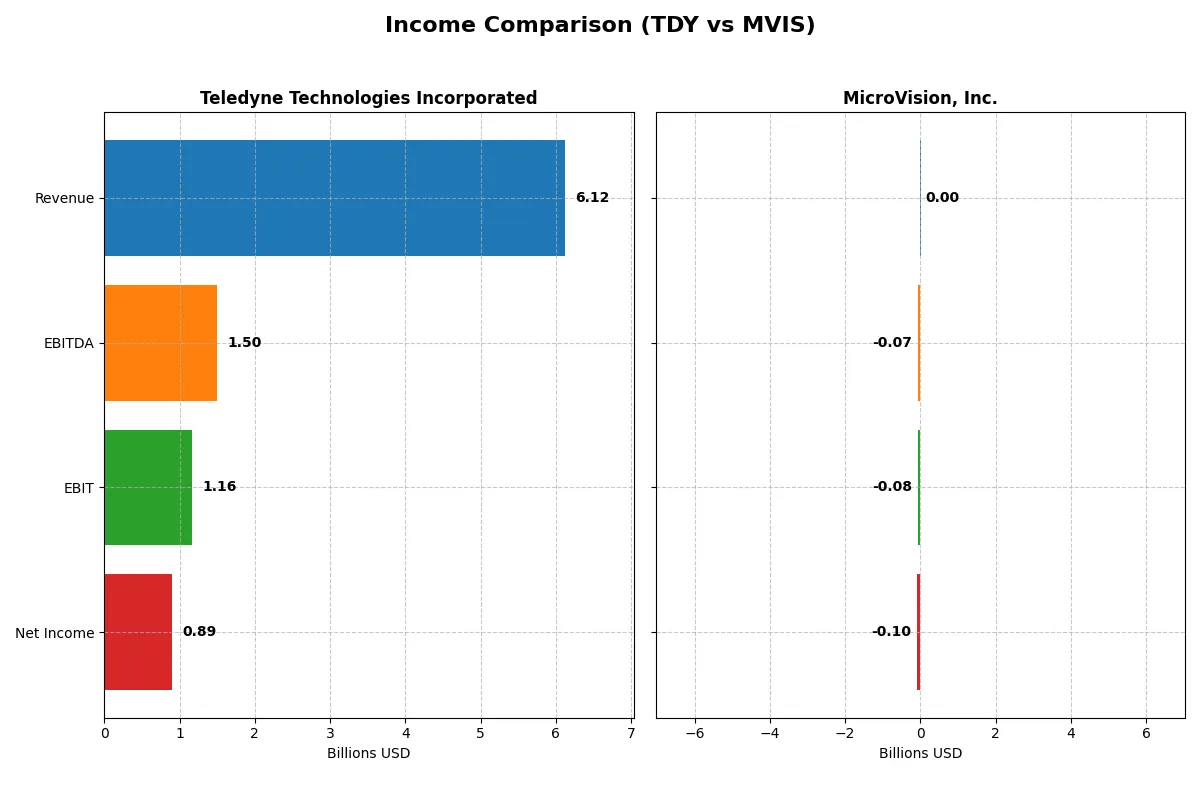
This table dissects the core profitability and scalability of both corporate engines to reveal who dominates the bottom line:
| Metric | Teledyne Technologies Incorporated (TDY) | MicroVision, Inc. (MVIS) |
|---|---|---|
| Revenue | 6.12B | 4.70M |
| Cost of Revenue | 3.72B | 7.53M |
| Operating Expenses | 1.25B | 82.7M |
| Gross Profit | 2.40B | -2.83M |
| EBITDA | 1.50B | -71.0M |
| EBIT | 1.16B | -75.2M |
| Interest Expense | 59.6M | 4.46M |
| Net Income | 895M | -96.9M |
| EPS | 18.88 | -0.46 |
| Fiscal Year | 2025 | 2024 |
Income Statement Analysis: The Bottom-Line Duel
This income statement comparison reveals which company runs a more efficient and profitable corporate engine through their latest financial performance.
Teledyne Technologies Incorporated Analysis
Teledyne’s revenue climbed steadily to 6.12B in 2025, with net income nearly doubling over five years to 895M. Its gross margin remains strong at 39.2%, and net margin healthy at 14.6%. In 2025, EBIT surged 16.6%, signaling improved operational efficiency and solid momentum in profitability.
MicroVision, Inc. Analysis
MicroVision’s revenue fell 35.3% to just 4.7M in 2024, with a persistent net loss of 97M reflecting ongoing unprofitability. The company posts a deeply negative gross margin of -60.4% and net margin below -2000%, indicating severe cost inefficiencies. Despite a slight EBIT improvement, losses remain substantial with weak operational leverage.
Margin Strength vs. Profitability Challenges
Teledyne dominates with robust margin expansion and consistent profit growth, reflecting a well-oiled financial machine. MicroVision struggles with steep losses and negative margins despite some revenue gains over time. For investors, Teledyne’s profile offers sustainable earnings growth, while MicroVision’s financials signal high risk and structural challenges.
Financial Ratios Comparison
These vital ratios act as a diagnostic tool to expose the underlying fiscal health, valuation premiums, and capital efficiency of the companies compared below:
| Ratios | Teledyne Technologies (TDY) | MicroVision (MVIS) |
|---|---|---|
| ROE | 8.5% | -198.7% |
| ROIC | 6.8% | -83.7% |
| P/E | 27.3 | -2.83 |
| P/B | 2.33 | 5.63 |
| Current Ratio | 1.64 | 1.79 |
| Quick Ratio | 1.08 | 1.74 |
| D/E | 0.24 | 1.06 |
| Debt-to-Assets | 16.2% | 42.6% |
| Interest Coverage | 19.3 | -19.2 |
| Asset Turnover | 0.40 | 0.039 |
| Fixed Asset Turnover | 7.29 | 0.20 |
| Payout ratio | 0 | 0 |
| Dividend yield | 0 | 0 |
| Fiscal Year | 2025 | 2024 |
Efficiency & Valuation Duel: The Vital Signs
Financial ratios act as a company’s DNA, exposing hidden risks and operational strengths critical for investment decisions.
Teledyne Technologies Incorporated
Teledyne posts a solid net margin of 14.63% but a modest ROE of 8.51%, signaling moderate profitability. Its P/E of 27.35 suggests the stock trades at a stretched valuation. Teledyne’s zero dividend yield points to reinvestment in R&D and growth initiatives, supporting long-term operational efficiency.
MicroVision, Inc.
MicroVision shows deeply negative profitability metrics, with a net margin of -2063.78% and ROE of -198.72%, reflecting ongoing losses. The stock’s P/E is negative but the P/B ratio at 5.63 flags an expensive valuation relative to book value. No dividend exists; heavy R&D spending drives its cash burn and growth strategy.
Premium Valuation vs. Operational Safety
Teledyne balances moderate profitability and operational efficiency with a stretched valuation, while MicroVision struggles with severe losses and expensive multiples. Teledyne offers a more stable risk-reward profile, fitting investors seeking operational safety over speculative growth. MicroVision suits those tolerating high risk for potential innovation payoffs.
Which one offers the Superior Shareholder Reward?
I observe that neither Teledyne Technologies (TDY) nor MicroVision (MVIS) pays dividends in 2026. TDY boasts robust free cash flow (22.7/share in 2025) with no dividend payout but maintains a modest buyback program supporting shareholder returns. MVIS burns cash heavily, with negative free cash flow and operating margins, relying on reinvestment rather than distributions. TDY’s capital allocation balances growth and shareholder returns, while MVIS remains a high-risk growth play with no buyback activity. I conclude TDY offers a far more sustainable and attractive total return profile for investors today.
Comparative Score Analysis: The Strategic Profile
The radar chart reveals the fundamental DNA and trade-offs of Teledyne Technologies Incorporated and MicroVision, Inc.:
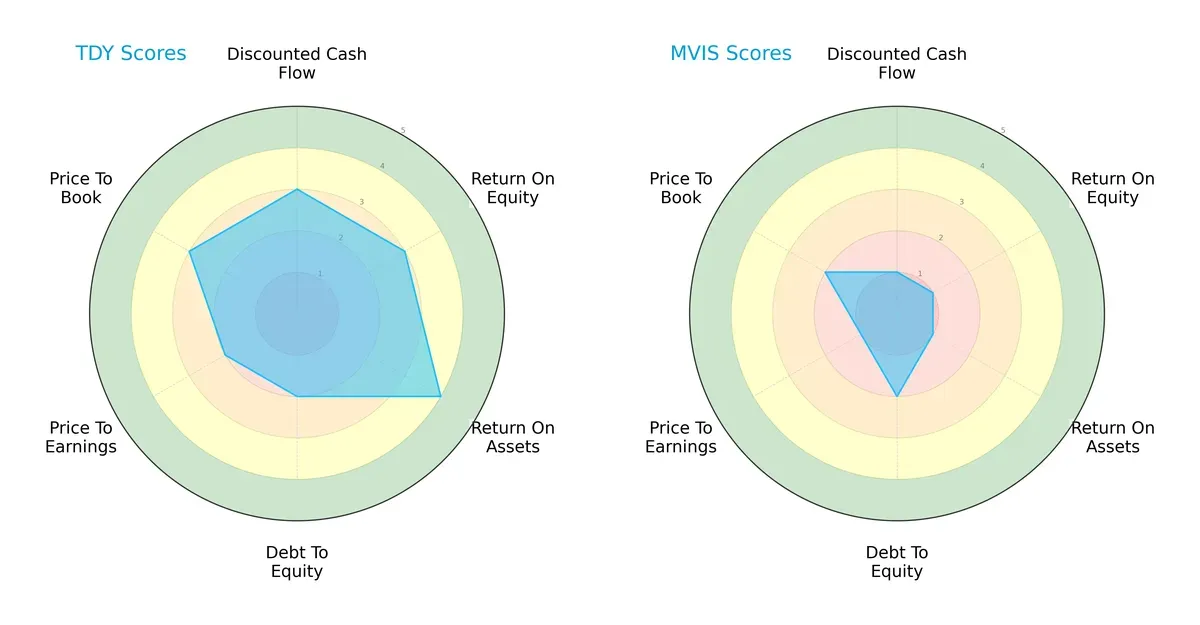
Teledyne exhibits a more balanced profile with moderate to favorable scores across DCF (3), ROE (3), ROA (4), and valuation metrics (PE 2, PB 3). MicroVision relies heavily on a weak operational edge, scoring very low in DCF (1), ROE (1), and ROA (1). Both bear moderate debt-to-equity risk (2), but Teledyne’s diversified strengths position it as the more stable investment.
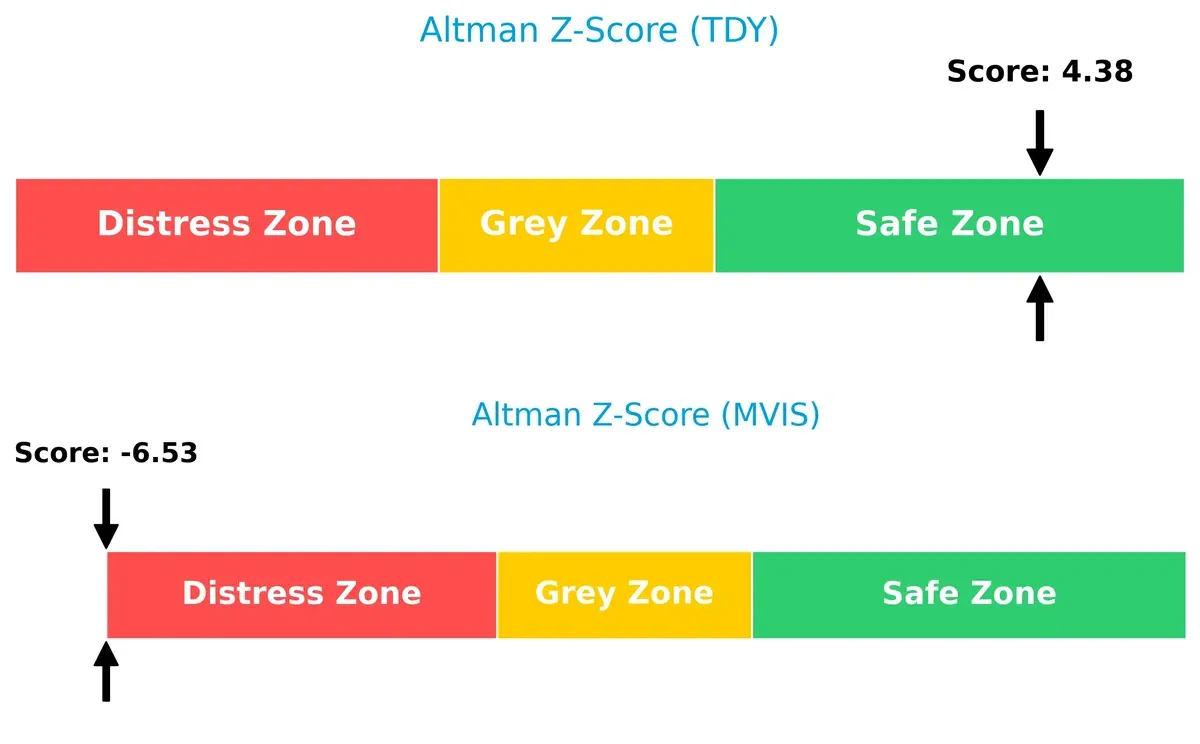
Bankruptcy Risk: Solvency Showdown
Teledyne’s Altman Z-Score of 4.38 signals a safe zone, suggesting strong solvency and low bankruptcy risk. MicroVision’s -6.53 falls deep in the distress zone, indicating severe financial instability and high default risk:
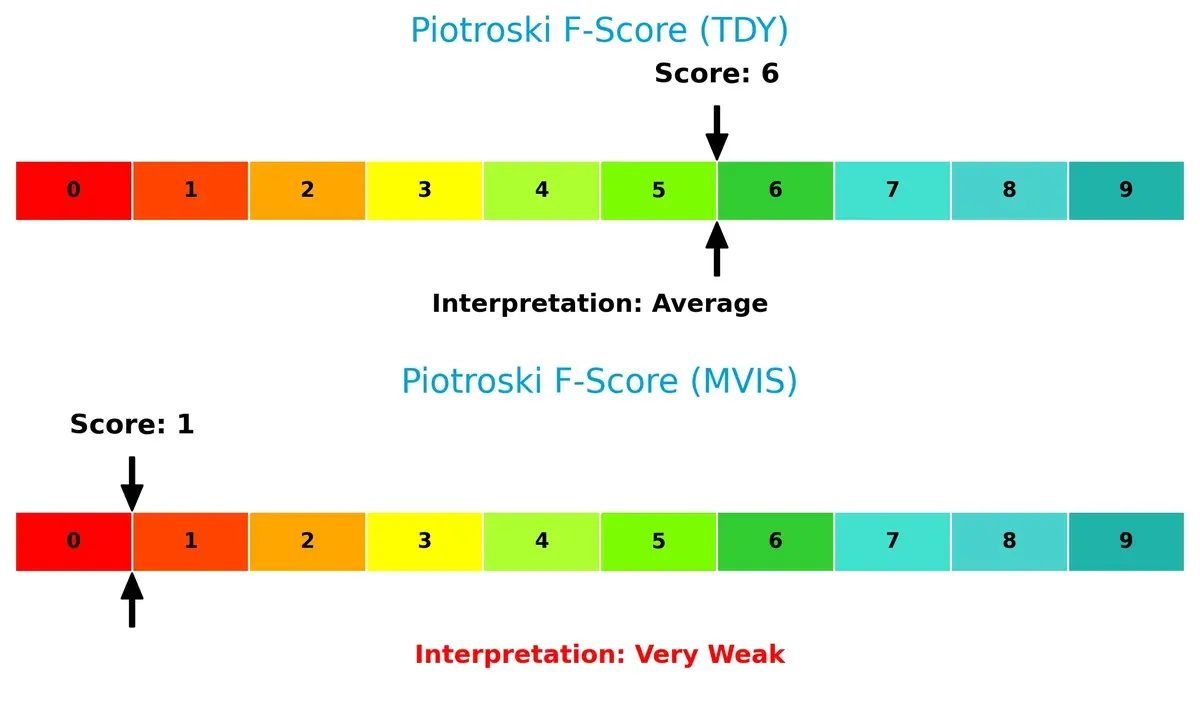
Financial Health: Quality of Operations
Teledyne’s Piotroski F-Score of 6 reflects average financial health with solid internal metrics. MicroVision’s score of 1 raises red flags, signaling very weak operational quality and heightened risk:
How are the two companies positioned?
This section dissects the operational DNA of TDY and MVIS by comparing their revenue distribution by segment and internal dynamics. The goal is to confront their economic moats to reveal which model delivers the most resilient competitive advantage.
Revenue Segmentation: The Strategic Mix
The following visual comparison dissects how Teledyne Technologies and MicroVision diversify their income streams and where their primary sector bets lie:
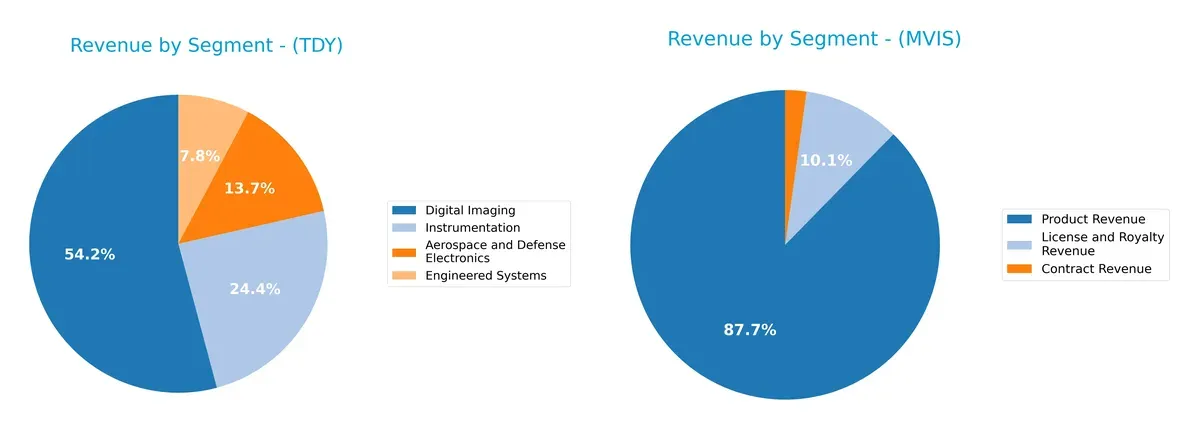
Teledyne Technologies anchors its revenue in Digital Imaging with $3.07B, complemented by Instrumentation at $1.38B and Aerospace and Defense Electronics at $777M. This blend showcases a balanced industrial portfolio. MicroVision, by contrast, pivots heavily on Product Revenue at $4.12M in 2024, with smaller License and Royalty at $475K and minimal Contract Revenue. Teledyne’s diversification mitigates risks, while MicroVision faces concentration risk but benefits from focused innovation.
Strengths and Weaknesses Comparison
This table compares the strengths and weaknesses of Teledyne Technologies Incorporated and MicroVision, Inc. based on diversification, profitability, financials, innovation, global presence, and market share:
Teledyne Technologies Incorporated Strengths
- Diversified product segments across aerospace, imaging, instrumentation, and engineered systems
- Favorable net margin at 14.63%
- Strong liquidity ratios with current ratio 1.64 and quick ratio 1.08
- Low debt-to-equity of 0.24 and high interest coverage of 19.47
- Solid global presence with significant revenue from U.S., Europe, and Asia
MicroVision, Inc. Strengths
- Favorable PE ratio despite losses
- Strong liquidity with current ratio 1.79 and quick ratio 1.74
- Some revenue from contract and license streams in recent years
- Presence in specialized tech licensing and product markets
Teledyne Technologies Incorporated Weaknesses
- Unfavorable ROE at 8.51%, below WACC at 8.21% indicating weak capital efficiency
- Asset turnover low at 0.4 suggesting less operational efficiency
- PE ratio high at 27.35 may reflect overvaluation risk
- No dividend yield limits income appeal
MicroVision, Inc. Weaknesses
- Negative net margin and ROE at severe losses over -200% and -198% respectively
- High debt-to-equity at 1.06 and negative interest coverage indicate financial stress
- Very low asset and fixed asset turnover showing poor utilization
- Unfavorable PB ratio at 5.63 and no dividend yield
- Lack of global revenue diversification, concentrated product revenue
Teledyne benefits from diversified revenue streams and robust financial stability, with moderate profitability concerns. MicroVision struggles with severe profitability and financial health challenges, relying on niche product and licensing revenue. These factors shape each company’s strategic priorities around operational efficiency and financial restructuring.
The Moat Duel: Analyzing Competitive Defensibility
A structural moat shields long-term profits from competition’s relentless erosion. Without it, gains quickly vanish. Let’s dissect the moats of two tech firms:
Teledyne Technologies Incorporated: Diversified Industrial Intangibles
Teledyne’s moat stems from intangible assets and diversified technology platforms, supporting stable margins and rising ROIC despite shedding value overall. Its broad industrial base offers resilience and expansion potential in aerospace and defense for 2026.
MicroVision, Inc.: Emerging Innovation Risk
MicroVision’s moat relies on cutting-edge MEMS lidar technology, unlike Teledyne’s broad asset base. Its financials reveal deep losses and negative margins, yet ROIC growth signals nascent profitability. Success hinges on scaling automotive and AR markets.
Verdict: Intangible Assets vs. Emerging Tech Innovation
Teledyne possesses a wider moat driven by established intangible assets and diversified markets. MicroVision’s innovation is promising but risk-laden with fragile financials. Teledyne is better positioned to defend market share amid competitive threats.
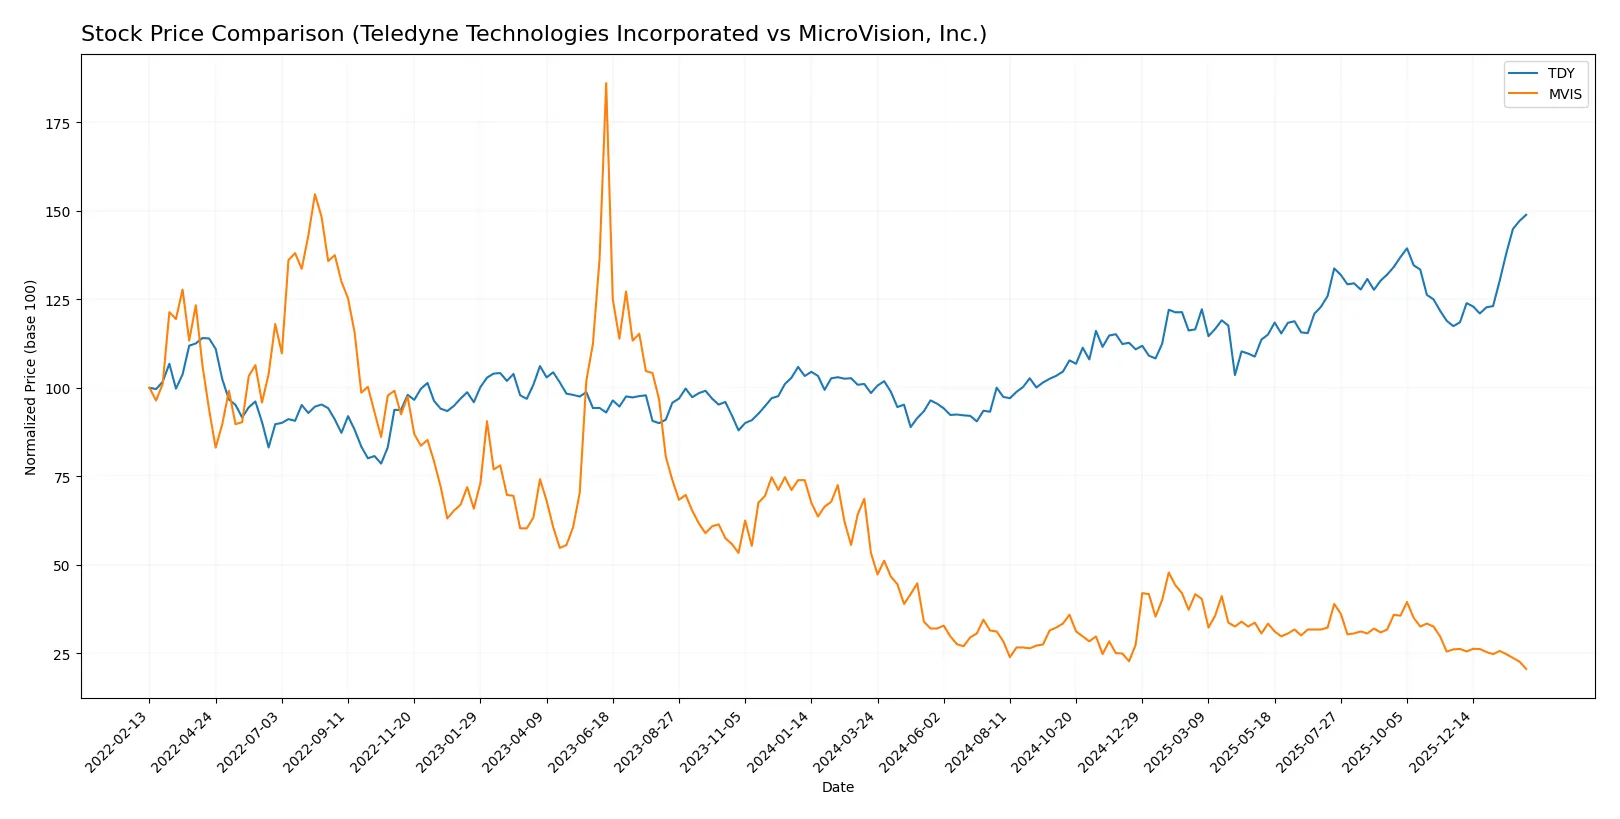
Which stock offers better returns?
Over the past year, Teledyne Technologies shows a strong upward trajectory with notable price acceleration, while MicroVision’s stock exhibits a significant decline amid decelerating losses.
Trend Comparison
Teledyne Technologies’ stock gained 51.18% over the past 12 months, reflecting a bullish trend with accelerating momentum and a high volatility level of 59.82. The stock reached a peak of 627.57 and a low of 374.64.
MicroVision’s stock declined 61.49% over the same period, indicating a bearish trend with deceleration and very low volatility at 0.23. The highest price reached 1.92, while the lowest was 0.74.
Teledyne Technologies outperformed MicroVision by a wide margin, delivering strong market gains versus MicroVision’s prolonged downtrend.
Target Prices
Analysts present a confident target price range reflecting moderate upside potential for these technology hardware companies.
| Company | Target Low | Target High | Consensus |
|---|---|---|---|
| Teledyne Technologies Incorporated | 599 | 720 | 638.5 |
| MicroVision, Inc. | 5 | 5 | 5 |
Teledyne’s consensus target price sits slightly above its current 627.85 USD share price, signaling modest growth expectations. MicroVision’s $5 target vastly exceeds its 0.73 USD market price, implying high speculative upside but elevated risk.

Don’t Let Luck Decide Your Entry Point
Optimize your entry points with our advanced ProRealTime indicators. You’ll get efficient buy signals with precise price targets for maximum performance. Start outperforming now!
How do institutions grade them?
Here are the recent institutional grades for Teledyne Technologies Incorporated and MicroVision, Inc.:
Teledyne Technologies Incorporated Grades
This table shows recent grades from major investment banks covering Teledyne Technologies Incorporated.
| Grading Company | Action | New Grade | Date |
|---|---|---|---|
| Barclays | Maintain | Equal Weight | 2026-01-22 |
| Needham | Maintain | Buy | 2026-01-22 |
| Stifel | Maintain | Buy | 2026-01-22 |
| Citigroup | Maintain | Neutral | 2026-01-13 |
| Barclays | Maintain | Equal Weight | 2026-01-12 |
| Needham | Maintain | Buy | 2025-10-23 |
| Barclays | Maintain | Equal Weight | 2025-10-23 |
| Stifel | Maintain | Buy | 2025-10-23 |
| Morgan Stanley | Maintain | Equal Weight | 2025-10-15 |
| UBS | Maintain | Buy | 2025-07-24 |
MicroVision, Inc. Grades
This table presents recent grades from recognized capital firms on MicroVision, Inc.
| Grading Company | Action | New Grade | Date |
|---|---|---|---|
| D. Boral Capital | Maintain | Buy | 2026-01-27 |
| D. Boral Capital | Maintain | Buy | 2025-12-16 |
| D. Boral Capital | Maintain | Buy | 2025-11-12 |
| WestPark Capital | Maintain | Buy | 2025-10-21 |
| WestPark Capital | Maintain | Buy | 2025-09-05 |
| D. Boral Capital | Maintain | Buy | 2025-09-02 |
| WestPark Capital | Maintain | Buy | 2025-08-27 |
| D. Boral Capital | Maintain | Buy | 2025-08-11 |
| D. Boral Capital | Maintain | Buy | 2025-05-21 |
| D. Boral Capital | Maintain | Buy | 2025-05-13 |
Which company has the best grades?
MicroVision, Inc. consistently receives unanimous Buy ratings from its grading firms. Teledyne Technologies shows a mixed profile with Buy and Equal Weight grades. Investors may interpret MicroVision’s uniform Buy consensus as stronger institutional enthusiasm compared to Teledyne’s more cautious stance.
Risks specific to each company
The following categories identify the critical pressure points and systemic threats facing both firms in the 2026 market environment:
1. Market & Competition
Teledyne Technologies Incorporated
- Established diversified industrial tech player faces intense sector competition but benefits from broad product portfolio.
MicroVision, Inc.
- Small lidar and micro-display developer struggles with niche market penetration and rapid innovation by larger rivals.
2. Capital Structure & Debt
Teledyne Technologies Incorporated
- Low debt-to-equity (0.24) and strong interest coverage (19.47) signal conservative leverage and solid debt servicing.
MicroVision, Inc.
- High debt-to-equity (1.06) and negative interest coverage (-16.87) expose severe financial risk and potential solvency issues.
3. Stock Volatility
Teledyne Technologies Incorporated
- Beta near 1.0 (1.014) indicates stock volatility closely tracks the market, reflecting moderate risk.
MicroVision, Inc.
- Elevated beta (1.274) suggests greater price swings and higher speculative risk for investors.
4. Regulatory & Legal
Teledyne Technologies Incorporated
- Aerospace and defense exposure entails complex compliance but stable regulatory environment historically.
MicroVision, Inc.
- Emerging lidar tech faces evolving safety and privacy regulations, increasing compliance uncertainty.
5. Supply Chain & Operations
Teledyne Technologies Incorporated
- Global operations in industrial and aerospace sectors require resilient supply chains; proven operational integration.
MicroVision, Inc.
- Heavy reliance on advanced components and limited scale raise vulnerability to supply disruptions.
6. ESG & Climate Transition
Teledyne Technologies Incorporated
- Diverse industrial footprint demands ongoing ESG investments; steady progress but exposure to environmental regulations.
MicroVision, Inc.
- Innovative tech focus offers potential ESG benefits, but lack of scale limits impact and ESG reporting transparency.
7. Geopolitical Exposure
Teledyne Technologies Incorporated
- International presence in defense and aerospace introduces geopolitical risks but diversified global footprint mitigates concentration.
MicroVision, Inc.
- Primarily US-based with limited international exposure, reducing geopolitical risk but limiting global growth opportunities.
Which company shows a better risk-adjusted profile?
Teledyne’s key risk lies in market competition and operational complexity, but its conservative capital structure and stable cash flows support resilience. MicroVision faces existential financial distress, with high leverage and negative profitability heightening bankruptcy risk. Teledyne shows a markedly superior risk-adjusted profile, evidenced by its safe-zone Altman Z-score (4.38) versus MicroVision’s distress zone (-6.53). The stark contrast in debt servicing and profitability underscores MicroVision’s precarious position.
Final Verdict: Which stock to choose?
Teledyne Technologies Incorporated (TDY) stands out as a cash-generating powerhouse with a steadily growing profitability trend. Its main point of vigilance lies in its slightly unfavorable ROIC versus WACC, signaling value destruction despite improving returns. TDY fits best in portfolios seeking stable, moderate-growth industrial leaders.
MicroVision, Inc. (MVIS) offers an intriguing strategic moat through heavy R&D investment, aiming to disrupt with innovation. However, it exhibits significant financial instability and persistent losses, making it a riskier play than TDY. MVIS might suit investors with a high tolerance for volatility and a long-term speculative growth focus.
If you prioritize capital efficiency and consistent earnings growth, TDY is the compelling choice due to its robust cash flows and improving profitability. However, if you seek high-risk, high-reward innovation potential, MVIS offers that speculative edge despite its financial fragility and bearish price trend. Each appeals to distinctly different investor profiles.
Disclaimer: Investment carries a risk of loss of initial capital. The past performance is not a reliable indicator of future results. Be sure to understand risks before making an investment decision.
Go Further
I encourage you to read the complete analyses of Teledyne Technologies Incorporated and MicroVision, Inc. to enhance your investment decisions: