Home > Comparison > Technology > TEL vs MVIS
The strategic rivalry between TE Connectivity Ltd. and MicroVision, Inc. shapes innovation in the technology hardware sector. TE Connectivity operates as a diversified industrial powerhouse, supplying connectivity and sensor solutions globally. MicroVision focuses on cutting-edge lidar and micro-display technologies with a leaner operational footprint. This analysis explores their contrasting growth and value propositions to identify which trajectory offers superior risk-adjusted returns for a diversified portfolio in an evolving tech landscape.

Table of contents
Companies Overview
TE Connectivity Ltd. and MicroVision, Inc. are pivotal players in the hardware and sensor technology markets, shaping automotive and industrial innovation.
TE Connectivity Ltd.: Global Connectivity and Sensor Solutions Leader
TE Connectivity Ltd. dominates the connectivity and sensor solutions market, generating revenue through diversified segments: Transportation, Industrial, and Communications Solutions. It focuses strategically on expanding its product reach in automotive, aerospace, and data communication sectors in 2026, leveraging a broad global footprint across 140 countries and a workforce of 85K.
MicroVision, Inc.: Innovator in Lidar and Scanning Technology
MicroVision, Inc. specializes in lidar sensors and laser scanning technologies critical for automotive safety and autonomous driving. Its revenue engine centers on selling advanced lidar modules and micro-display designs to OEMs and ODMs. In 2026, the company targets breakthroughs in long-range lidar and augmented reality applications despite its smaller scale with 185 employees and a market cap under $250M.
Strategic Collision: Similarities & Divergences
Both companies focus on advanced hardware in the sensor and connectivity space but differ in scale and scope. TE Connectivity adopts a broad, diversified product ecosystem, while MicroVision pursues niche innovation in lidar and AR technologies. Their primary battleground lies in automotive sensor applications, yet TE’s diversified portfolio contrasts sharply with MicroVision’s concentrated innovation play. Investors should note the distinct risk-reward profiles shaped by size and market breadth.
Income Statement Comparison
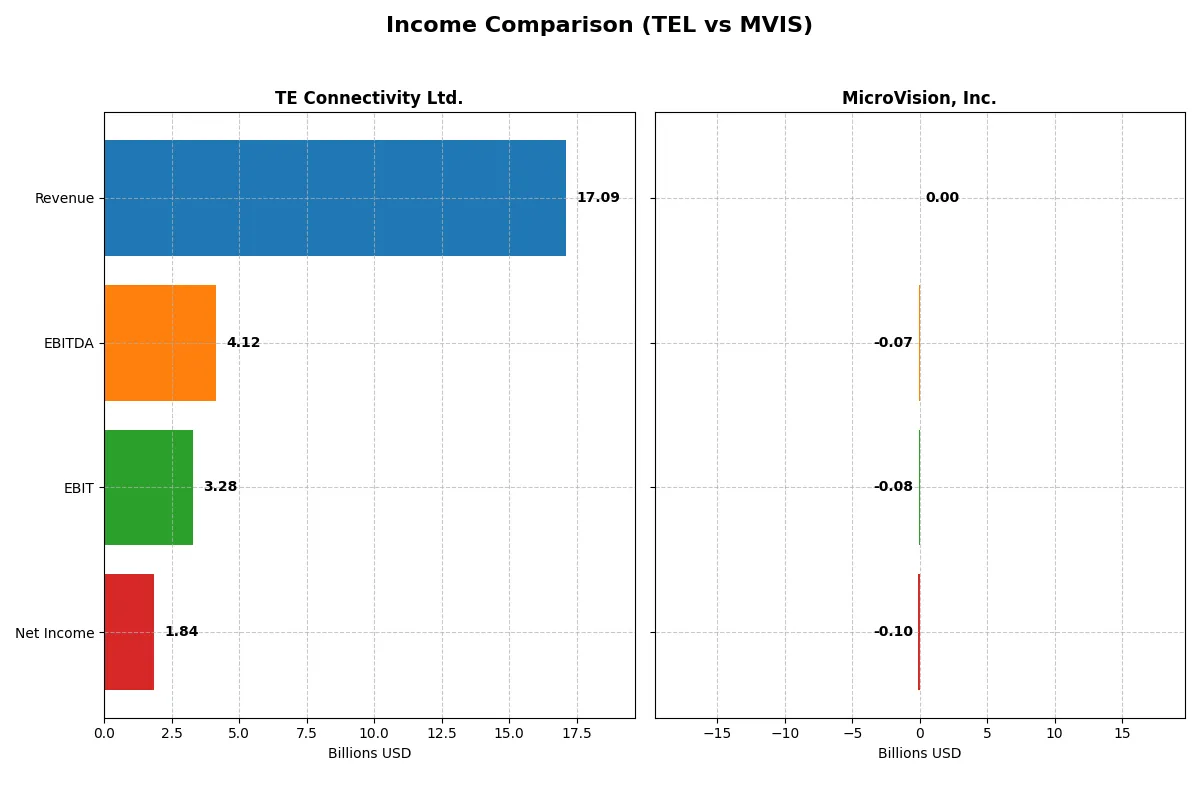
The following data dissects the core profitability and scalability of both corporate engines to reveal who dominates the bottom line:
| Metric | TE Connectivity Ltd. (TEL) | MicroVision, Inc. (MVIS) |
|---|---|---|
| Revenue | 17.1B | 4.7M |
| Cost of Revenue | 11.2B | 7.5M |
| Operating Expenses | 2.7B | 82.7M |
| Gross Profit | 5.9B | -2.8M |
| EBITDA | 4.1B | -71.0M |
| EBIT | 3.3B | -75.2M |
| Interest Expense | 77M | 4.5M |
| Net Income | 1.8B | -97.0M |
| EPS | 6.2 | -0.46 |
| Fiscal Year | 2025 | 2024 |
Income Statement Analysis: The Bottom-Line Duel
This income statement comparison reveals which company drives profitability and operational efficiency more effectively in their respective markets.
TE Connectivity Ltd. Analysis
TE Connectivity’s revenue rose steadily to $17.1B in 2025, up 7.85% from 2024, with gross profit expanding to $5.91B. Its gross margin of 34.6% and EBIT margin of 19.2% confirm strong operational leverage. Despite a net income decline to $1.84B, margin resilience and favorable expense control demonstrate solid momentum.
MicroVision, Inc. Analysis
MicroVision’s 2024 revenue dropped 35% to $4.7M, with gross profit turning negative at -$2.8M. The company suffers from a severe negative gross margin (-60.3%) and a deep EBIT loss of $75.2M. Persistent operating losses and high interest expense (95% of revenue) highlight ongoing challenges in scaling and profitability.
Margin Dominance vs. Struggling Scalability
TE Connectivity clearly outperforms MicroVision, delivering robust margins and positive operating cash flow despite recent net income pressure. MicroVision’s steep losses and poor margin metrics signal structural inefficiencies. Investors seeking stable, profitable growth will find TE’s profile far more compelling than MicroVision’s high-risk, low-margin trajectory.
Financial Ratios Comparison
These vital ratios act as a diagnostic tool to expose underlying fiscal health, valuation premiums, and capital efficiency for clear investment insights:
| Ratios | TE Connectivity Ltd. (TEL) | MicroVision, Inc. (MVIS) |
|---|---|---|
| ROE | 14.64% | -198.72% |
| ROIC | 8.82% | -83.73% |
| P/E | 35.0 | -2.83 |
| P/B | 5.12 | 5.63 |
| Current Ratio | 1.56 | 1.79 |
| Quick Ratio | 1.03 | 1.74 |
| D/E | 0.52 | 1.06 |
| Debt-to-Assets | 26.1% | 42.6% |
| Interest Coverage | 41.7 | -19.2 |
| Asset Turnover | 0.68 | 0.04 |
| Fixed Asset Turnover | 3.96 | 0.20 |
| Payout Ratio | 43.6% | 0% |
| Dividend Yield | 1.25% | 0% |
| Fiscal Year | 2025 | 2024 |
Efficiency & Valuation Duel: The Vital Signs
Ratios act as a company’s DNA, revealing hidden risks and operational excellence that go beyond surface-level financials.
TE Connectivity Ltd.
TE Connectivity posts a solid 14.6% ROE with a favorable 10.8% net margin, reflecting efficient core profitability. However, the stock appears stretched with a high P/E of 35 and a P/B of 5.12, signaling premium valuation. The company returns value through a 1.25% dividend yield and reinvests significantly in R&D at 4.9% of revenue.
MicroVision, Inc.
MicroVision struggles with deeply negative profitability metrics: a -198.7% ROE and a -2063.8% net margin. The stock’s P/E is negative but paired with a high P/B of 5.63, indicating valuation dislocation. Lacking dividends, MicroVision focuses heavily on R&D investment, spending over 10 times its revenue, aiming for future growth despite current inefficiencies.
Premium Valuation vs. Operational Struggles
TE Connectivity offers a balanced profile with operational strength but expensive valuation, suitable for income and stability seekers. MicroVision’s ratios highlight a high-risk growth story with weak fundamentals and stretched valuation. Investors must weigh TE’s consistent returns against MicroVision’s speculative innovation potential.
Which one offers the Superior Shareholder Reward?
I see TE Connectivity Ltd. (TEL) delivers consistent dividends with yields around 1.2–1.9% and payout ratios under 44%, supported by strong free cash flow coverage (~77%). Their moderate buyback activity further boosts returns. MicroVision, Inc. (MVIS) pays no dividends and burns cash with steep negative margins and weak cash flow. MVIS reinvests aggressively in R&D but lacks buyback programs and shows unstable solvency. Historically, TEL’s balanced dividend and buyback approach offers more sustainable, attractive total shareholder returns in 2026. I favor TEL for disciplined capital allocation and resilience versus MVIS’s speculative growth model.
Comparative Score Analysis: The Strategic Profile
The radar chart reveals the core financial DNA and trade-offs of TE Connectivity Ltd. and MicroVision, Inc., highlighting their contrasting strategic strengths:
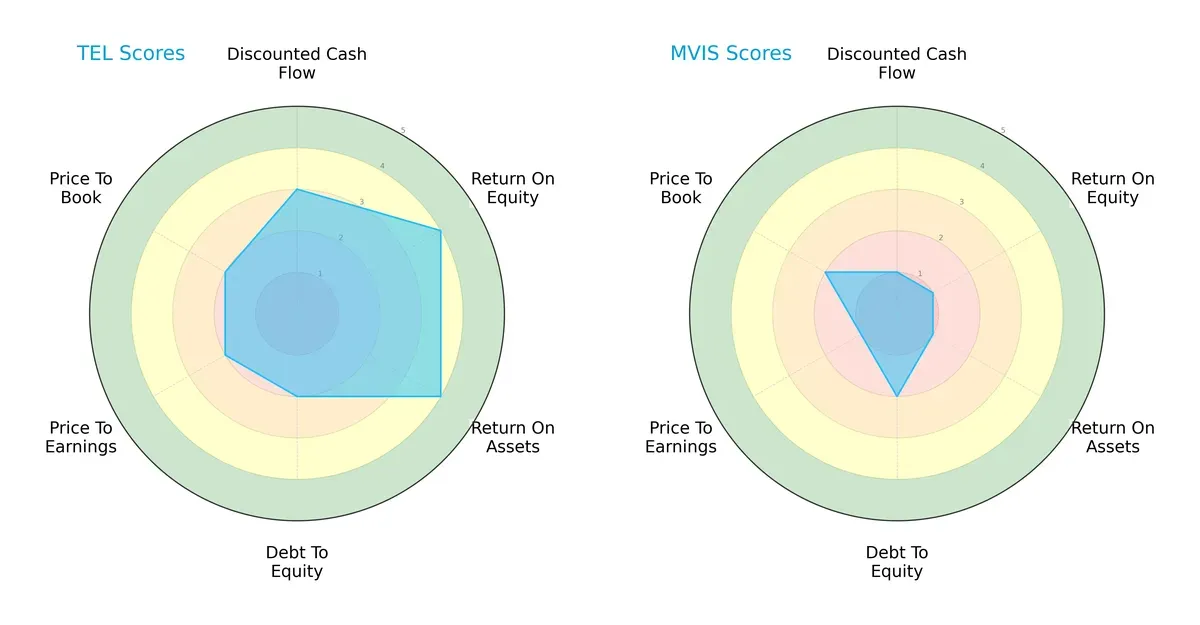
TE Connectivity exhibits a balanced profile with solid DCF (3), ROE (4), and ROA (4) scores, signaling efficient profitability and asset utilization. However, its moderate debt-to-equity (2) and valuation scores (P/E and P/B at 2) suggest prudent leverage and fair market pricing. Conversely, MicroVision relies on weaker fundamentals, scoring very low in DCF (1), ROE (1), ROA (1), and P/E (1), indicating high risk and undervaluation concerns. TE’s diversified strengths command a strategic edge over MicroVision’s narrow, distressed profile.
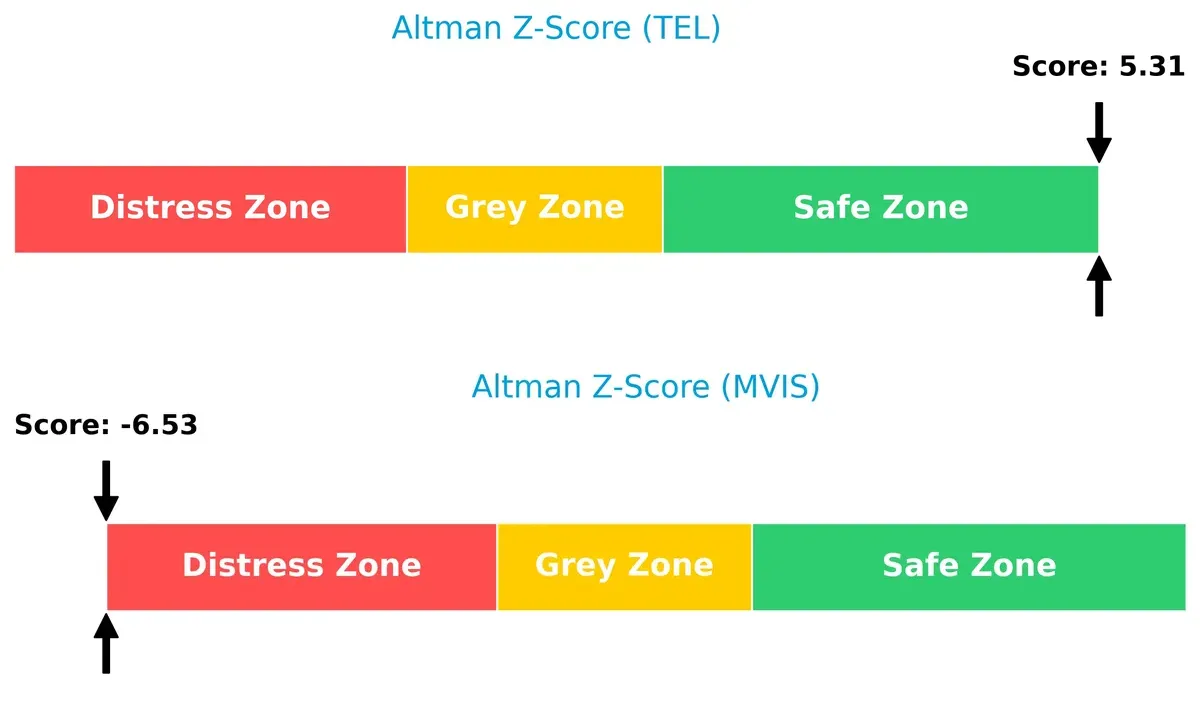
Bankruptcy Risk: Solvency Showdown
TE Connectivity’s Altman Z-Score of 5.3 places it firmly in the safe zone, implying strong solvency and low bankruptcy risk. MicroVision’s -6.5 score signals severe financial distress and a high probability of insolvency in this economic cycle:
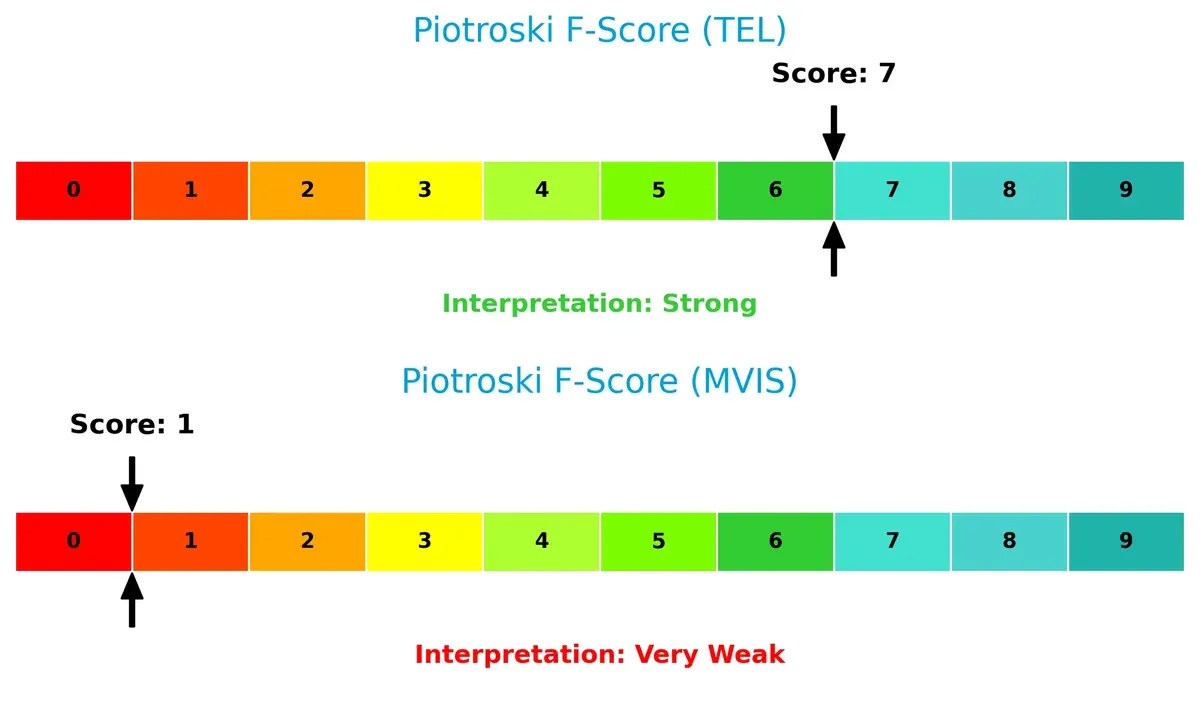
Financial Health: Quality of Operations
TE Connectivity’s Piotroski F-Score of 7 reflects robust financial health with strong profitability and operational efficiency. In stark contrast, MicroVision’s score of 1 flags significant red flags in internal financial metrics, underscoring fragile fundamentals and poor value potential:
How are the two companies positioned?
This section dissects the operational DNA of TEL and MVIS by comparing their revenue distribution and internal dynamics. The goal is to confront their economic moats and identify which model offers the most resilient competitive advantage today.
Revenue Segmentation: The Strategic Mix
The following visual comparison dissects how TE Connectivity Ltd. and MicroVision, Inc. diversify their income streams and where their primary sector bets lie:
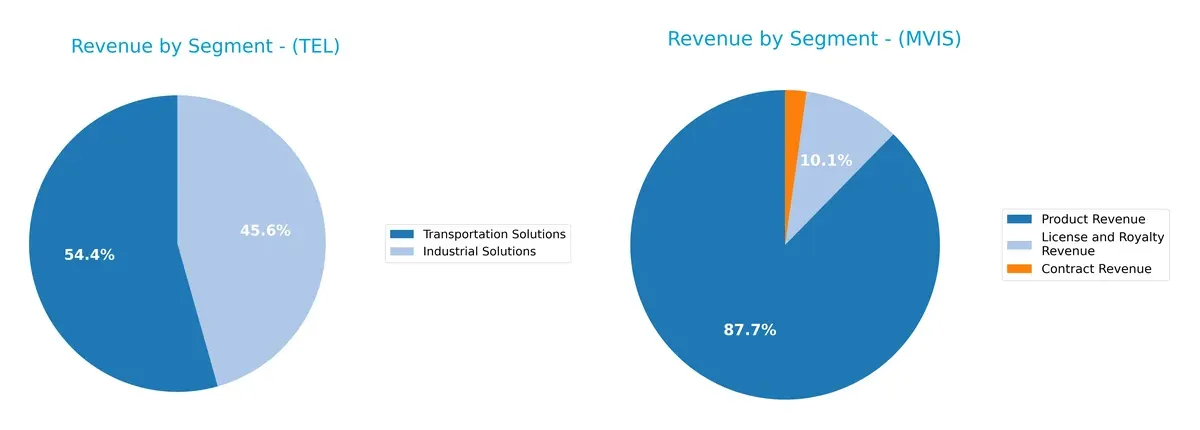
TE Connectivity dwarfs MicroVision in scale, with $9.4B anchored in Transportation and $7.9B from Industrial Solutions, showing a focused but balanced industrial infrastructure mix. MicroVision pivots mainly on Product Revenue at $4.1M, with smaller License and Contract streams. TE’s concentration in heavy industry signals ecosystem lock-in and infrastructure dominance. MicroVision’s narrower, tech-licensing mix exposes it to higher volatility and concentration risk.
Strengths and Weaknesses Comparison
This table compares the Strengths and Weaknesses of TE Connectivity Ltd. and MicroVision, Inc.:
TEL Strengths
- Diversified revenue across Industrial and Transportation sectors
- Balanced global presence including China, US, Europe
- Favorable net margin at 10.78%
- Strong liquidity ratios (current 1.56, quick 1.03)
- Low debt to assets at 26.12%
- High interest coverage at 42.61
MVIS Strengths
- Favorable PE ratio due to negative earnings
- Strong liquidity with current ratio 1.79 and quick ratio 1.74
TEL Weaknesses
- PE of 35.0 and PB of 5.12 considered high
- Neutral ROE and ROIC close to WACC
- Asset turnover moderate at 0.68
MVIS Weaknesses
- Severely negative profitability ratios (net margin, ROE, ROIC)
- Unfavorable debt to equity and interest coverage
- Very low asset turnover at 0.04
- No dividend yield
- Narrow product and revenue diversification
TEL shows solid profitability and global footprint with sound liquidity and manageable leverage. MVIS struggles with deep losses and limited operational efficiency, despite decent liquidity. TEL’s scale and diversification support resilience, while MVIS faces material financial risks that challenge its growth prospects.
The Moat Duel: Analyzing Competitive Defensibility
A structural moat is the only barrier protecting long-term profits from relentless competitive pressure and erosion in market share:
TE Connectivity Ltd.: Scale-Driven Diversification Moat
TE Connectivity leverages vast scale and diversified industrial markets, reflected in stable 19% EBIT margins and broad geographic reach. Yet, declining ROIC signals rising capital inefficiency, challenging moat durability in 2026.
MicroVision, Inc.: Innovation-Dependent Technological Moat
MicroVision’s moat rests on its proprietary lidar technology, enabling growth in niche autonomous driving markets. Despite negative margins, improving ROIC suggests emerging value creation potential, contrasting TE’s scale with innovation-driven expansion.
Verdict: Scale Diversification vs. Innovation Trajectory
TE Connectivity’s broader, established moat faces pressure from declining profitability, while MicroVision’s narrower, tech-focused moat shows early signs of improvement. TE still better defends its market share but must address capital allocation urgently.
Which stock offers better returns?
The past year reveals contrasting dynamics: TE Connectivity’s stock surged significantly while MicroVision’s shares declined sharply, reflecting divergent investor sentiment and market momentum.
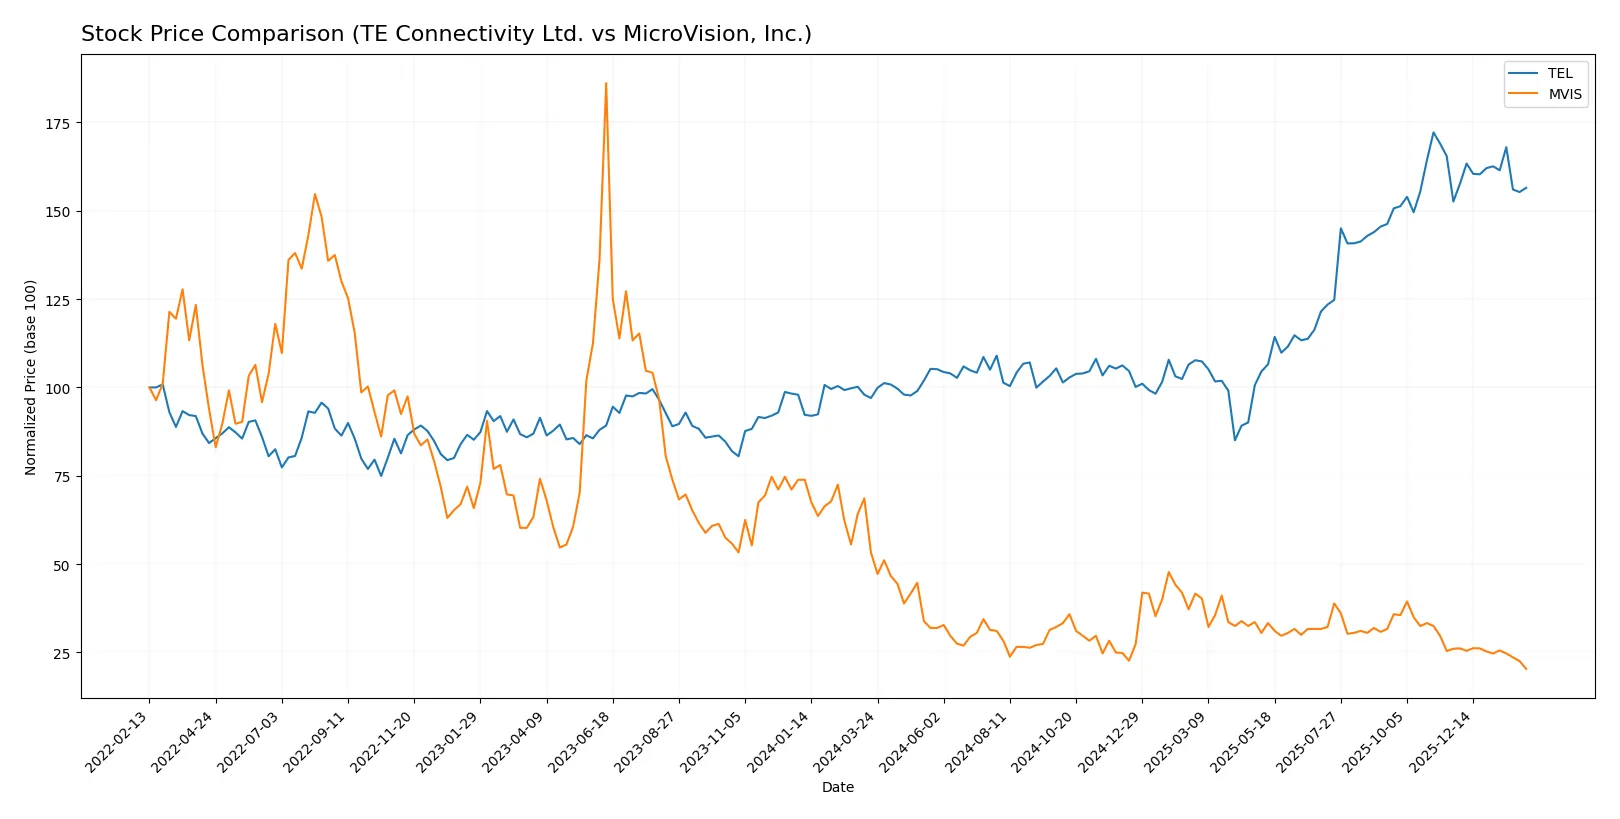
Trend Comparison
TE Connectivity’s stock shows a strong bullish trend over the past 12 months with a 61.33% gain, though momentum has decelerated recently. The price ranged widely from 122 to 247.
MicroVision’s stock exhibits a pronounced bearish trend, falling 61.82% over the same period with decelerating losses. The price fluctuated narrowly between 0.73 and 1.92.
TE Connectivity outperformed MicroVision decisively, delivering the highest market returns with a substantial positive price change versus MicroVision’s steep decline.
Target Prices
Analysts present a clear consensus on target prices for TE Connectivity Ltd. and MicroVision, Inc.
| Company | Target Low | Target High | Consensus |
|---|---|---|---|
| TE Connectivity Ltd. | 238 | 306 | 270.29 |
| MicroVision, Inc. | 5 | 5 | 5 |
TE Connectivity’s consensus target sits about 20% above its current price of 225.55, signaling moderate upside potential. MicroVision’s consensus target at $5 contrasts sharply with its current $0.73 price, implying high risk and volatility expectations.

Don’t Let Luck Decide Your Entry Point
Optimize your entry points with our advanced ProRealTime indicators. You’ll get efficient buy signals with precise price targets for maximum performance. Start outperforming now!
How do institutions grade them?
The following tables summarize the latest grades assigned by established grading companies for each company:
TE Connectivity Ltd. Grades
This table shows recent ratings from major financial institutions for TE Connectivity Ltd.
| Grading Company | Action | New Grade | Date |
|---|---|---|---|
| Oppenheimer | Upgrade | Outperform | 2026-01-27 |
| Barclays | Maintain | Overweight | 2026-01-23 |
| Truist Securities | Maintain | Hold | 2026-01-22 |
| Wells Fargo | Maintain | Equal Weight | 2026-01-22 |
| UBS | Maintain | Buy | 2026-01-14 |
| Truist Securities | Maintain | Hold | 2025-12-19 |
| Wells Fargo | Maintain | Equal Weight | 2025-12-09 |
| Truist Securities | Maintain | Hold | 2025-11-21 |
| Barclays | Maintain | Overweight | 2025-11-21 |
| TD Cowen | Maintain | Buy | 2025-11-17 |
MicroVision, Inc. Grades
This table presents ongoing positive ratings from recognized financial firms for MicroVision, Inc.
| Grading Company | Action | New Grade | Date |
|---|---|---|---|
| D. Boral Capital | Maintain | Buy | 2026-01-27 |
| D. Boral Capital | Maintain | Buy | 2025-12-16 |
| D. Boral Capital | Maintain | Buy | 2025-11-12 |
| WestPark Capital | Maintain | Buy | 2025-10-21 |
| WestPark Capital | Maintain | Buy | 2025-09-05 |
| D. Boral Capital | Maintain | Buy | 2025-09-02 |
| WestPark Capital | Maintain | Buy | 2025-08-27 |
| D. Boral Capital | Maintain | Buy | 2025-08-11 |
| D. Boral Capital | Maintain | Buy | 2025-05-21 |
| D. Boral Capital | Maintain | Buy | 2025-05-13 |
Which company has the best grades?
TE Connectivity shows a broader spectrum of grades, including upgrades to Outperform and consistent Buy ratings, indicating institutional confidence. MicroVision maintains a steady Buy rating from fewer firms. Investors might interpret TE Connectivity’s varied yet strong grades as reflecting balanced risk and opportunity.
Risks specific to each company
The following categories identify the critical pressure points and systemic threats facing both firms in the 2026 market environment:
1. Market & Competition
TE Connectivity Ltd.
- Established in diversified connectivity markets with strong global presence and stable demand.
MicroVision, Inc.
- Operates in niche lidar and AR markets, facing high competitive pressure and uncertain adoption rates.
2. Capital Structure & Debt
TE Connectivity Ltd.
- Moderate debt-to-equity ratio at 0.52 with strong interest coverage of 42.61, indicating solid debt management.
MicroVision, Inc.
- High debt-to-equity ratio at 1.06 and negative interest coverage, signaling financial strain and refinancing risk.
3. Stock Volatility
TE Connectivity Ltd.
- Beta of 1.235 suggests moderate volatility, aligned with sector averages.
MicroVision, Inc.
- Slightly higher beta at 1.274, reflecting greater price swings and investor uncertainty.
4. Regulatory & Legal
TE Connectivity Ltd.
- Exposure to global regulations across multiple industries but with established compliance protocols.
MicroVision, Inc.
- Faces evolving regulations in autonomous vehicle and AR sectors, increasing compliance complexity.
5. Supply Chain & Operations
TE Connectivity Ltd.
- Broad international supply chain with diversification reducing operational risks.
MicroVision, Inc.
- Smaller scale and specialized suppliers increase vulnerability to supply chain disruptions.
6. ESG & Climate Transition
TE Connectivity Ltd.
- Ongoing initiatives to reduce carbon footprint in energy-intensive manufacturing.
MicroVision, Inc.
- Early-stage efforts in sustainability with potential exposure to ESG-related investor scrutiny.
7. Geopolitical Exposure
TE Connectivity Ltd.
- Operates in 140 countries, facing risks from trade tensions but benefits from geographic diversification.
MicroVision, Inc.
- Primarily US-based with focused market exposure, mitigating some geopolitical risks but limiting global reach.
Which company shows a better risk-adjusted profile?
TE Connectivity Ltd. shows a superior risk-adjusted profile. Its stable capital structure, strong interest coverage, and diversified operations reduce systemic vulnerabilities. MicroVision faces critical financial distress, reflected in its negative profitability metrics and weak Altman Z-score, heightening bankruptcy risk. TE’s scale and financial strength create a more resilient investment case.
Final Verdict: Which stock to choose?
TE Connectivity Ltd. (TEL) stands out as a cash-generating industrial powerhouse with solid operational efficiency. Its main point of vigilance is a premium valuation that might pressure returns. TEL suits portfolios aiming for steady, moderate growth with a tilt toward quality and resilience.
MicroVision, Inc. (MVIS) offers a strategic moat in emerging sensor technologies, backed by a high R&D intensity that could fuel future innovation. It carries considerably higher risk and financial instability compared to TEL. MVIS fits speculative growth portfolios that tolerate volatility for potential breakthrough gains.
If you prioritize reliable cash flow and operational strength, TEL is the compelling choice due to its proven industrial footing and favorable income metrics. However, if you seek high-risk, high-reward innovation exposure, MVIS offers superior upside potential despite financial fragility. Each appeals to distinct investor profiles, reflecting a trade-off between stability and speculative growth.
Disclaimer: Investment carries a risk of loss of initial capital. The past performance is not a reliable indicator of future results. Be sure to understand risks before making an investment decision.
Go Further
I encourage you to read the complete analyses of TE Connectivity Ltd. and MicroVision, Inc. to enhance your investment decisions: