Home > Comparison > Technology > SANM vs MVIS
The strategic rivalry between Sanmina Corporation and MicroVision, Inc. shapes the trajectory of the technology sector’s hardware landscape. Sanmina operates as a capital-intensive integrated manufacturing solutions provider, serving diverse industries with scale and precision. MicroVision, by contrast, focuses on innovative, high-tech lidar and display modules, embodying a nimble, specialized hardware developer model. This analysis evaluates which company’s strategy offers superior risk-adjusted returns for a diversified portfolio amid evolving market demands.

Table of contents
Companies Overview
Sanmina and MicroVision stand as pivotal players in the hardware and equipment sector, each with distinct market footprints.
Sanmina Corporation: Integrated Manufacturing Powerhouse
Sanmina dominates as a provider of integrated manufacturing solutions worldwide. It earns revenue through comprehensive services including product design, prototyping, assembly, and supply chain management. In 2026, Sanmina focuses strategically on expanding its footprint in industries like aerospace, defense, and cloud solutions, leveraging its vast manufacturing scale and technological versatility.
MicroVision, Inc.: Lidar and Display Innovator
MicroVision specializes in advanced lidar sensors and micro-display technologies for automotive safety and augmented reality. Its revenue stems mainly from innovative laser beam scanning and MEMS modules sold to OEMs and ODMs. In 2026, MicroVision prioritizes enhancing its lidar range and AR headset capabilities, aiming to lead in next-generation sensing and interactive display markets.
Strategic Collision: Similarities & Divergences
Sanmina pursues a broad integrated manufacturing model, while MicroVision adopts a niche technology innovation approach. Their primary battleground lies in supplying cutting-edge components to OEMs. Sanmina’s scale and diversified sectors contrast sharply with MicroVision’s specialized tech focus, shaping distinct risk and growth profiles for investors seeking stability versus innovation exposure.
Income Statement Comparison
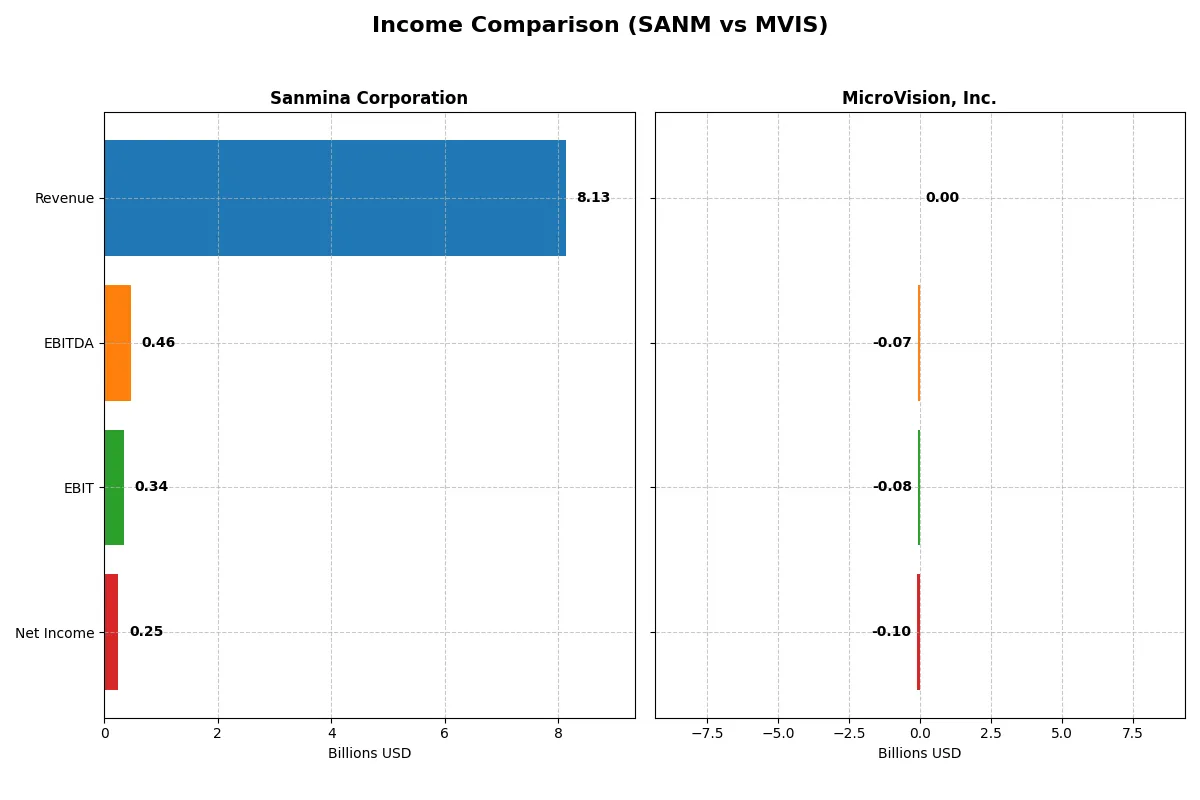
This data dissects the core profitability and scalability of both corporate engines to reveal who dominates the bottom line:
| Metric | Sanmina Corporation (SANM) | MicroVision, Inc. (MVIS) |
|---|---|---|
| Revenue | 8.13B | 4.70M |
| Cost of Revenue | 7.41B | 7.53M |
| Operating Expenses | 362M | 83M |
| Gross Profit | 716M | -2.83M |
| EBITDA | 463M | -71M |
| EBIT | 344M | -75M |
| Interest Expense | 4.30M | 4.46M |
| Net Income | 246M | -97M |
| EPS | 4.56 | -0.46 |
| Fiscal Year | 2025 | 2024 |
Income Statement Analysis: The Bottom-Line Duel
This income statement comparison reveals the true efficiency and profitability of each company’s operational engine over recent years.
Sanmina Corporation Analysis
Sanmina’s revenue grew steadily, reaching $8.13B in 2025, with net income slightly dipping to $246M but maintaining solid momentum. Its gross margin stands at a neutral 8.81%, while net margin holds steady at 3.03%. Despite a slight EBIT decline, Sanmina demonstrates efficient cost control and favorable interest expense, signaling operational resilience.
MicroVision, Inc. Analysis
MicroVision’s revenue shrank to $4.7M in 2024, reflecting a 35% decline year-over-year. The company operates at a steep loss, with a negative gross margin of -60.35% and net margin plunging past -2,000%. Despite a modest EBIT improvement, its persistent high expenses and worsening net losses highlight ongoing efficiency challenges and weak profitability.
Margin Stability vs. Structural Losses
Sanmina clearly outperforms MicroVision, combining revenue growth with positive margins and controlled costs. MicroVision’s shrinking revenue and severe losses undermine its financial health. For investors, Sanmina’s stable profitability and margin discipline present a more attractive profile than MicroVision’s weak income statement and persistent structural deficits.
Financial Ratios Comparison
These vital ratios act as a diagnostic tool to expose the underlying fiscal health, valuation premiums, and capital efficiency of the companies analyzed:
| Ratios | Sanmina Corporation (SANM) | MicroVision, Inc. (MVIS) |
|---|---|---|
| ROE | 10.4% | -198.7% |
| ROIC | 9.0% | -83.7% |
| P/E | 25.6 | -2.8 |
| P/B | 2.67 | 5.63 |
| Current Ratio | 1.72 | 1.79 |
| Quick Ratio | 1.02 | 1.74 |
| D/E | 0.17 | 1.06 |
| Debt-to-Assets | 6.7% | 42.6% |
| Interest Coverage | 82.5 | -19.2 |
| Asset Turnover | 1.39 | 0.04 |
| Fixed Asset Turnover | 11.9 | 0.20 |
| Payout ratio | 0 | 0 |
| Dividend yield | 0% | 0% |
| Fiscal Year | 2025 | 2024 |
Efficiency & Valuation Duel: The Vital Signs
Financial ratios serve as a company’s DNA, exposing hidden risks and operational strengths that raw numbers alone cannot reveal.
Sanmina Corporation
Sanmina’s ROE stands at a modest 10.45%, signaling average profitability, while its net margin at 3.03% is unfavorable. The stock trades at a stretched P/E of 25.59, suggesting expensive valuation relative to earnings. It offers no dividends, focusing instead on reinvestment to sustain growth and operational efficiency.
MicroVision, Inc.
MicroVision posts deeply negative returns: ROE at -198.72% and net margin at -2063.78%, pointing to severe profitability challenges. Despite a negative P/E, its high P/B of 5.63 reveals a premium market valuation. The company pays no dividends, heavily investing in R&D with a staggering 10.44% revenue spend, aiming for future breakthroughs.
Operational Stability vs. Growth Gambit
Sanmina balances moderate profitability with a cautious valuation and solid liquidity, presenting a safer risk profile. MicroVision’s metrics highlight high risk with negative returns but aggressive R&D investment for growth. Conservative investors may prefer Sanmina’s stability; growth-seekers might find MicroVision’s speculative profile more fitting.
Which one offers the Superior Shareholder Reward?
Sanmina Corporation (SANM) does not pay dividends but generates strong free cash flow of $8.6 per share in 2025, supporting robust buybacks, while MicroVision, Inc. (MVIS) offers neither dividends nor sustainable buybacks amid heavy losses and negative cash flow. I see SANM’s capital return strategy as far more sustainable and rewarding for shareholders in 2026.
Comparative Score Analysis: The Strategic Profile
The radar chart reveals the fundamental DNA and trade-offs of Sanmina Corporation and MicroVision, Inc., highlighting their financial strengths and vulnerabilities:
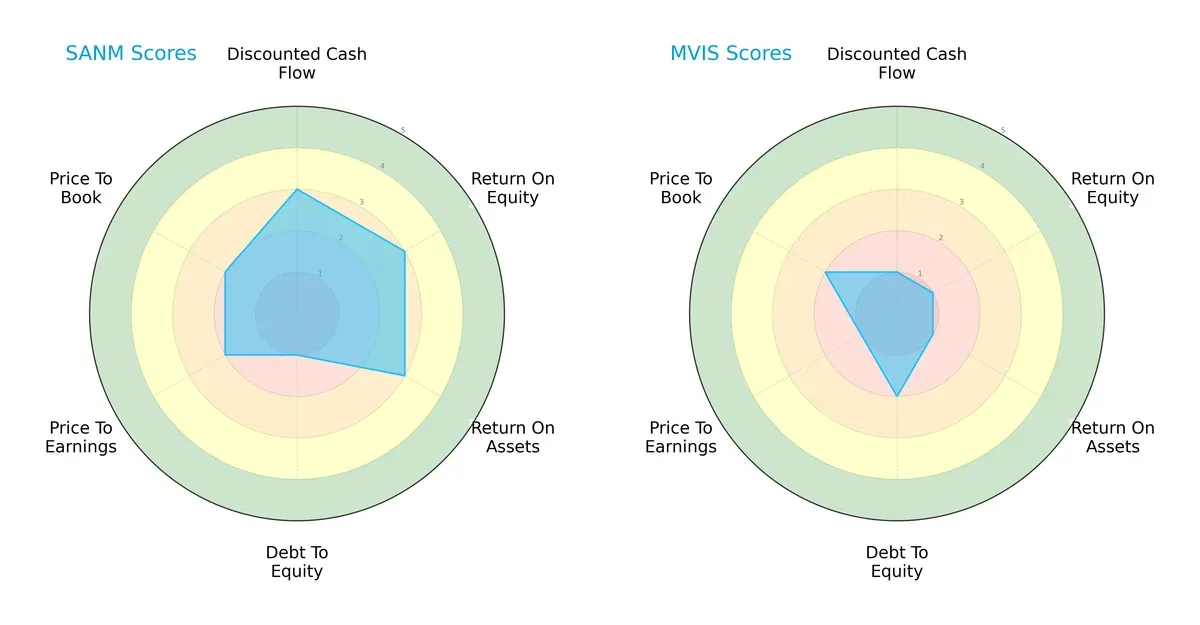
Sanmina demonstrates moderate strength in discounted cash flow, ROE, and ROA, but suffers from a very unfavorable debt-to-equity score, signaling leverage risk. MicroVision lags significantly across most operational metrics but holds a slightly better debt-to-equity position. Sanmina’s profile is more balanced, leveraging operational efficiency, while MicroVision relies heavily on managing financial risk with limited profitability.
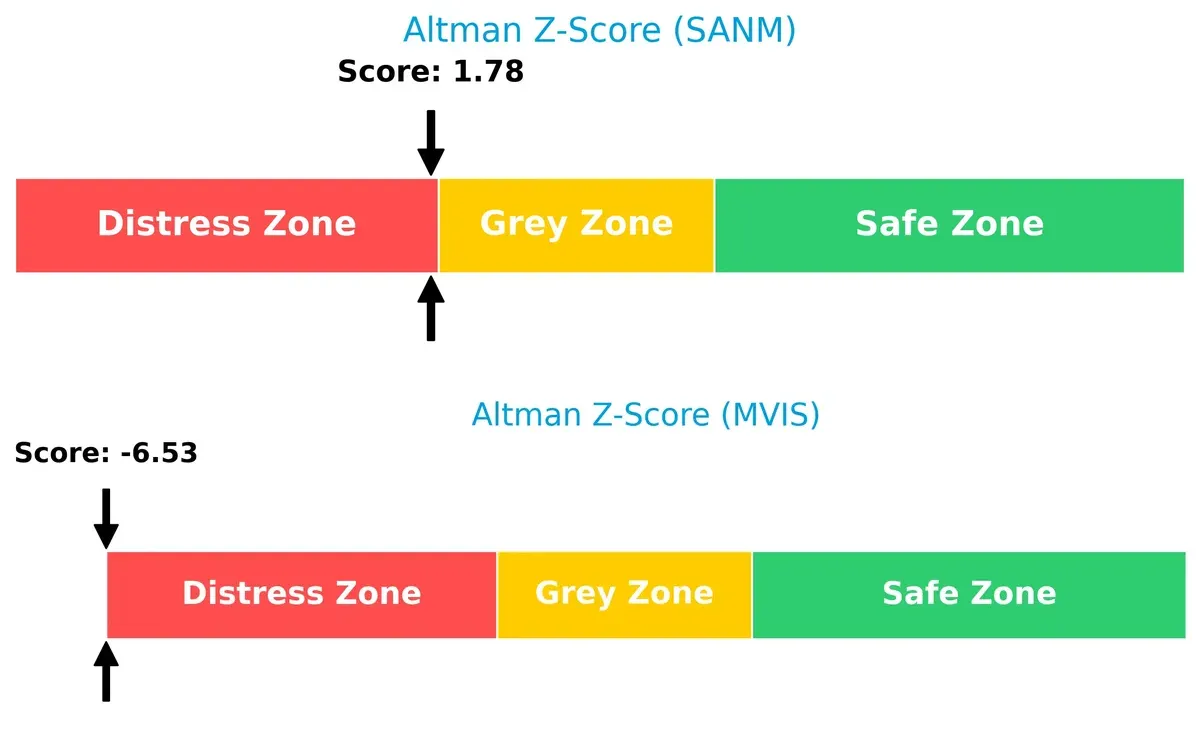
Bankruptcy Risk: Solvency Showdown
Sanmina’s Altman Z-Score of 1.78 slightly surpasses MicroVision’s -6.53, indicating both firms face distress but MicroVision is in a far more precarious position for long-term survival in this cycle:
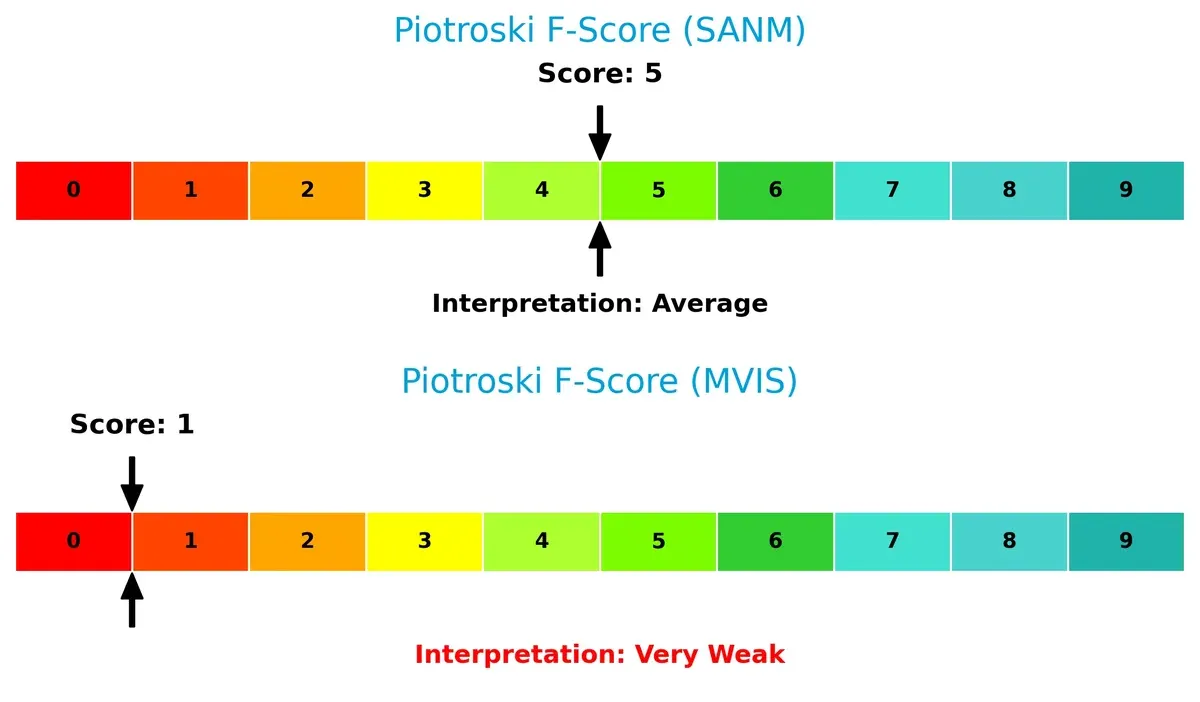
Financial Health: Quality of Operations
Sanmina’s Piotroski F-Score of 5 suggests average financial health, while MicroVision’s score of 1 signals very weak internal performance and operational red flags:
How are the two companies positioned?
This section dissects the operational DNA of Sanmina and MicroVision by comparing their revenue distribution and internal dynamics. The aim is to confront their economic moats to identify the most resilient, sustainable competitive advantage today.
Revenue Segmentation: The Strategic Mix
This comparison dissects how Sanmina Corporation and MicroVision, Inc. diversify their income streams and highlights their primary sector bets:
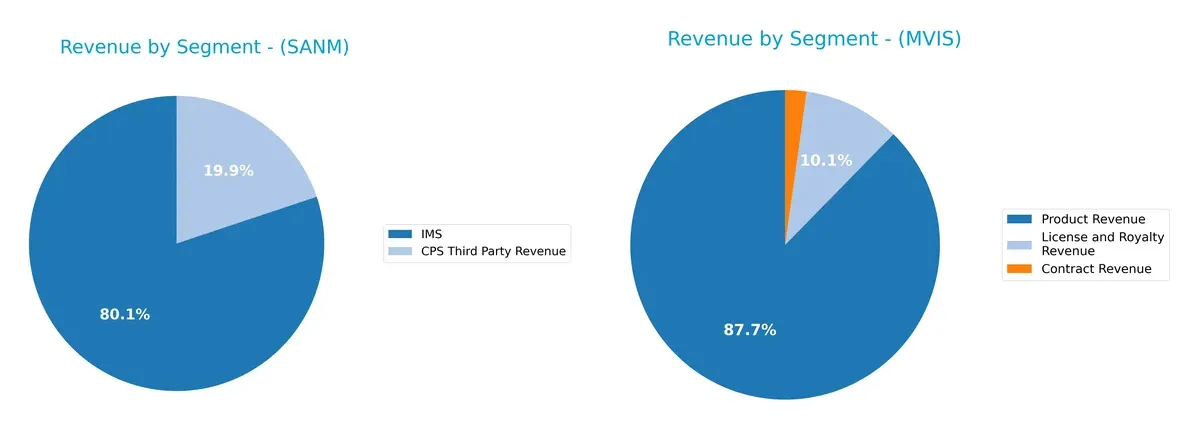
Sanmina anchors its revenue in IMS, generating $6.5B in 2025, dwarfing its CPS Third Party segment at $1.6B. This mix signals infrastructure dominance with a solid diversification into manufacturing services. MicroVision’s 2024 revenue, led by $4.1M in Product and $475K in License and Royalty, shows higher concentration but limited scale. Sanmina’s broader base reduces risk, while MicroVision leans on niche tech licensing and product sales, exposing it to higher volatility.
Strengths and Weaknesses Comparison
This table compares the Strengths and Weaknesses of Sanmina Corporation and MicroVision, Inc.:
Sanmina Corporation Strengths
- Strong diversification with multiple revenue segments
- Favorable liquidity ratios (current 1.72, quick 1.02)
- Low debt levels (DE 0.17, debt/assets 6.73%)
- High asset turnover (1.39) and fixed asset turnover (11.91)
- Positive ROIC (9.04%) above WACC (8.42%)
MicroVision, Inc. Strengths
- Favorable P/E ratio (-2.83) indicating attractive valuation
- Good liquidity ratios (current 1.79, quick 1.74)
- Neutral debt to assets at 42.62%
- License and royalty revenue stream present
- Some product revenue diversification
Sanmina Corporation Weaknesses
- Unfavorable net margin at 3.03% signals profitability pressure
- Unfavorable P/E at 25.59 suggests valuation premium
- No dividend yield
- Neutral ROE at 10.45% may limit investor appeal
- Exposure to cyclical industries impacts margin stability
MicroVision, Inc. Weaknesses
- Severe negative profitability metrics (net margin -2063.78%, ROE -198.72%, ROIC -83.73%)
- High debt equity ratio (1.06) and negative interest coverage (-16.87)
- Very low asset turnover (0.04) and fixed asset turnover (0.2)
- Unfavorable P/B ratio (5.63) indicates expensive valuation
- No dividend yield and high financial risk
Sanmina shows a balanced financial profile with solid liquidity and operational efficiency but faces margin pressure and valuation risks. MicroVision struggles with critical profitability and leverage issues despite decent liquidity, signaling significant operational challenges. Each company’s financial structure and performance strongly shape their strategic options going forward.
The Moat Duel: Analyzing Competitive Defensibility
A structural moat is the only lasting defense that protects long-term profits from relentless competitive erosion. Let’s examine two distinct moats in play:
Sanmina Corporation: Cost Advantage and Scale Efficiency
Sanmina’s moat stems from its integrated manufacturing scale and supply chain expertise. This shows in stable margins and moderate ROIC, though profitability edges down. New markets in aerospace and cloud hardware could deepen its cost leadership in 2026.
MicroVision, Inc.: Innovation-Driven Technology Moat
MicroVision relies on cutting-edge lidar and scanning tech, a stark contrast to Sanmina’s scale focus. Despite heavy losses, its ROIC trend improves, hinting at growing value creation potential. 2026 could unlock expansion via autonomous driving applications.
Scale Efficiency vs. Innovation Potential: The Moat Verdict
Sanmina’s moat is wider, grounded in proven manufacturing scale and stable cash flows. MicroVision’s moat is narrower but deepening, fueled by innovation and technology breakthroughs. Sanmina remains better positioned to defend current market share; MicroVision bets on future disruption.
Which stock offers better returns?
The past year showed starkly contrasting price moves: Sanmina soared over 150%, while MicroVision declined sharply, reflecting divergent trading dynamics and investor sentiment.
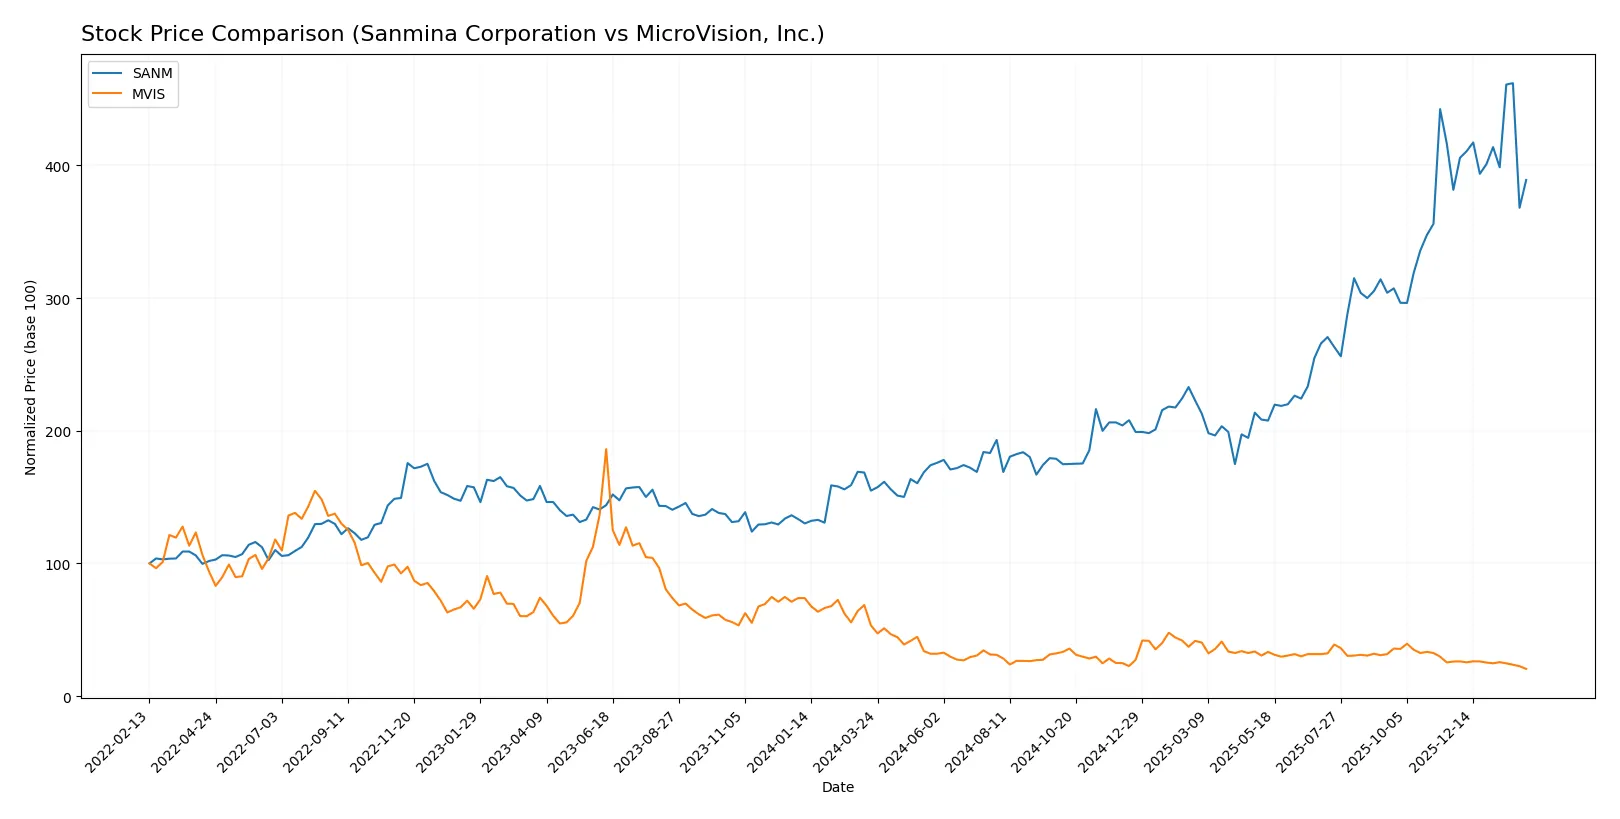
Trend Comparison
Sanmina Corporation’s stock rose 151.2% over the last 12 months, marking a strong bullish trend with decelerating momentum and notable volatility (32.22 std dev).
MicroVision, Inc. experienced a 61.5% price drop over the same period, confirming a bearish trend with decelerating decline and minimal volatility (0.23 std dev).
Sanmina vastly outperformed MicroVision, delivering the highest market returns through a sustained bullish trend versus MicroVision’s prolonged bearish trajectory.
Target Prices
Analysts set a clear consensus on target prices for these two technology hardware firms.
| Company | Target Low | Target High | Consensus |
|---|---|---|---|
| Sanmina Corporation | 200 | 200 | 200 |
| MicroVision, Inc. | 5 | 5 | 5 |
Sanmina’s consensus target of $200 is about 33% above the current $151 price, signaling upside potential. MicroVision’s $5 target is nearly 6.8 times its sub-$1 share price, reflecting high growth expectations but also elevated risk.

Don’t Let Luck Decide Your Entry Point
Optimize your entry points with our advanced ProRealTime indicators. You’ll get efficient buy signals with precise price targets for maximum performance. Start outperforming now!
How do institutions grade them?
Institutional grades for Sanmina Corporation and MicroVision, Inc. reflect recent analyst actions and opinions:
Sanmina Corporation Grades
The following table summarizes recent grades from major grading firms for Sanmina Corporation:
| Grading Company | Action | New Grade | Date |
|---|---|---|---|
| Argus Research | Maintain | Buy | 2026-01-28 |
| B of A Securities | Maintain | Neutral | 2025-07-11 |
| B of A Securities | Maintain | Neutral | 2025-06-09 |
| B of A Securities | Upgrade | Neutral | 2025-01-29 |
| Craig-Hallum | Maintain | Hold | 2024-11-05 |
MicroVision, Inc. Grades
The following table presents recent institutional grades for MicroVision, Inc.:
| Grading Company | Action | New Grade | Date |
|---|---|---|---|
| D. Boral Capital | Maintain | Buy | 2026-01-27 |
| D. Boral Capital | Maintain | Buy | 2025-12-16 |
| D. Boral Capital | Maintain | Buy | 2025-11-12 |
| WestPark Capital | Maintain | Buy | 2025-10-21 |
| WestPark Capital | Maintain | Buy | 2025-09-05 |
Which company has the best grades?
MicroVision, Inc. consistently receives “Buy” ratings from multiple firms, showing strong analyst confidence. Sanmina Corporation’s grades vary between “Buy,” “Neutral,” and “Hold,” indicating mixed sentiment. Investors may view MicroVision’s uniform “Buy” consensus as a stronger endorsement.
Risks specific to each company
The following categories identify the critical pressure points and systemic threats facing both firms in the 2026 market environment:
1. Market & Competition
Sanmina Corporation
- Operates in diverse manufacturing sectors with established OEM relationships, facing intense competition from global EMS providers.
MicroVision, Inc.
- Focuses on niche lidar and AR tech, competing against larger, well-funded firms in rapidly evolving markets.
2. Capital Structure & Debt
Sanmina Corporation
- Maintains low debt-to-equity ratio (0.17), strong interest coverage (80x), signaling solid financial stability.
MicroVision, Inc.
- High debt-to-equity ratio (1.06) and negative interest coverage reflect leveraged and risky capital structure.
3. Stock Volatility
Sanmina Corporation
- Beta near market average (1.03) with moderate price range, indicating typical market volatility.
MicroVision, Inc.
- Elevated beta (1.27) and wide trading range suggest higher volatility and speculative trading conditions.
4. Regulatory & Legal
Sanmina Corporation
- Exposure to regulatory standards in defense and aerospace; compliance risk moderate but well-managed.
MicroVision, Inc.
- Faces regulatory hurdles in automotive lidar safety and AR device approvals, increasing compliance complexity.
5. Supply Chain & Operations
Sanmina Corporation
- Integrated global manufacturing network mitigates supply risks but sensitive to semiconductor shortages.
MicroVision, Inc.
- Smaller scale and reliance on specialized components heighten supply chain vulnerability and operational risks.
6. ESG & Climate Transition
Sanmina Corporation
- Progressive ESG initiatives in manufacturing processes; moderate exposure to climate transition risks.
MicroVision, Inc.
- Emerging tech focus with less established ESG frameworks; potential risks from regulatory shifts and consumer expectations.
7. Geopolitical Exposure
Sanmina Corporation
- Global operations subject to trade tensions but diversified client base reduces concentrated geopolitical risk.
MicroVision, Inc.
- Limited geographic footprint but sensitive to US-China tech rivalry impacting supply and market access.
Which company shows a better risk-adjusted profile?
Sanmina’s low leverage and solid operating metrics contrast sharply with MicroVision’s financial distress signals and high volatility. Sanmina’s main risk lies in competitive pressure from global EMS firms. MicroVision’s critical risk is its precarious capital structure combined with weak profitability. The 2025 Altman Z-score places both firms in distress, but Sanmina’s moderate Piotroski score reflects better financial health. Overall, Sanmina offers a superior risk-adjusted profile grounded in stability and scale, while MicroVision remains highly speculative and vulnerable to market shocks.
Final Verdict: Which stock to choose?
Sanmina Corporation’s superpower lies in its robust operational efficiency and solid cash conversion. It sustains healthy liquidity and a strong asset turnover, supporting steady growth. A point of vigilance remains its slightly declining ROIC, signaling potential pressure on long-term value creation. It suits portfolios focused on stable income with moderate growth.
MicroVision, Inc. commands a strategic moat rooted in cutting-edge R&D and niche technological innovation. However, it carries high financial risk with negative profitability and persistent losses. Compared to Sanmina, it offers lower safety but potential upside for risk-tolerant investors. It fits a high-risk, speculative growth portfolio aiming for turnaround gains.
If you prioritize consistent cash flow and operational resilience, Sanmina outshines due to its efficient capital use and market position. However, if you seek high-reward speculative bets with exposure to emerging tech, MicroVision offers superior asymmetric upside despite financial instability. Each scenario depends critically on your risk appetite and investment horizon.
Disclaimer: Investment carries a risk of loss of initial capital. The past performance is not a reliable indicator of future results. Be sure to understand risks before making an investment decision.
Go Further
I encourage you to read the complete analyses of Sanmina Corporation and MicroVision, Inc. to enhance your investment decisions: