Home > Comparison > Technology > SNDK vs MVIS
The competition between Sandisk Corporation and MicroVision, Inc. shapes the evolution of the technology sector’s hardware segment. Sandisk operates as a capital-intensive leader in storage solutions, while MicroVision focuses on innovative lidar and micro-display technologies with a leaner structure. This analysis evaluates their contrasting operational models, aiming to identify which company offers a superior risk-adjusted return for a diversified portfolio amid evolving tech demands.
Table of contents
Companies Overview
Sandisk Corporation and MicroVision, Inc. represent two distinct players driving innovation in the hardware and technology sectors.
Sandisk Corporation: Storage Technology Leader
Sandisk Corporation dominates the NAND flash storage market, generating revenue through solid state drives, embedded products, and removable cards. In 2026, the company focuses on advancing storage density and performance to meet growing data demands. Sandisk’s solid market position stems from its deep expertise in flash technology and broad product portfolio.
MicroVision, Inc.: Lidar and Display Innovator
MicroVision, Inc. specializes in lidar sensors and micro-display systems for automotive safety, AR headsets, and smart devices. Its revenue comes from original equipment manufacturers relying on its laser beam scanning tech. In 2026, MicroVision targets expanding applications in autonomous driving and consumer lidar, leveraging proprietary MEMS technology to carve niche markets.
Strategic Collision: Similarities & Divergences
Both companies operate in hardware but with contrasting strategies. Sandisk pursues a volume-driven, commodity storage model with broad industrial adoption. MicroVision adopts a specialized, innovation-intensive approach focusing on emerging lidar and AR markets. Their battle unfolds on the frontier of next-gen sensor and memory tech, offering investors sharply different risk and growth profiles—Sandisk with steady scale versus MicroVision’s high-volatility innovation play.
Income Statement Comparison
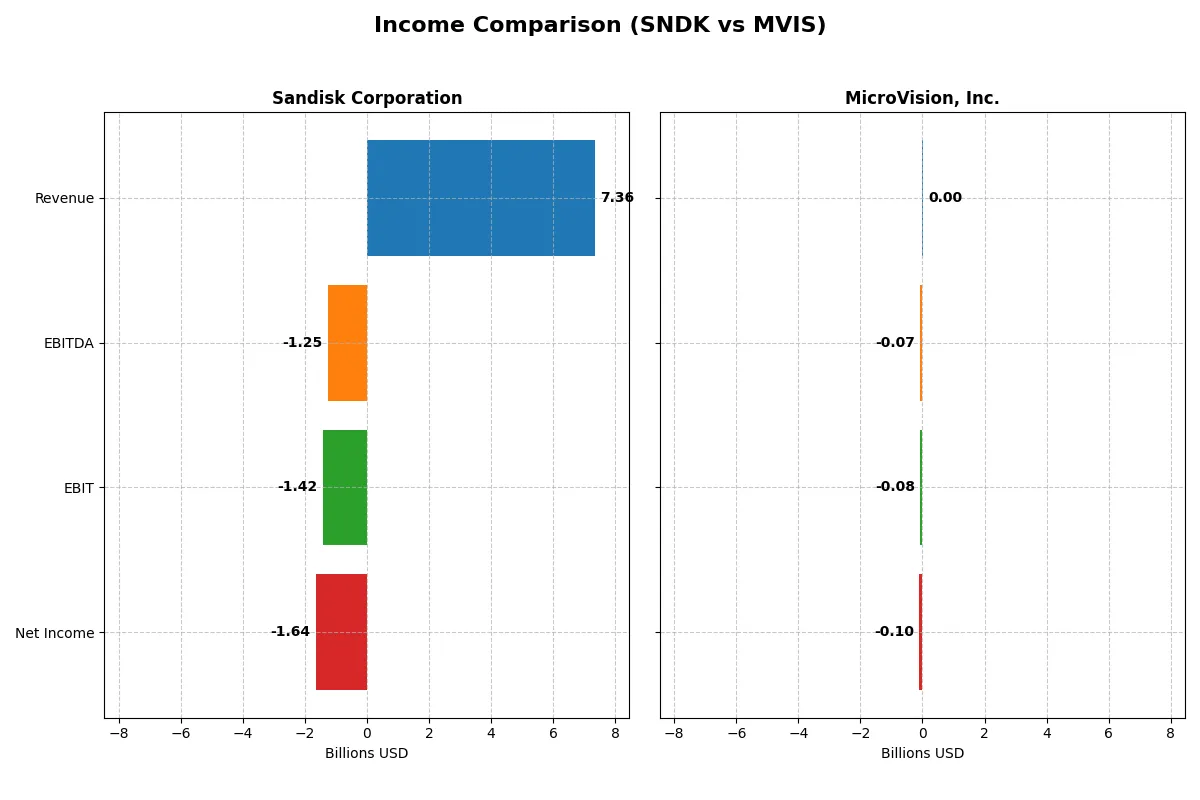
The following data dissects the core profitability and scalability of both corporate engines to reveal who dominates the bottom line:
| Metric | Sandisk Corporation (SNDK) | MicroVision, Inc. (MVIS) |
|---|---|---|
| Revenue | 7.4B | 4.7M |
| Cost of Revenue | 5.1B | 7.5M |
| Operating Expenses | 3.6B | 82.7M |
| Gross Profit | 2.2B | -2.8M |
| EBITDA | -1.3B | -71.0M |
| EBIT | -1.4B | -75.2M |
| Interest Expense | 63M | 4.5M |
| Net Income | -1.6B | -97.0M |
| EPS | -11.32 | -0.46 |
| Fiscal Year | 2025 | 2024 |
Income Statement Analysis: The Bottom-Line Duel
This income statement comparison reveals how efficiently each company converts revenue into profit and manages costs over recent years.
Sandisk Corporation Analysis
Sandisk’s revenue grew from 6.1B in 2023 to 7.4B in 2025, yet net income swung from 430M gross profit in 2023 to a -1.64B net loss in 2025. Its gross margin improved to 30.1%, but persistent operating losses dragged the net margin down to -22.3%. Despite revenue momentum, profitability deteriorated sharply, signaling efficiency challenges.
MicroVision, Inc. Analysis
MicroVision’s revenue fluctuated modestly, peaking at 7.3M in 2023 before falling to 4.7M in 2024, with net income consistently negative, reaching -97M in 2024. The company posted a deeply negative gross margin of -60.4% in 2024, reflecting costs well above sales. Although EBIT improved slightly, high operating expenses and interest burden weigh heavily on margins and bottom-line results.
Margin Power vs. Revenue Scale
Sandisk shows stronger top-line growth and better gross margin control but suffers steep net losses from high expenses. MicroVision struggles with negative gross margins and persistent net losses despite lower revenue scale. Sandisk’s profile suggests greater revenue potential, while MicroVision’s cost structure raises significant concerns. Investors seeking scale may favor Sandisk’s revenue trajectory; however, both face substantial profitability risks.
Financial Ratios Comparison
These vital ratios act as a diagnostic tool to expose the underlying fiscal health, valuation premiums, and capital efficiency of the companies compared below:
| Ratios | Sandisk Corporation (SNDK) | MicroVision, Inc. (MVIS) |
|---|---|---|
| ROE | -17.81% | -198.72% |
| ROIC | -11.89% | -83.73% |
| P/E | -4.17 | -2.83 |
| P/B | 0.74 | 5.63 |
| Current Ratio | 3.56 | 1.79 |
| Quick Ratio | 2.11 | 1.74 |
| D/E | 0.22 | 1.06 |
| Debt-to-Assets | 15.73% | 42.62% |
| Interest Coverage | -21.86 | -19.19 |
| Asset Turnover | 0.57 | 0.04 |
| Fixed Asset Turnover | 11.88 | 0.20 |
| Payout ratio | 0 | 0 |
| Dividend yield | 0 | 0 |
| Fiscal Year | 2025 | 2024 |
Efficiency & Valuation Duel: The Vital Signs
Financial ratios act as a company’s DNA, uncovering hidden risks and strengths behind operational and valuation metrics.
Sandisk Corporation
Sandisk posts negative profitability with ROE at -17.81% and net margin at -22.31%, signaling operational challenges. Yet, its valuation metrics show a low P/E of -4.17 and a modest P/B of 0.74, indicating the stock is attractively priced. The company retains earnings, focusing on R&D (15.4% of revenue) to fuel growth, as it pays no dividend.
MicroVision, Inc.
MicroVision suffers from deeper profitability issues, with ROE at -198.72% and net margin at -2063.78%, reflecting severe losses. Its valuation is stretched, with a high P/B of 5.63 despite a favorable P/E of -2.83. The firm reinvests heavily in R&D (over 7x revenue), showing a high-risk growth strategy and no dividend payouts.
Operational Resilience vs. Growth Gambit
Sandisk offers a more balanced profile with modest valuation and ongoing reinvestment in innovation amid losses. MicroVision’s ratios reveal extreme losses and a stretched valuation, betting heavily on R&D. Conservative investors may prefer Sandisk’s relative operational stability, while risk-tolerant investors might chase MicroVision’s aggressive growth approach.
Which one offers the Superior Shareholder Reward?
Sandisk Corporation (SNDK) and MicroVision, Inc. (MVIS) both forgo dividends, focusing on reinvestment. I note SNDK’s free cash flow remains negative (-$0.83/share in 2025) but with robust buyback potential given a strong current ratio (3.56). MVIS struggles with steep losses and negative margins exceeding -20%, limiting buyback capacity despite a higher cash ratio (1.19). MVIS’s valuation multiples are extreme, reflecting uncertainty. I see SNDK’s conservative debt (debt/equity 0.22) and healthier asset turnover (0.57) as more sustainable. Overall, SNDK’s disciplined capital allocation and moderate leverage offer a superior total return profile in 2026 compared to MVIS’s speculative growth model.
Comparative Score Analysis: The Strategic Profile
The radar chart reveals the core financial DNA and strategic trade-offs between Sandisk Corporation and MicroVision, Inc.:
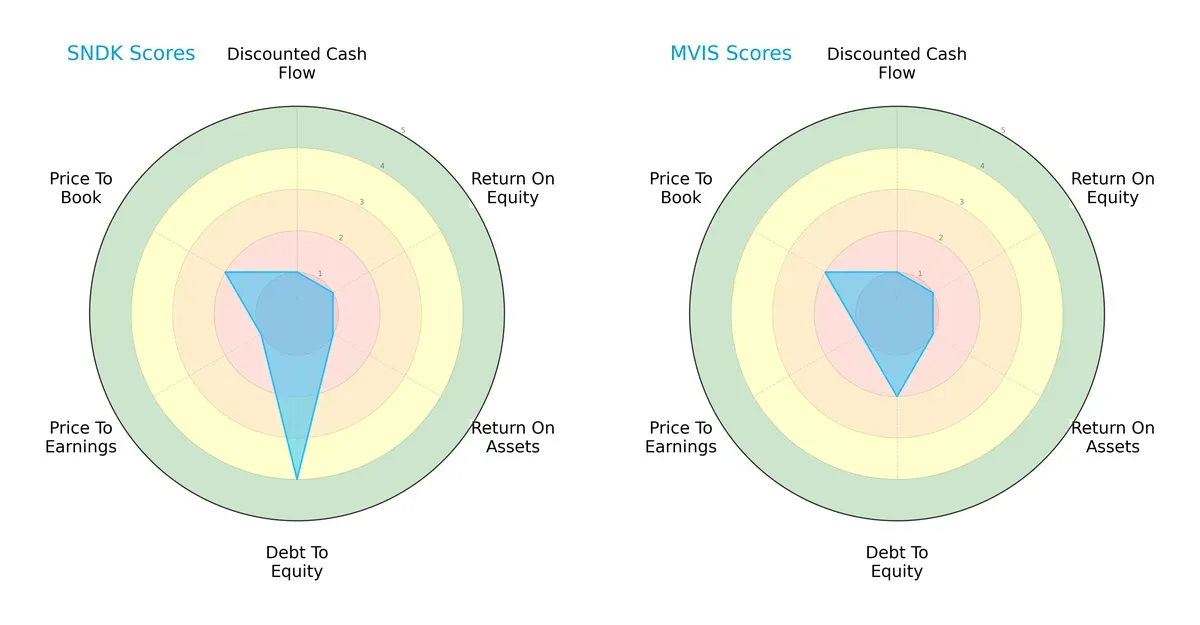
Sandisk displays a more balanced profile with a favorable debt-to-equity score (4) indicating prudent leverage management. However, both firms suffer from weak DCF, ROE, ROA, and valuation metrics, signaling operational and market valuation challenges. MicroVision leans heavily on limited financial strengths, lacking Sandisk’s balance and risking greater volatility.
Bankruptcy Risk: Solvency Showdown
Sandisk’s Altman Z-Score of 18.9 contrasts sharply with MicroVision’s -6.5, highlighting a stark solvency divide:
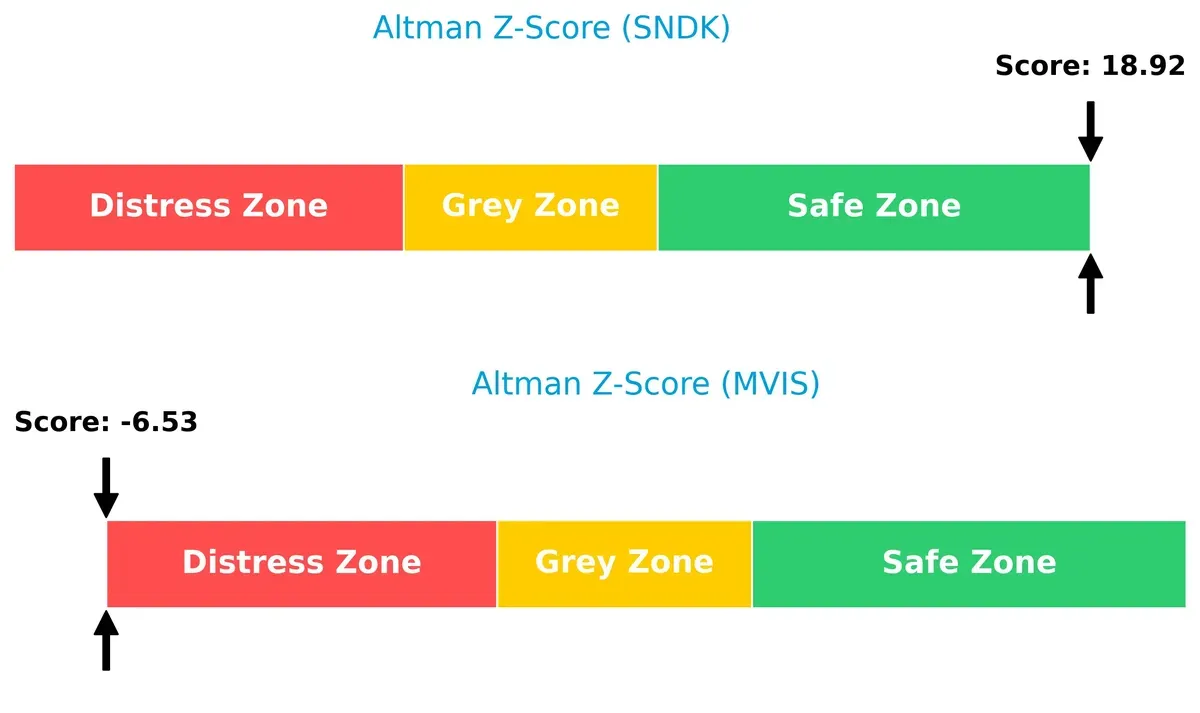
Sandisk sits comfortably in the safe zone, virtually eliminating bankruptcy risk. MicroVision’s distress zone status signals severe financial instability, raising red flags for long-term survival amidst cyclical headwinds.
Financial Health: Quality of Operations
Sandisk’s Piotroski F-Score of 5 surpasses MicroVision’s weak 1, reflecting stronger operational quality:
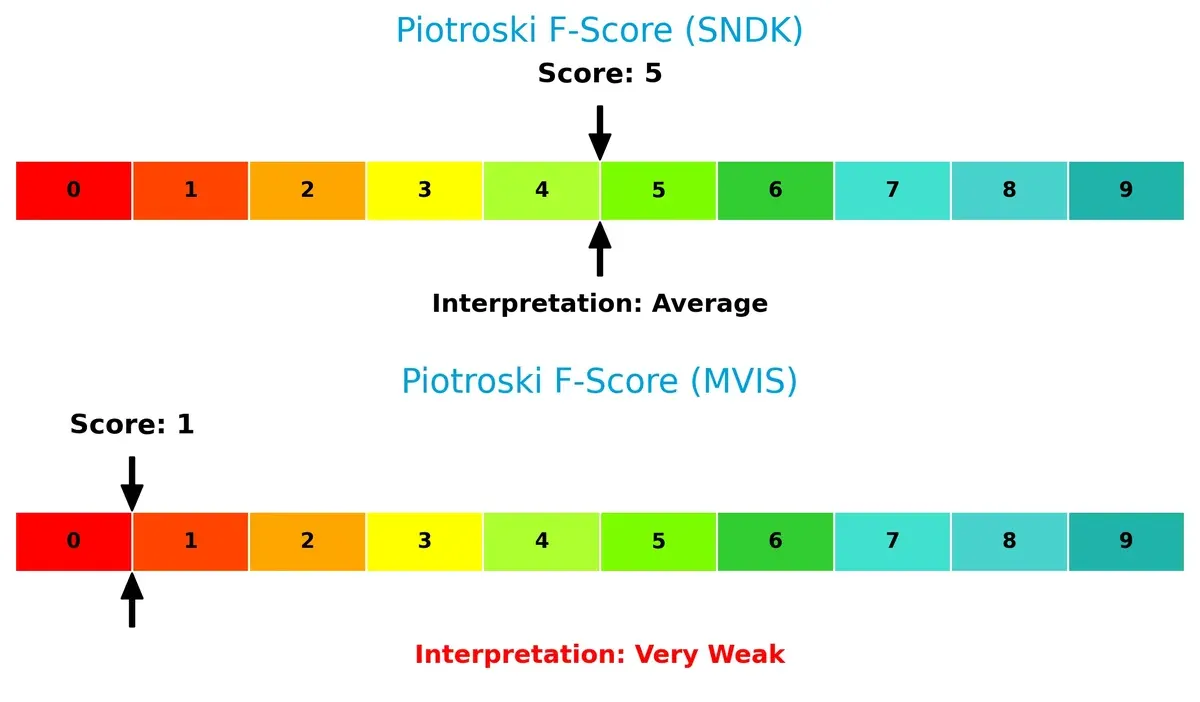
Sandisk’s average score suggests moderate internal strength and resilience. MicroVision, with a very weak score, exhibits significant red flags in profitability and efficiency, undermining its investment appeal.
How are the two companies positioned?
This section dissects Sandisk and MicroVision’s operational DNA by comparing revenue distribution and internal strengths and weaknesses. The goal is to confront their economic moats to identify the most resilient and sustainable competitive advantage today.
Revenue Segmentation: The Strategic Mix
This visual comparison dissects how Sandisk Corporation and MicroVision, Inc. diversify their income streams and where their primary sector bets lie:
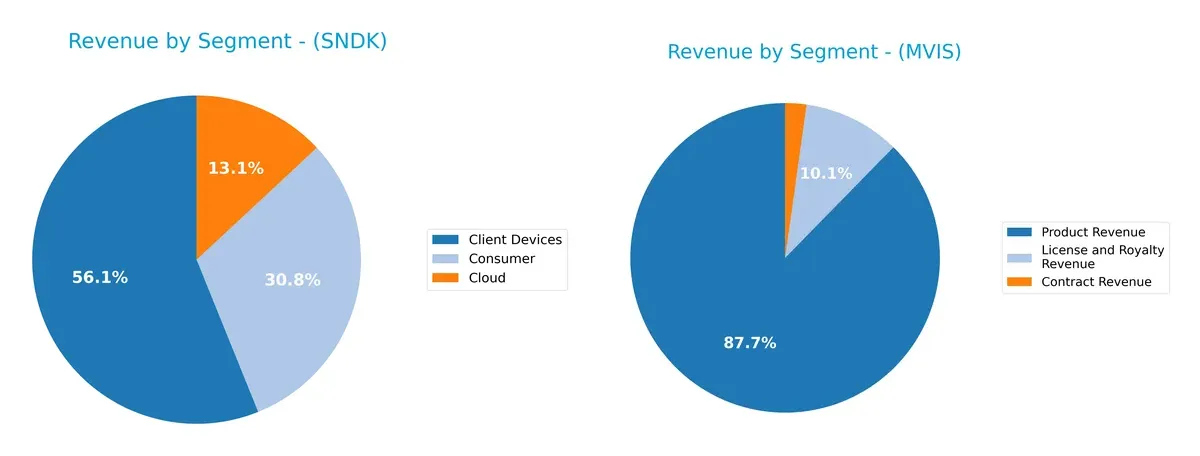
Sandisk anchors 4.13B in Client Devices, dwarfing its 2.27B Consumer and 960M Cloud revenues, showing a strong hardware dominance. MicroVision pivots around Product Revenue at 4.12M, with smaller License and Royalty (475K) and Contract (104K) streams. Sandisk’s concentrated hardware mix implies ecosystem lock-in but risks cyclical downturns. MicroVision’s fragmented, lower scale mix signals a nascent stage with higher diversification risk and uncertain infrastructure dominance.
Strengths and Weaknesses Comparison
This table compares the Strengths and Weaknesses of Sandisk Corporation and MicroVision, Inc.:
Sandisk Corporation Strengths
- Diversified revenue streams across Client Devices, Consumer, and Cloud segments
- Strong global presence with significant sales in China, US, and EMEA
- Favorable quick ratio and low debt-to-assets ratio indicate solid liquidity and conservative leverage
MicroVision, Inc. Strengths
- Favorable current and quick ratios reflect manageable short-term liquidity
- Favorable P/E ratio suggests market values growth potential
- Neutral WACC indicates stable capital costs
Sandisk Corporation Weaknesses
- Negative profitability ratios including net margin, ROE, and ROIC
- High WACC signals expensive capital structure
- Negative interest coverage ratio raises solvency concerns
- Zero dividend yield limits income appeal
MicroVision, Inc. Weaknesses
- Severely negative profitability metrics including net margin and ROE indicate deep losses
- High debt-to-equity ratio signals financial risk
- Unfavorable asset turnover and fixed asset turnover reflect operational inefficiency
- Negative interest coverage ratio heightens default risk
Sandisk’s strengths lie in its diversified revenue base and global reach, but poor profitability and capital costs cloud its financial health. MicroVision exhibits liquidity resilience yet struggles with extreme losses and operational inefficiencies, challenging its financial sustainability. These contrasts highlight differing strategic priorities and risks for each company.
The Moat Duel: Analyzing Competitive Defensibility
A structural moat is the only barrier protecting long-term profits from relentless competitive erosion. Let’s dissect how Sandisk and MicroVision defend their turf:
Sandisk Corporation: Intangible Assets Powerhouse
Sandisk’s moat stems from its advanced NAND flash technology and brand credibility. Despite strong gross margins near 30%, its declining ROIC signals shrinking value creation. New storage innovations in 2026 could either revive or further strain its moat.
MicroVision, Inc.: Emerging Tech with Growing ROIC
MicroVision leverages proprietary lidar and scanning tech as a cost and innovation moat. Unlike Sandisk, its ROIC, though negative, shows an improving trend. Expansion into automotive and AR markets in 2026 may deepen its competitive edge if execution succeeds.
Verdict: Intangible Assets vs. Innovation Growth
Sandisk’s broader market presence and established technology offer a wider moat, but its deteriorating profitability undermines resilience. MicroVision’s narrower, innovation-driven moat is less proven but shows signs of strengthening. Sandisk remains better positioned today to defend market share, yet MicroVision’s improving ROIC hints at future disruption potential.
Which stock offers better returns?
Over the past 12 months, Sandisk Corporation showed exceptional price growth, while MicroVision, Inc. experienced a significant decline, reflecting divergent trading dynamics and investor sentiment.
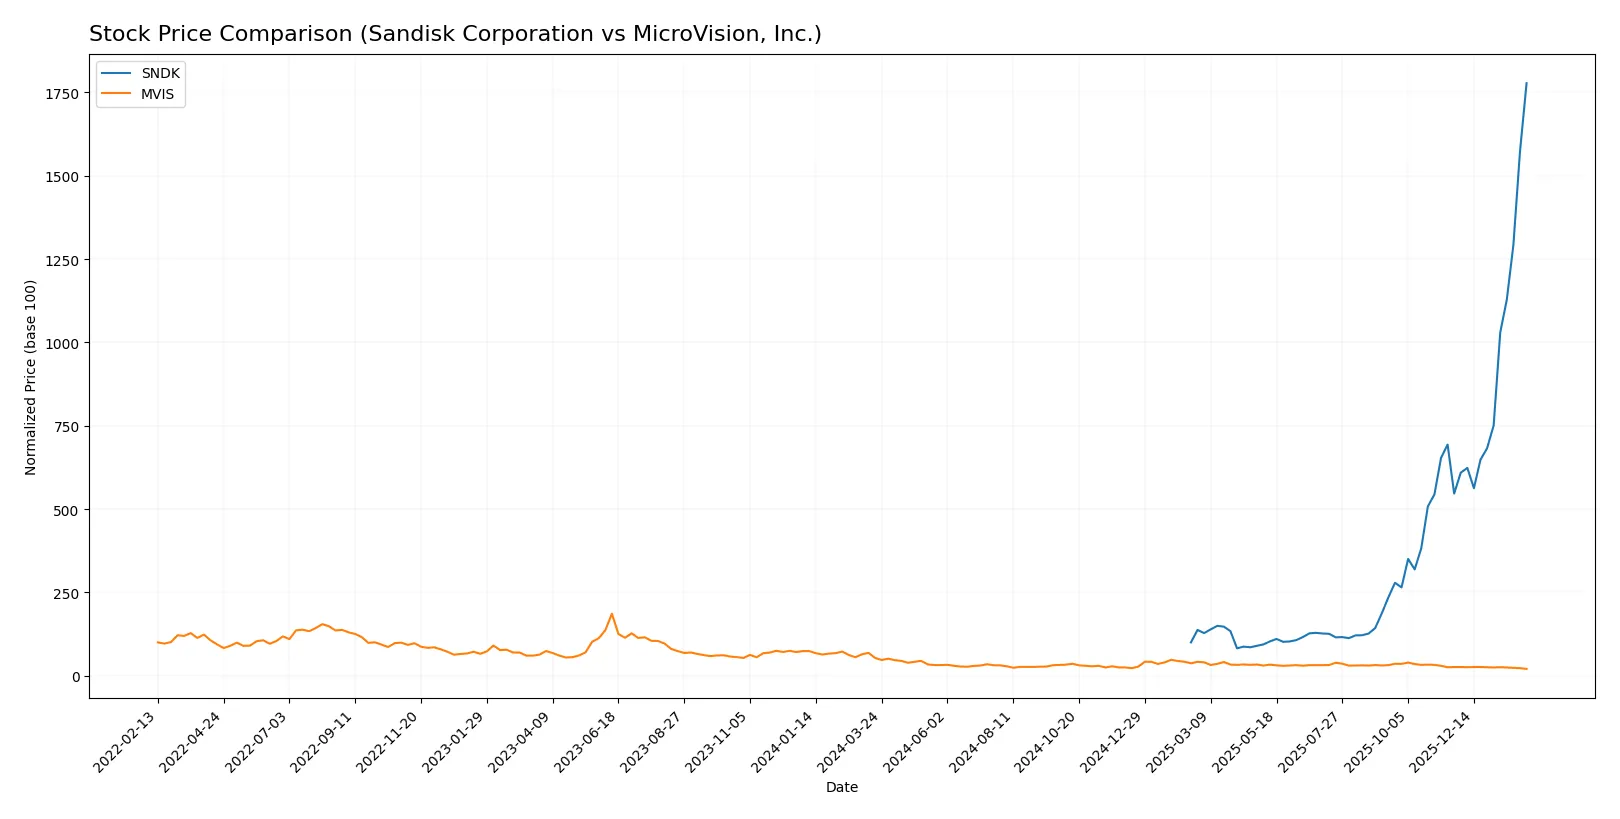
Trend Comparison
Sandisk’s stock surged 1677.63% over the past year, indicating a strong bullish trend with accelerating momentum and high volatility. The price ranged from 30.11 to 651.5.
MicroVision’s stock fell 61.49% over the same period, marking a bearish trend with deceleration and very low volatility. The price fluctuated between 0.74 and 1.92.
Sandisk’s stock dramatically outperformed MicroVision’s, delivering the highest market performance and stronger buyer dominance throughout the period.
Target Prices
Analysts present a broad yet optimistic consensus on Sandisk Corporation and a steady outlook for MicroVision, Inc.
| Company | Target Low | Target High | Consensus |
|---|---|---|---|
| Sandisk Corporation | 220 | 1000 | 675 |
| MicroVision, Inc. | 5 | 5 | 5 |
Sandisk’s consensus target price at 675 suggests a modest upside from its current 654.65, reflecting confidence despite its elevated beta. MicroVision’s flat target at 5 implies strong growth expectations compared to its current 0.74 price.

Don’t Let Luck Decide Your Entry Point
Optimize your entry points with our advanced ProRealTime indicators. You’ll get efficient buy signals with precise price targets for maximum performance. Start outperforming now!
How do institutions grade them?
Here is a summary of recent institutional grades for Sandisk Corporation and MicroVision, Inc.:
Sandisk Corporation Grades
Below are the latest grades issued by reputable financial institutions for Sandisk Corporation.
| Grading Company | Action | New Grade | Date |
|---|---|---|---|
| Barclays | Maintain | Equal Weight | 2026-02-02 |
| Citigroup | Maintain | Buy | 2026-02-02 |
| RBC Capital | Maintain | Sector Perform | 2026-01-30 |
| Wedbush | Maintain | Outperform | 2026-01-30 |
| Jefferies | Maintain | Buy | 2026-01-30 |
| Goldman Sachs | Maintain | Buy | 2026-01-30 |
| Cantor Fitzgerald | Maintain | Overweight | 2026-01-30 |
| Morgan Stanley | Maintain | Overweight | 2026-01-30 |
| Citigroup | Maintain | Buy | 2026-01-20 |
| Benchmark | Maintain | Buy | 2026-01-15 |
MicroVision, Inc. Grades
Here are recent grades from recognized financial firms for MicroVision, Inc.
| Grading Company | Action | New Grade | Date |
|---|---|---|---|
| D. Boral Capital | Maintain | Buy | 2026-01-27 |
| D. Boral Capital | Maintain | Buy | 2025-12-16 |
| D. Boral Capital | Maintain | Buy | 2025-11-12 |
| WestPark Capital | Maintain | Buy | 2025-10-21 |
| WestPark Capital | Maintain | Buy | 2025-09-05 |
| D. Boral Capital | Maintain | Buy | 2025-09-02 |
| WestPark Capital | Maintain | Buy | 2025-08-27 |
| D. Boral Capital | Maintain | Buy | 2025-08-11 |
| D. Boral Capital | Maintain | Buy | 2025-05-21 |
| D. Boral Capital | Maintain | Buy | 2025-05-13 |
Which company has the best grades?
Sandisk Corporation holds a broader range of grades, including multiple Buy and Outperform ratings from top-tier firms. MicroVision, Inc. consistently receives Buy grades but lacks higher-tier ratings. Investors may view Sandisk’s diverse institutional support as a sign of stronger market confidence.
Risks specific to each company
The following categories identify the critical pressure points and systemic threats facing both firms in the 2026 market environment:
1. Market & Competition
Sandisk Corporation
- Dominates NAND flash storage with strong market presence but faces intense competition from larger tech firms.
MicroVision, Inc.
- Operates in niche lidar and AR markets but struggles with limited scale and aggressive competition from established players.
2. Capital Structure & Debt
Sandisk Corporation
- Maintains low debt-to-equity (0.22), signaling financial prudence and balance sheet strength.
MicroVision, Inc.
- Carries high debt-to-equity (1.06), increasing financial risk and vulnerability to interest rate hikes.
3. Stock Volatility
Sandisk Corporation
- Exhibits very high beta (4.80), indicating extreme stock price sensitivity to market swings.
MicroVision, Inc.
- Shows moderate beta (1.27), reflecting relatively lower market volatility exposure.
4. Regulatory & Legal
Sandisk Corporation
- Faces standard technology sector regulatory scrutiny with manageable compliance costs.
MicroVision, Inc.
- Encounters evolving regulatory challenges in autonomous driving lidar technology, heightening legal uncertainty.
5. Supply Chain & Operations
Sandisk Corporation
- Benefits from established global supply chains but exposed to semiconductor material shortages.
MicroVision, Inc.
- Operates with limited operational scale, risking supply chain disruptions and production delays.
6. ESG & Climate Transition
Sandisk Corporation
- Under pressure to improve sustainability practices in manufacturing and reduce carbon footprint.
MicroVision, Inc.
- Faces rising ESG demands linked to new automotive and AR technologies but has room to lead in green innovation.
7. Geopolitical Exposure
Sandisk Corporation
- Exposed to US-China trade tensions impacting semiconductor components sourcing.
MicroVision, Inc.
- Limited global footprint reduces direct geopolitical risks but dependent on international OEM partnerships.
Which company shows a better risk-adjusted profile?
Sandisk’s strongest asset is its solid capital structure and operational scale, despite high stock volatility. MicroVision suffers from severe financial distress, with a weak balance sheet and poor profitability metrics. Sandisk’s Altman Z-Score of 18.9 signals financial safety, while MicroVision’s -6.5 marks distress. The critical risk for Sandisk is its market volatility; for MicroVision, it is financial instability. Overall, Sandisk offers a better risk-adjusted profile, supported by its robust leverage ratios and operational resilience.
Final Verdict: Which stock to choose?
Sandisk Corporation’s superpower lies in its robust liquidity and operational resilience, demonstrated by a strong current ratio and efficient asset turnover. Its main point of vigilance is the persistent value destruction indicated by declining ROIC versus WACC, suggesting caution for value-focused investors. Sandisk fits an aggressive growth portfolio willing to navigate short-term profitability challenges.
MicroVision, Inc. offers a strategic moat in its innovation-driven R&D intensity, hinting at potential long-term technology breakthroughs. Compared to Sandisk, it carries higher financial risk and weaker profitability but shows signs of improving capital efficiency. MicroVision suits a high-risk, speculative growth portfolio that seeks exposure to emerging technologies.
If you prioritize operational stability and liquidity, Sandisk stands out due to its stronger balance sheet and market momentum despite current profitability headwinds. However, if you seek long-term innovation exposure and can tolerate elevated risk, MicroVision offers a scenario of improving fundamentals and technological upside. Both require careful risk management given their profitability challenges.
Disclaimer: Investment carries a risk of loss of initial capital. The past performance is not a reliable indicator of future results. Be sure to understand risks before making an investment decision.
Go Further
I encourage you to read the complete analyses of Sandisk Corporation and MicroVision, Inc. to enhance your investment decisions: