Novanta Inc. and MicroVision, Inc. are two prominent players in the hardware, equipment, and parts industry, each pushing innovation within photonics and lidar technologies. Novanta’s broad portfolio spans medical and industrial markets, while MicroVision specializes in lidar sensors and augmented reality displays. This comparison explores their market positioning and growth potential to help you identify which company offers the most compelling investment opportunity in 2026.
Table of contents
Companies Overview
I will begin the comparison between Novanta Inc. and MicroVision, Inc. by providing an overview of these two companies and their main differences.
Novanta Inc. Overview
Novanta Inc. designs, manufactures, and sells photonics, vision, and precision motion components and sub-systems to OEMs in medical and industrial markets worldwide. It operates across three segments: Photonics, Vision, and Precision Motion, offering products such as laser scanning systems, medical-grade technologies, and precision motors. Headquartered in Bedford, MA, Novanta serves diverse applications including industrial processing, medical imaging, and robotic automation.
MicroVision, Inc. Overview
MicroVision develops lidar sensors for automotive safety and autonomous driving, leveraging laser beam scanning technology based on MEMS and opto-mechanics. The company also designs micro-display and interactive display modules for AR headsets, smart speakers, and smart home systems. Based in Redmond, WA, MicroVision primarily sells to OEMs and ODMs, focusing on innovative lidar and display technologies aimed at emerging markets in mobility and consumer electronics.
Key similarities and differences
Both Novanta and MicroVision operate within the hardware and equipment sector, supplying advanced technology components to OEMs. Novanta’s business is diversified across photonics, vision, and motion control with a broad industrial and medical focus, while MicroVision specializes in lidar and micro-display technologies with an emphasis on automotive and AR applications. Novanta has a significantly larger scale with 3,000 employees and a $4.7B market cap compared to MicroVision’s 185 employees and $292M market cap, reflecting differences in market reach and operational scope.
Income Statement Comparison
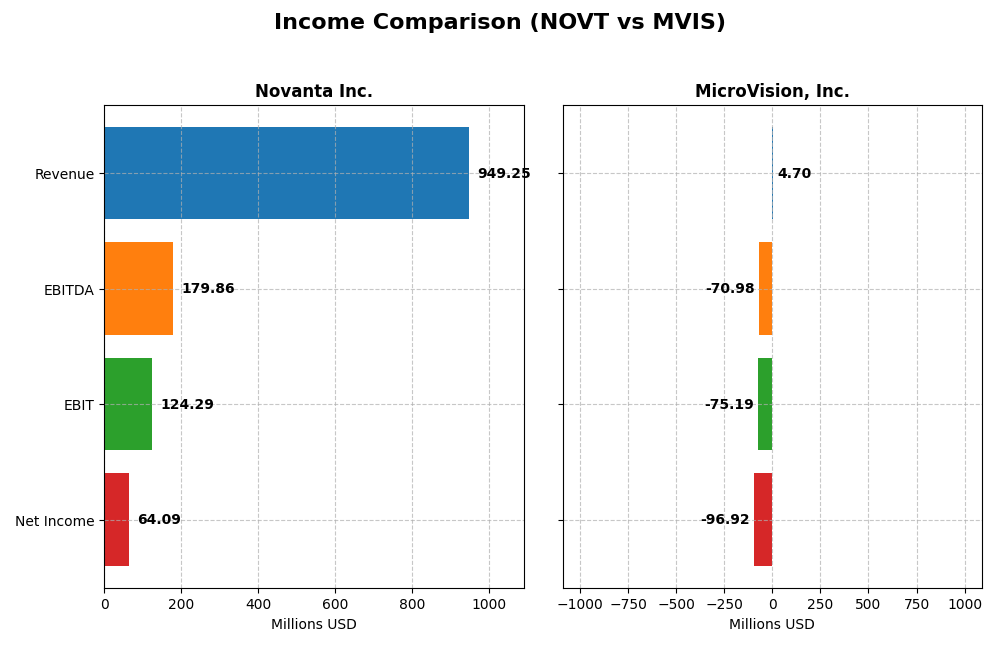
The table below presents a side-by-side comparison of key income statement metrics for Novanta Inc. and MicroVision, Inc. for the fiscal year 2024.
| Metric | Novanta Inc. (NOVT) | MicroVision, Inc. (MVIS) |
|---|---|---|
| Market Cap | 4.7B | 292M |
| Revenue | 949M | 4.7M |
| EBITDA | 180M | -71M |
| EBIT | 124M | -75M |
| Net Income | 64M | -97M |
| EPS | 1.78 | -0.46 |
| Fiscal Year | 2024 | 2024 |
Income Statement Interpretations
Novanta Inc.
Novanta’s revenue grew steadily from $591M in 2020 to $949M in 2024, with net income rising from $44.5M to $64.1M despite a slight dip in 2024. Gross and EBIT margins remained favorable, showing stability and efficiency. The latest year saw revenue growth moderate to 7.7%, while net margin and EPS declined, reflecting margin pressure despite solid top-line expansion.
MicroVision, Inc.
MicroVision’s revenue displayed volatility, peaking at $7.3M in 2023 then falling to $4.7M in 2024. Net losses widened from -$13.6M in 2020 to nearly -$97M in 2024. Margins deteriorated sharply, with negative gross and EBIT margins throughout. The most recent year showed a sharp revenue decline of 35%, deepening net losses and worsening profitability ratios.
Which one has the stronger fundamentals?
Novanta presents stronger fundamentals with consistent revenue growth, positive net income, and favorable margins over five years. MicroVision struggles with persistent losses, negative margins, and declining revenue in the latest year. Novanta’s income statement reflects operational efficiency and resilience, contrasting with MicroVision’s unfavorable profitability and financial stability indicators.
Financial Ratios Comparison
The table below presents a side-by-side comparison of key financial ratios for Novanta Inc. (NOVT) and MicroVision, Inc. (MVIS) based on their most recent fiscal year data from 2024.
| Ratios | Novanta Inc. (NOVT) | MicroVision, Inc. (MVIS) |
|---|---|---|
| ROE | 8.6% | -198.7% |
| ROIC | 7.3% | -83.7% |
| P/E | 85.7 | -2.83 |
| P/B | 7.37 | 5.63 |
| Current Ratio | 2.58 | 1.79 |
| Quick Ratio | 1.72 | 1.74 |
| D/E (Debt-to-Equity) | 0.63 | 1.06 |
| Debt-to-Assets | 33.9% | 42.6% |
| Interest Coverage | 3.51 | -19.19 |
| Asset Turnover | 0.68 | 0.04 |
| Fixed Asset Turnover | 6.08 | 0.20 |
| Payout ratio | 0 | 0 |
| Dividend yield | 0 | 0 |
Interpretation of the Ratios
Novanta Inc.
Novanta’s ratios show a mixed profile with favorable liquidity ratios like a current ratio of 2.58 and a strong fixed asset turnover at 6.08, indicating efficient asset use. However, profitability ratios such as ROE at 8.6% and a high P/E of 85.7 are unfavorable, suggesting valuation concerns. The company does not pay dividends, reflecting a potential focus on reinvestment or growth.
MicroVision, Inc.
MicroVision’s ratios are predominantly weak, with highly negative profitability metrics including a net margin of -2063.78% and ROE at -198.7%. Liquidity ratios are favorable, with a current ratio of 1.79, but heavy debt and poor asset turnover ratios raise concerns. The company also does not pay dividends, likely due to its ongoing losses and focus on R&D and product development.
Which one has the best ratios?
Novanta presents a more balanced financial profile with stronger liquidity and asset efficiency despite some valuation and profitability weaknesses. MicroVision’s ratios indicate significant financial distress with widespread negative profitability and coverage ratios. Overall, Novanta’s ratios are comparatively better, reflecting a more stable operational footing.
Strategic Positioning
This section compares the strategic positioning of Novanta Inc. and MicroVision, Inc. across Market position, Key segments, and Exposure to technological disruption:
Novanta Inc.
- Mid-cap with $4.7B market cap, facing technology sector competition
- Diversified segments: photonics, vision, precision motion, medical and industrial applications
- Exposure to emerging laser and sensor tech in medical and industrial fields
MicroVision, Inc.
- Small-cap with $292M market cap, operating in niche lidar and display markets
- Concentrated on lidar sensors, micro-display, AR modules, and scanning technologies
- High exposure to innovation in lidar and augmented reality technologies
Novanta Inc. vs MicroVision, Inc. Positioning
Novanta pursues a diversified approach across multiple medical and industrial technology segments, offering broad market exposure. MicroVision focuses on specialized lidar and AR display technologies, which could limit market breadth but deepen expertise in growth niches.
Which has the best competitive advantage?
Both companies currently destroy value relative to capital cost but show improving profitability trends. Novanta’s broader market presence may offer more stable returns, while MicroVision’s niche focus entails higher risk and potential reward, reflected in their slightly unfavorable moat evaluations.
Stock Comparison
The past year saw Novanta Inc. (NOVT) experience a notable bearish trend with a 17.12% price decline and accelerating downward momentum, whereas MicroVision, Inc. (MVIS) faced a sharper 51.99% decline with decelerating bearishness; recent months show a slight recovery for NOVT and continued weakness for MVIS.
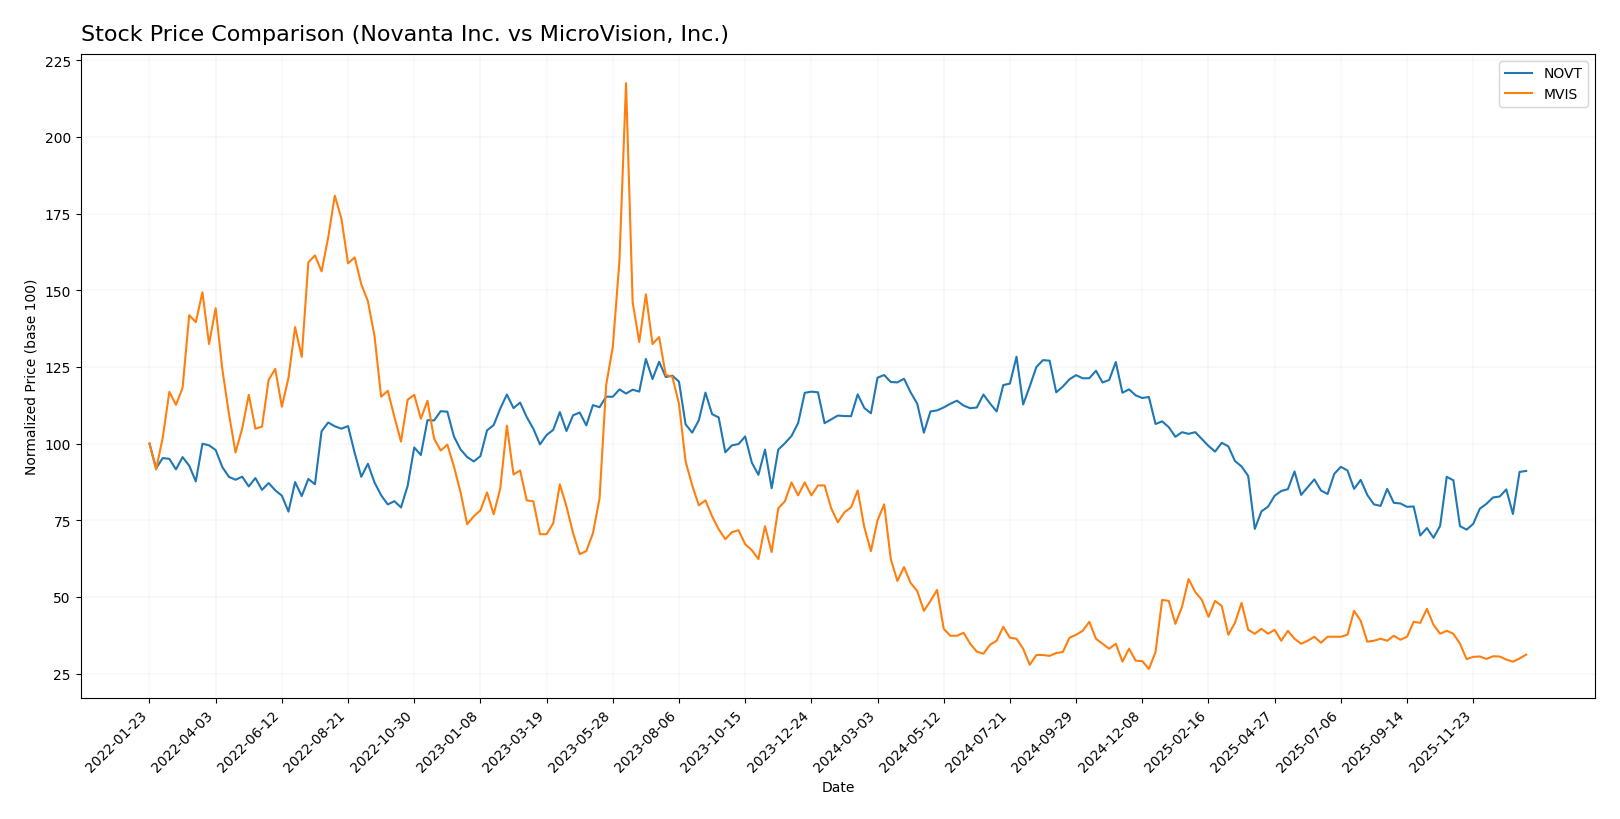
Trend Analysis
Novanta Inc. (NOVT) exhibited a 17.12% price drop over the past 12 months, indicating a bearish trend with accelerating decline and high volatility (std deviation 25.04). Recent weeks show a 3.46% gain, suggesting a mild upward correction.
MicroVision, Inc. (MVIS) declined 51.99% over the same period, confirming a strong bearish trend with decelerating losses and very low volatility (std deviation 0.29). Its recent trend is still negative, with a 17.93% drop and seller dominance.
Comparing both, NOVT’s bearish trend is less severe and recently turning positive, while MVIS shows a deeper and persistent decline, making NOVT the better-performing stock in this timeframe.
Target Prices
Here is the consensus target price overview based on reliable analyst data for selected companies:
| Company | Target High | Target Low | Consensus |
|---|---|---|---|
| Novanta Inc. | 160 | 160 | 160 |
| MicroVision, Inc. | 5 | 5 | 5 |
Analysts expect Novanta Inc. to reach $160, well above its current price of $131.25, indicating potential upside. MicroVision, Inc. shows a consensus target of $5, significantly higher than its current price near $0.96, suggesting strong growth expectations.
Analyst Opinions Comparison
This section compares analysts’ ratings and grades for Novanta Inc. and MicroVision, Inc.:
Rating Comparison
Novanta Inc. Rating
- Rating: C+ indicating a very favorable overall view
- Discounted Cash Flow Score: 3, moderate valuation
- ROE Score: 3, moderate efficiency in profit generation
- ROA Score: 3, moderate asset utilization
- Debt To Equity Score: 1, very unfavorable financial risk
- Overall Score: 2, moderate overall financial standing
MicroVision, Inc. Rating
- Rating: C- indicating a very favorable overall view
- Discounted Cash Flow Score: 1, very unfavorable valuation
- ROE Score: 1, very unfavorable efficiency
- ROA Score: 1, very unfavorable asset utilization
- Debt To Equity Score: 2, moderate financial risk
- Overall Score: 1, very unfavorable overall standing
Which one is the best rated?
Based on the provided data, Novanta Inc. has higher scores in discounted cash flow, ROE, ROA, and overall financial standing, while MicroVision shows a better debt to equity score. Overall, Novanta Inc. is better rated due to stronger profitability and valuation metrics.
Scores Comparison
Here is a comparison of the financial scores for Novanta Inc. and MicroVision, Inc.:
Novanta Inc. Scores
- Altman Z-Score: 5.39, indicating a safe zone with low bankruptcy risk.
- Piotroski Score: 6, reflecting average financial strength.
MicroVision, Inc. Scores
- Altman Z-Score: -6.42, indicating distress zone with high bankruptcy risk.
- Piotroski Score: 1, reflecting very weak financial strength.
Which company has the best scores?
Novanta Inc. shows a strong Altman Z-Score in the safe zone and an average Piotroski Score, while MicroVision is in financial distress with very weak Piotroski results. Novanta’s scores are better based on this data.
Grades Comparison
Here is a comparison of the recent grades assigned to Novanta Inc. and MicroVision, Inc.:
Novanta Inc. Grades
The table below summarizes the recent grades awarded by recognized grading firms to Novanta Inc.:
| Grading Company | Action | New Grade | Date |
|---|---|---|---|
| Baird | Maintain | Neutral | 2025-08-11 |
| Baird | Maintain | Neutral | 2025-03-03 |
| Baird | Maintain | Neutral | 2024-11-06 |
| Baird | Maintain | Neutral | 2024-08-07 |
| Baird | Maintain | Neutral | 2023-05-11 |
| Baird | Maintain | Neutral | 2023-05-10 |
| William Blair | Upgrade | Outperform | 2022-05-11 |
| William Blair | Upgrade | Outperform | 2022-05-10 |
| Berenberg | Maintain | Hold | 2020-11-13 |
| Baird | Maintain | Neutral | 2020-05-13 |
Novanta’s grades have generally remained stable, with a predominant neutral or hold consensus and occasional upgrades in 2022.
MicroVision, Inc. Grades
Below is a summary of recent grades for MicroVision, Inc. from established grading firms:
| Grading Company | Action | New Grade | Date |
|---|---|---|---|
| D. Boral Capital | Maintain | Buy | 2025-12-16 |
| D. Boral Capital | Maintain | Buy | 2025-11-12 |
| WestPark Capital | Maintain | Buy | 2025-10-21 |
| WestPark Capital | Maintain | Buy | 2025-09-05 |
| D. Boral Capital | Maintain | Buy | 2025-09-02 |
| WestPark Capital | Maintain | Buy | 2025-08-27 |
| D. Boral Capital | Maintain | Buy | 2025-08-11 |
| D. Boral Capital | Maintain | Buy | 2025-05-21 |
| D. Boral Capital | Maintain | Buy | 2025-05-13 |
| WestPark Capital | Maintain | Buy | 2025-03-27 |
MicroVision consistently receives buy ratings, reflecting a positive grading trend from multiple firms.
Which company has the best grades?
MicroVision, Inc. has received consistently stronger grades, mainly “Buy,” compared to Novanta Inc.’s more conservative “Neutral” and “Hold” ratings. This divergence may influence investors seeking higher conviction from analyst ratings, potentially impacting portfolio decisions accordingly.
Strengths and Weaknesses
Here is a comparative overview of Novanta Inc. (NOVT) and MicroVision, Inc. (MVIS) based on their diversification, profitability, innovation, global presence, and market share.
| Criterion | Novanta Inc. (NOVT) | MicroVision, Inc. (MVIS) |
|---|---|---|
| Diversification | Highly diversified across Precision Manufacturing, Robotics, Advanced Surgery, and Precision Medicine with revenues over $940M in 2024. | Limited diversification; primary revenue from Product and License streams, total ~$4.9M in 2024. |
| Profitability | Moderate profitability with 6.75% net margin; ROIC at 7.25% but below WACC (10.82%), indicating slight value destruction but improving. | Deeply unprofitable with net margin near -2064%; ROIC at -83.7%, well below WACC (9.53%), showing significant value destruction despite ROIC growth. |
| Innovation | Strong in advanced medical and manufacturing technologies, supporting steady ROIC growth and product evolution. | Innovation potential evident from ROIC growth, but financials reflect early-stage challenges and inefficiencies. |
| Global presence | Established global operations in precision tech and medical markets, supporting revenue stability. | Smaller scale with more limited global footprint and revenue streams concentrated in niche segments. |
| Market Share | Solid presence in multiple precision technology sectors with consistent revenue growth. | Limited market share, with fluctuating and low revenue base in competitive technology licensing and product sales. |
Key takeaways: Novanta demonstrates solid diversification and improving profitability with a growing ROIC trend, though still slightly value destructive. MicroVision faces significant profitability challenges and limited diversification but shows promise with its growing ROIC, suggesting potential for future turnaround. Investors should weigh Novanta’s stability against MicroVision’s higher risk and growth potential.
Risk Analysis
Below is a comparison table outlining key risk factors for Novanta Inc. (NOVT) and MicroVision, Inc. (MVIS) based on the most recent 2024 data.
| Metric | Novanta Inc. (NOVT) | MicroVision, Inc. (MVIS) |
|---|---|---|
| Market Risk | Beta 1.60, moderate volatility | Beta 1.27, moderate volatility |
| Debt level | Debt-to-equity 0.63, neutral risk | Debt-to-equity 1.06, elevated risk |
| Regulatory Risk | Moderate, medical and industrial sectors | Elevated, lidar and automotive safety technology |
| Operational Risk | Moderate, diverse product lines and global sales | High, niche tech with limited scale (185 employees) |
| Environmental Risk | Moderate, industrial manufacturing impacts | Moderate, tech production with less footprint |
| Geopolitical Risk | Low, US headquartered with global presence | Low, US headquartered but supply chain sensitive |
The most significant risks arise for MicroVision due to its high debt level and negative profitability metrics, placing it in financial distress. Novanta shows moderate market and operational risks but maintains a safer financial position with a strong Altman Z-Score (5.39, safe zone). Investors should be cautious with MVIS given its distress zone status and very weak Piotroski score, signaling high financial and operational risk.
Which Stock to Choose?
Novanta Inc. (NOVT) shows a generally favorable income evolution with 60.72% revenue growth over 2020-2024 and a solid gross margin of 44.41%. Its financial ratios suggest a slightly unfavorable profile due to high P/E and P/B ratios and moderate profitability with ROE at 8.59%. Debt levels and liquidity ratios are neutral to favorable. The company’s rating is very favorable (C+), supported by a safe Altman Z-Score of 5.39 and average Piotroski score of 6, although it currently sheds value as ROIC is below WACC.
MicroVision, Inc. (MVIS) presents an unfavorable income statement with negative margins and declining revenue growth recently. Its financial ratios are mostly unfavorable, including a negative ROE of -198.72% and low asset turnover, with moderate debt levels. MVIS holds a very unfavorable rating (C-), is in the distress zone with an Altman Z-Score below 0, and has a very weak Piotroski score of 1. Despite a growing ROIC trend, the company is value-destructive and shows weak profitability and financial stability.
Considering ratings and the overall evaluation of income and financial ratios, Novanta Inc. appears to offer a more stable and financially sound profile. Investors seeking quality and moderate risk might find Novanta more aligned with their goals, while those with a higher risk tolerance and interest in turnaround scenarios could view MicroVision’s potential ROIC improvement as noteworthy, albeit with significant caution.
Disclaimer: Investment carries a risk of loss of initial capital. The past performance is not a reliable indicator of future results. Be sure to understand risks before making an investment decision.
Go Further
I encourage you to read the complete analyses of Novanta Inc. and MicroVision, Inc. to enhance your investment decisions: