Micron Technology, Inc. (MU) and Tower Semiconductor Ltd. (TSEM) are two prominent players in the semiconductor industry, each carving out distinct yet overlapping market niches. While Micron focuses on memory and storage solutions with a broad global reach, Tower specializes in analog and mixed-signal semiconductor manufacturing. Their innovation strategies and market approaches make them compelling subjects for comparison. In this article, I will help you identify which company presents the most attractive investment opportunity in 2026.

Table of contents
Companies Overview
I will begin the comparison between Micron Technology, Inc. and Tower Semiconductor Ltd. by providing an overview of these two companies and their main differences.
Micron Technology, Inc. Overview
Micron Technology, Inc. designs, manufactures, and sells memory and storage products globally. Operating through four main segments, it offers DRAM, NAND, and NOR memory products under brands like Micron and Crucial. The company serves cloud servers, enterprise, client, and mobile markets, as well as automotive and industrial sectors. Founded in 1978, Micron is headquartered in Boise, Idaho, and trades on NASDAQ with a market cap of 373B USD.
Tower Semiconductor Ltd. Overview
Tower Semiconductor Ltd. is an independent semiconductor foundry specializing in analog intensive mixed-signal devices. It offers customizable process technologies such as SiGe, BiCMOS, and RF CMOS, along with wafer fabrication and design enablement services. Serving diverse markets including consumer electronics, automotive, and medical devices, Tower was founded in 1993 and is based in Migdal Haemek, Israel. It trades on NASDAQ with a market cap of 13.8B USD.
Key similarities and differences
Both companies operate in the semiconductor industry and trade on NASDAQ, serving technology markets worldwide. Micron focuses primarily on memory and storage products across multiple sectors, leveraging branded products and direct sales channels. In contrast, Tower functions as a foundry providing manufacturing and process technologies to other semiconductor companies, emphasizing customization and design support. Their business models differ mainly in product specialization and customer approach.
Income Statement Comparison
The following table compares key income statement metrics for Micron Technology, Inc. and Tower Semiconductor Ltd. for their most recent fiscal years.

| Metric | Micron Technology, Inc. (MU) | Tower Semiconductor Ltd. (TSEM) |
|---|---|---|
| Market Cap | 373B | 13.8B |
| Revenue | 37.4B | 1.44B |
| EBITDA | 18.5B | 451M |
| EBIT | 10.1B | 185M |
| Net Income | 8.54B | 208M |
| EPS | 7.65 | 1.87 |
| Fiscal Year | 2025 | 2024 |
Income Statement Interpretations
Micron Technology, Inc.
Micron Technology displayed a strong upward trend in revenue and net income from 2021 to 2025, with revenue rising from $27.7B to $37.4B and net income improving significantly from $5.9B loss in 2023 to $8.5B profit in 2025. Margins improved notably, with a gross margin near 40% and a net margin of 22.8% in 2025, reflecting robust profitability and operational efficiency gains in the latest fiscal year.
Tower Semiconductor Ltd.
Tower Semiconductor experienced modest revenue growth from $1.27B in 2020 to $1.44B in 2024, while net income grew from $82.3M to $208M over the same period. Despite favorable margins above 12% EBIT and 14.5% net margin in 2024, recent year growth slowed, with a slight decline in gross profit and a sharp drop in EBIT and net margin growth, indicating some pressure on operational performance last year.
Which one has the stronger fundamentals?
Micron Technology exhibits stronger fundamentals supported by consistently higher revenue and net income growth, and markedly better margins, with a 100% favorable income statement evaluation. Tower Semiconductor, while showing overall growth, faced recent declines in profitability metrics, reflected in a 57% favorable rating. Micron’s scale, margin expansion, and earnings acceleration position it ahead in financial strength.
Financial Ratios Comparison
This table presents the most recent key financial ratios for Micron Technology, Inc. (MU) and Tower Semiconductor Ltd. (TSEM) for fiscal year 2025 and 2024 respectively, facilitating a direct comparison of their financial performance and stability.
| Ratios | Micron Technology, Inc. (MU) 2025 | Tower Semiconductor Ltd. (TSEM) 2024 |
|---|---|---|
| ROE | 15.8% | 7.8% |
| ROIC | 12.1% | 6.4% |
| P/E | 15.9 | 27.5 |
| P/B | 2.51 | 2.16 |
| Current Ratio | 2.52 | 6.18 |
| Quick Ratio | 1.79 | 5.23 |
| D/E (Debt-to-Equity) | 0.28 | 0.07 |
| Debt-to-Assets | 18.5% | 5.9% |
| Interest Coverage | 20.7 | 32.6 |
| Asset Turnover | 0.45 | 0.47 |
| Fixed Asset Turnover | 0.79 | 1.11 |
| Payout ratio | 6.1% | 0% |
| Dividend yield | 0.38% | 0% |
Interpretation of the Ratios
Micron Technology, Inc.
Micron demonstrates strong profitability with favorable net margin (22.84%), ROE (15.76%), and ROIC (12.12%). Liquidity and leverage ratios are solid, including a current ratio of 2.52 and debt-to-assets at 18.45%. However, asset turnover and fixed asset turnover are weak. Dividend yield is low at 0.38%, indicating modest shareholder returns with potential risks on distribution sustainability.
Tower Semiconductor Ltd.
Tower Semiconductor shows a mixed profile: favorable net margin (14.47%) and interest coverage (31.57), but weak ROE (7.83%) and an unfavorable P/E ratio of 27.54. The current ratio is unusually high at 6.18 but marked unfavorable, suggesting inefficient asset use. The company does not pay dividends, likely prioritizing reinvestment or growth, supported by favorable debt metrics and liquidity.
Which one has the best ratios?
Micron Technology holds a more favorable overall ratio profile, with stronger profitability, liquidity, and leverage metrics despite some weaknesses in asset turnover. Tower Semiconductor’s ratios reflect moderate strength but are hindered by lower returns and valuation concerns. Both companies show areas for improvement, but Micron’s financial ratios suggest a more balanced financial position.
Strategic Positioning
This section compares the strategic positioning of Micron Technology, Inc. and Tower Semiconductor Ltd., including market position, key segments, and exposure to technological disruption:
Micron Technology, Inc.
- Large market cap of $373B with NASDAQ listing; faces competitive pressure in semiconductors.
- Diverse segments: DRAM, NAND, Compute, Mobile, Storage, Embedded driving revenues globally.
- Exposure to memory and storage innovation; no explicit mention of disruption risk in foundry processes.
Tower Semiconductor Ltd.
- Smaller market cap of $13.7B, operates as an independent foundry with less beta volatility.
- Focus on analog mixed-signal devices and wafer fabrication for multiple niche markets.
- Provides customizable semiconductor processes; technological adaptation key in mixed-signal space.
Micron Technology, Inc. vs Tower Semiconductor Ltd. Positioning
Micron shows a diversified approach with multiple product and business units across global markets, offering broad exposure. Tower concentrates on analog mixed-signal foundry services, targeting specialized segments. Micron’s scale suggests wider market influence while Tower focuses on customization and process technology.
Which has the best competitive advantage?
Both companies are shedding value with ROIC below WACC, but Micron’s slightly favorable moat and growing profitability indicate a modest competitive edge, whereas Tower’s slightly unfavorable moat suggests greater challenges despite improving returns.
Stock Comparison
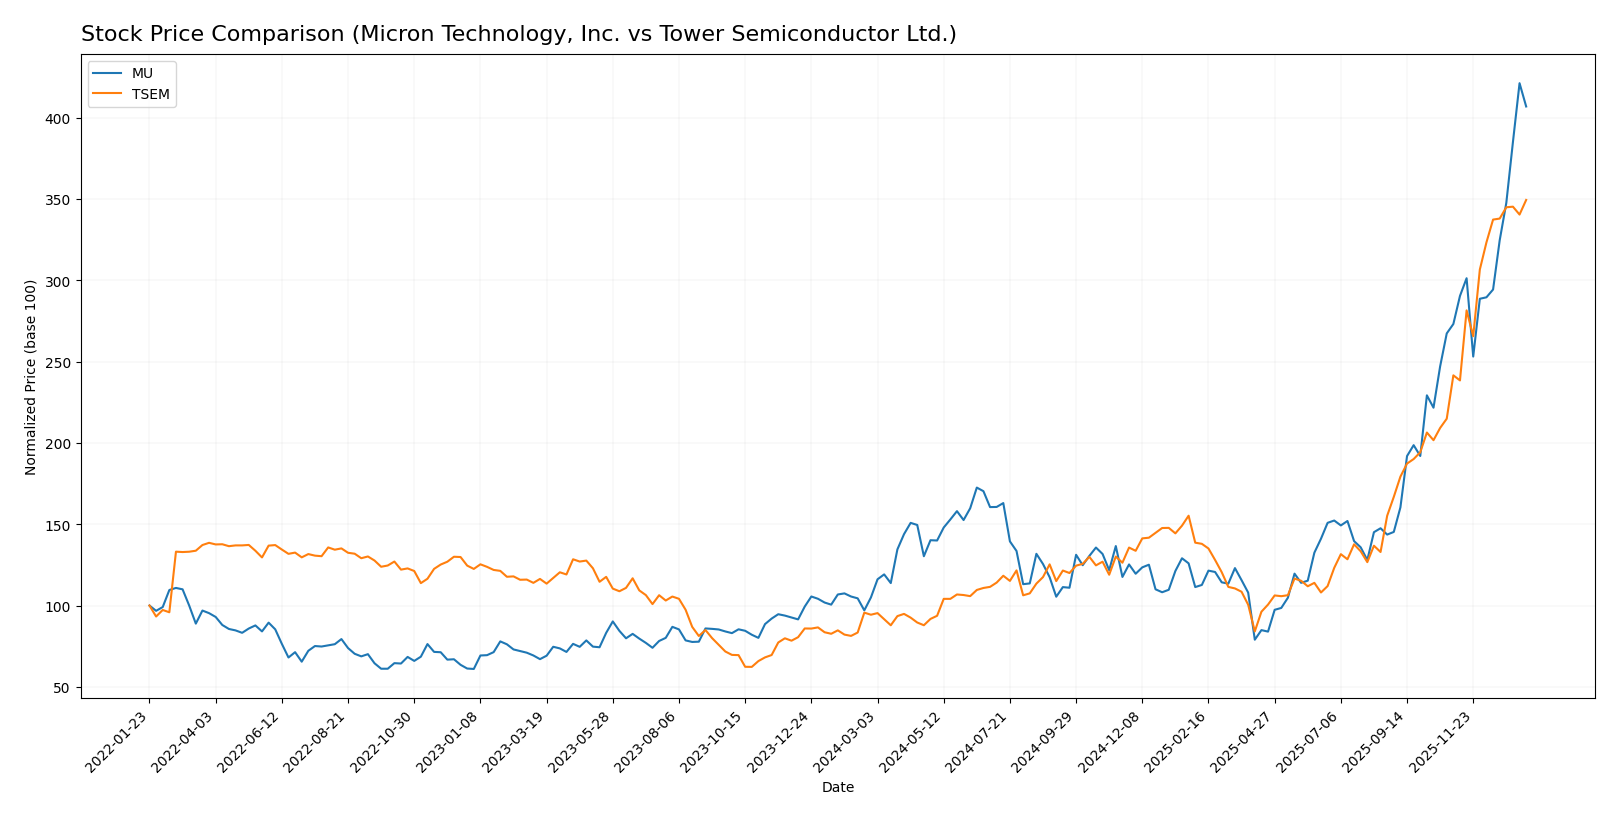
The stock price movements of Micron Technology, Inc. (MU) and Tower Semiconductor Ltd. (TSEM) over the past 12 months reveal strong bullish trends with significant gains and accelerating upward momentum.
Trend Analysis
Micron Technology, Inc. (MU) experienced a 287.62% price increase over the past year, indicating a bullish trend with accelerating momentum. The stock showed a high volatility level with a standard deviation of 57.56, reaching a high of 345.09 and a low of 64.72.
Tower Semiconductor Ltd. (TSEM) posted a 270.3% price increase over the last 12 months, also reflecting a bullish trend with acceleration. Its volatility was lower at a standard deviation of 23.65, with a highest price of 123.2 and a lowest price of 29.65.
Comparing both stocks, MU delivered the highest market performance with a larger percentage gain and greater volatility, while TSEM showed strong but slightly less pronounced growth.
Target Prices
The current analyst consensus presents a balanced outlook with defined target ranges for both companies.
| Company | Target High | Target Low | Consensus |
|---|---|---|---|
| Micron Technology, Inc. | 450 | 190 | 328.22 |
| Tower Semiconductor Ltd. | 125 | 66 | 96 |
Analysts expect Micron Technology’s stock to trade near its consensus target of 328.22, close to the current price of 333.35, indicating limited upside. Tower Semiconductor shows a consensus target of 96, suggesting a potential downside from its current price of 123.2.
Analyst Opinions Comparison
This section compares analysts’ ratings and grades for Micron Technology, Inc. (MU) and Tower Semiconductor Ltd. (TSEM):
Rating Comparison
MU Rating
- Rating: B, classified as Very Favorable.
- Discounted Cash Flow Score: 1, Very Unfavorable.
- ROE Score: 4, Favorable efficiency generating profits.
- ROA Score: 5, Very Favorable asset utilization.
- Debt To Equity Score: 3, Moderate financial risk.
- Overall Score: 3, Moderate summary financial standing.
TSEM Rating
- Rating: B+, classified as Very Favorable.
- Discounted Cash Flow Score: 3, Moderate.
- ROE Score: 3, Moderate efficiency generating profits.
- ROA Score: 4, Favorable asset utilization.
- Debt To Equity Score: 4, Favorable financial risk.
- Overall Score: 3, Moderate summary financial standing.
Which one is the best rated?
Based on the provided data, TSEM holds a slightly better rating at B+ versus MU’s B. TSEM scores higher on discounted cash flow and debt-to-equity, while MU excels in ROE and ROA scores. Overall scores are equal.
Scores Comparison
The scores comparison between Micron Technology (MU) and Tower Semiconductor (TSEM) is as follows:
MU Scores
- Altman Z-Score: 10.5, classified in the safe zone indicating low bankruptcy risk.
- Piotroski Score: 7, indicating strong financial health and investment potential.
TSEM Scores
- Altman Z-Score: 20.3, in the safe zone showing very low bankruptcy risk.
- Piotroski Score: 7, also indicating strong financial health and investment potential.
Which company has the best scores?
Both MU and TSEM are in the safe zone for Altman Z-Score, with TSEM scoring significantly higher. Their Piotroski Scores are equal, both showing strong financial health. TSEM has the edge due to a notably higher Altman Z-Score.
Grades Comparison
The following sections present the latest reliable grades for Micron Technology, Inc. and Tower Semiconductor Ltd.:
Micron Technology, Inc. Grades
This table shows recent grades from reputable grading companies for Micron Technology, Inc.
| Grading Company | Action | New Grade | Date |
|---|---|---|---|
| Keybanc | Maintain | Overweight | 2026-01-13 |
| B of A Securities | Maintain | Buy | 2026-01-13 |
| Lynx Global | Maintain | Buy | 2026-01-12 |
| Mizuho | Maintain | Outperform | 2026-01-09 |
| UBS | Maintain | Buy | 2026-01-07 |
| Piper Sandler | Maintain | Overweight | 2026-01-07 |
| Piper Sandler | Maintain | Overweight | 2025-12-18 |
| Barclays | Maintain | Overweight | 2025-12-18 |
| Keybanc | Maintain | Overweight | 2025-12-18 |
| Wolfe Research | Maintain | Outperform | 2025-12-18 |
Overall, Micron Technology has consistently received positive grades, mostly “Buy,” “Overweight,” or “Outperform,” with no recent downgrades.
Tower Semiconductor Ltd. Grades
Below is the recent grading data from established companies for Tower Semiconductor Ltd.
| Grading Company | Action | New Grade | Date |
|---|---|---|---|
| Benchmark | Maintain | Buy | 2026-01-09 |
| Wedbush | Downgrade | Neutral | 2025-12-31 |
| Benchmark | Maintain | Buy | 2025-11-11 |
| Susquehanna | Maintain | Positive | 2025-11-11 |
| Wedbush | Maintain | Outperform | 2025-11-11 |
| Barclays | Maintain | Equal Weight | 2025-11-11 |
| Benchmark | Maintain | Buy | 2025-09-08 |
| Susquehanna | Maintain | Positive | 2025-08-05 |
| Benchmark | Maintain | Buy | 2025-08-05 |
| Benchmark | Maintain | Buy | 2025-08-04 |
Tower Semiconductor’s grades show mostly positive ratings such as “Buy” and “Outperform,” but there is a notable recent downgrade to “Neutral” by Wedbush.
Which company has the best grades?
Micron Technology has received more consistent “Buy” and “Overweight” grades without downgrades, while Tower Semiconductor shows a recent downgrade and more varied ratings. This difference could influence investor confidence and risk perception in their portfolio decisions.
Strengths and Weaknesses
Below is a comparative table highlighting the key strengths and weaknesses of Micron Technology, Inc. (MU) and Tower Semiconductor Ltd. (TSEM) based on the latest financial and operational data.
| Criterion | Micron Technology, Inc. (MU) | Tower Semiconductor Ltd. (TSEM) |
|---|---|---|
| Diversification | Moderate: Focused on memory products (DRAM, NAND) with some segment variety | Limited: Primarily semiconductor foundry services |
| Profitability | Strong profitability with net margin 22.84% and ROIC 12.12% (favorable) | Moderate profitability with net margin 14.47%, ROIC 6.41% (neutral) |
| Innovation | High R&D intensity in memory tech; growing ROIC indicates ongoing innovation | Growing ROIC trend suggests improving innovation, but overall value destruction |
| Global presence | Extensive global footprint, serving major tech markets worldwide | Global presence but smaller scale compared to MU |
| Market Share | Large share in DRAM and NAND markets | Smaller market share in specialty foundry segment |
Key takeaways: Micron Technology demonstrates stronger profitability and a more diversified product base, supported by a growing ROIC trend, indicating solid innovation and operational efficiency. Tower Semiconductor shows improving profitability and innovation but remains a smaller player with a less diversified portfolio and slightly unfavorable economic moat. Investors should weigh MU’s stronger financial health against TSEM’s growth potential and niche positioning.
Risk Analysis
Below is a comparative table presenting key risk metrics for Micron Technology, Inc. (MU) and Tower Semiconductor Ltd. (TSEM) based on the most recent data available:
| Metric | Micron Technology, Inc. (MU) | Tower Semiconductor Ltd. (TSEM) |
|---|---|---|
| Market Risk | Beta 1.50 (higher volatility) | Beta 0.88 (lower volatility) |
| Debt level | Debt/Equity 0.28 (moderate) | Debt/Equity 0.07 (low) |
| Regulatory Risk | US tech industry regulations | Exposure to multiple regions with diverse regulations |
| Operational Risk | Scale and complexity of global operations; 48K employees | Smaller scale, 5.6K employees; foundry service risks |
| Environmental Risk | Moderate – semiconductor manufacturing impacts | Moderate – analog/mixed-signal fabrication impacts |
| Geopolitical Risk | US-centric, some global exposure | Headquarters in Israel; exposure to Middle East tensions |
Micron faces higher market volatility and moderate leverage but benefits from strong financial health and scale. Tower Semiconductor has lower leverage and market risk but is more exposed to geopolitical tensions given its Israeli base. Regulatory and operational risks remain relevant for both due to the semiconductor industry’s complexity and global supply chain dependencies.
Which Stock to Choose?
Micron Technology, Inc. (MU) has shown strong income growth with a 48.85% revenue increase in the last year and favorable profitability metrics, including a 22.84% net margin and a 15.76% ROE. Its debt levels remain low at a 0.28 debt-to-equity ratio, supported by a solid current ratio of 2.52. The overall financial ratios are favorable, though its WACC is slightly unfavorable, and it holds a very favorable credit rating of B.
Tower Semiconductor Ltd. (TSEM) presents a mixed income picture with only 0.94% revenue growth last year and a 14.47% net margin. While its debt-to-equity ratio is very low at 0.07 and it maintains a very favorable rating of B+, its return on equity at 7.83% is less favorable. The broader ratio evaluation is slightly favorable, with good liquidity but some unfavorable valuation metrics.
Considering ratings and the comprehensive evaluation of income statements and financial ratios, MU might appeal to investors seeking growth and profitability enhancement, given its higher returns and robust recent earnings momentum. Conversely, TSEM could be seen as more suitable for those prioritizing financial stability and lower leverage, despite slower recent income growth and mixed return metrics.
Disclaimer: Investment carries a risk of loss of initial capital. The past performance is not a reliable indicator of future results. Be sure to understand risks before making an investment decision.
Go Further
I encourage you to read the complete analyses of Micron Technology, Inc. and Tower Semiconductor Ltd. to enhance your investment decisions: