Home > Comparison > Technology > MU vs TXN
The strategic rivalry between Micron Technology, Inc. and Texas Instruments Incorporated defines the current trajectory of the semiconductor sector. Micron operates as a capital-intensive memory and storage manufacturer, while Texas Instruments focuses on high-margin analog and embedded processing solutions. This head-to-head pits memory innovation against diversified semiconductor applications. My analysis will reveal which company’s operational model offers superior risk-adjusted returns for a diversified portfolio in 2026.
Table of contents
Companies Overview
Micron Technology and Texas Instruments both command substantial influence in the semiconductor industry, shaping critical technology trends worldwide.
Micron Technology, Inc.: Memory and Storage Innovator
Micron Technology dominates the memory and storage segment with dynamic random access memory (DRAM) and NAND flash products. Its revenue stems from supplying cloud, enterprise, mobile, and automotive markets with high-speed, non-volatile memory technologies. In 2026, Micron focuses on expanding its embedded and compute networking units to capitalize on data center growth and mobile demand.
Texas Instruments Incorporated: Analog and Embedded Processing Leader
Texas Instruments excels in analog and embedded processing semiconductors, generating revenue through power management and signal processing chips. Its strategic emphasis in 2026 lies in strengthening industrial and automotive footholds by enhancing microcontrollers and digital signal processors. TI also advances its embedded systems to meet evolving electronics and communication equipment needs.
Strategic Collision: Similarities & Divergences
Micron’s business centers on memory-centric solutions, while Texas Instruments pursues a broad analog and embedded chip portfolio. Both compete intensely in automotive and industrial markets, yet Micron targets high-speed storage innovation, whereas TI prioritizes power efficiency and signal integrity. Their distinct product moats define contrasting investment profiles—Micron’s growth hinges on data explosion, TI’s on diversified industrial resilience.
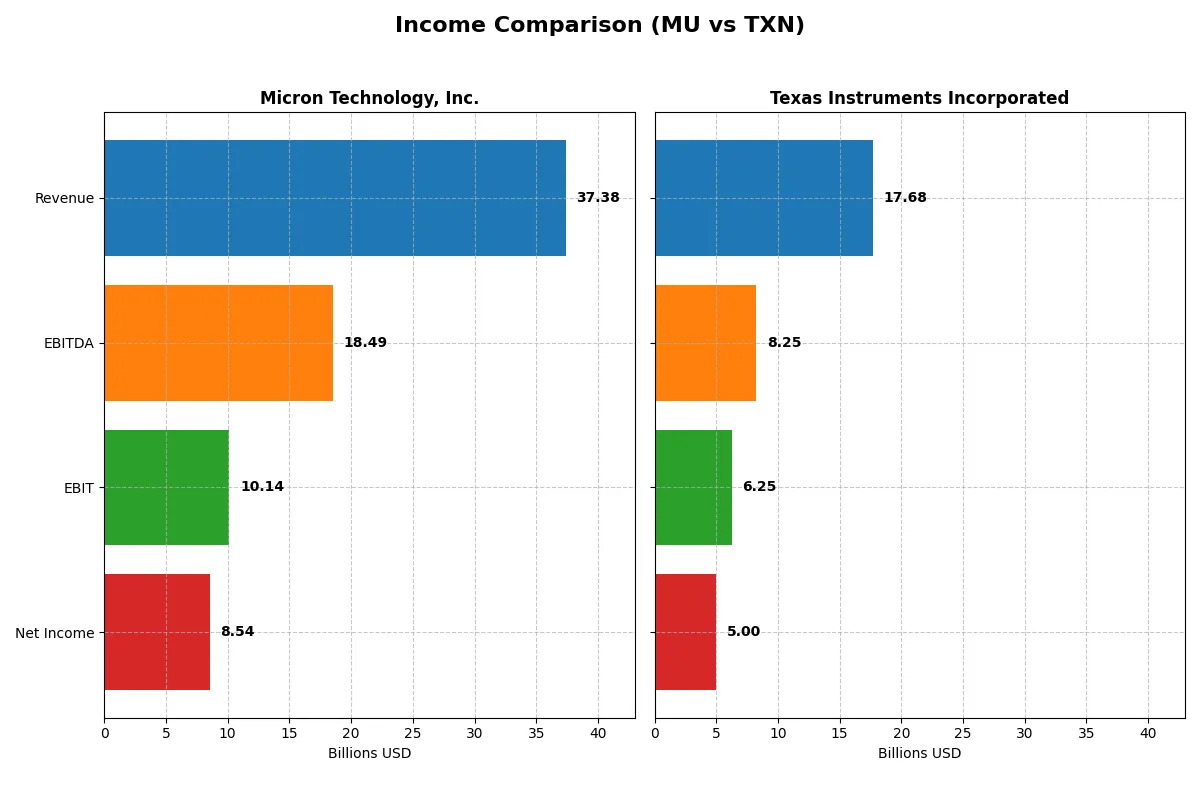
Income Statement Comparison
This data dissects the core profitability and scalability of both corporate engines to reveal who dominates the bottom line:
| Metric | Micron Technology, Inc. (MU) | Texas Instruments Incorporated (TXN) |
|---|---|---|
| Revenue | 37.4B | 17.7B |
| Cost of Revenue | 22.5B | 7.6B |
| Operating Expenses | 5.0B | 4.1B |
| Gross Profit | 14.9B | 10.1B |
| EBITDA | 18.5B | 8.3B |
| EBIT | 10.1B | 6.3B |
| Interest Expense | 477M | 543M |
| Net Income | 8.5B | 5.0B |
| EPS | 7.65 | 5.45 |
| Fiscal Year | 2025 | 2025 |
Income Statement Analysis: The Bottom-Line Duel
This income statement comparison uncovers which company runs a more efficient and profitable corporate engine over recent years.
Micron Technology, Inc. Analysis
Micron’s revenue surged from $15.5B in 2023 to $37.4B in 2025, with net income reversing from a $5.8B loss to $8.5B profit. Its gross margin rose sharply to 39.8%, and net margin reached 22.8%, signaling robust margin recovery and operational efficiency. The explosive one-year EBIT and net income growth reflect strong momentum and capital allocation.
Texas Instruments Incorporated Analysis
Texas Instruments generated steady revenue near $17.7B in 2025, growing 13% year-over-year but declining over five years. Gross margin remains a healthy 57%, with net margin at 28.3%. However, net income dropped 36% over five years, and net margin declined, showing margin pressure despite solid revenue. EBIT growth slowed, indicating less operational momentum compared to peers.
Margin Recovery vs. Sustained Profitability
Micron outpaces Texas Instruments in revenue and net income growth, showcasing impressive margin recovery and capital efficiency. Texas Instruments maintains higher gross and net margins but faces declining profitability and stagnant revenue trends. For investors, Micron’s dynamic growth profile contrasts with Texas Instruments’ steady but challenged margin resilience.
Financial Ratios Comparison
These vital ratios act as a diagnostic tool to expose the underlying fiscal health, valuation premiums, and capital efficiency of the companies compared below:
| Ratios | Micron Technology, Inc. (MU) | Texas Instruments Incorporated (TXN) |
|---|---|---|
| ROE | 15.8% | 30.7% |
| ROIC | 12.1% | 16.5% |
| P/E | 15.9 | 31.5 |
| P/B | 2.51 | 9.69 |
| Current Ratio | 2.52 | 4.35 |
| Quick Ratio | 1.79 | 2.83 |
| D/E | 0.28 | 0.86 |
| Debt-to-Assets | 18.5% | 40.6% |
| Interest Coverage | 20.7 | 11.1 |
| Asset Turnover | 0.45 | 0.51 |
| Fixed Asset Turnover | 0.79 | 1.44 |
| Payout Ratio | 6.1% | 99.96% |
| Dividend Yield | 0.38% | 3.17% |
| Fiscal Year | 2025 | 2025 |
Efficiency & Valuation Duel: The Vital Signs
Ratios act as a company’s DNA, unveiling hidden risks and operational strengths that shape long-term investor outcomes.
Micron Technology, Inc.
Micron delivers solid profitability with a 15.76% ROE and a healthy 22.84% net margin. Its valuation remains reasonable, with a P/E of 15.94 and a neutral P/B of 2.51. Despite a low 0.38% dividend yield, Micron supports shareholder value through reinvestment in R&D, fueling future growth amid cautious capital returns.
Texas Instruments Incorporated
Texas Instruments commands superior profitability, boasting a 30.73% ROE and a 28.28% net margin. However, its valuation appears stretched, with a P/E ratio of 31.53 and a steep P/B of 9.69. The company balances this with a generous 3.17% dividend yield, offering steady income alongside moderate reinvestment in innovation.
Premium Valuation vs. Operational Safety
Texas Instruments offers higher returns but at a premium valuation with more stretched multiples. Micron trades cheaper, balancing operational efficiency with disciplined reinvestment. Investors prioritizing growth at a fair price may lean toward Micron, while those seeking income and robust profitability might prefer Texas Instruments.
Which one offers the Superior Shareholder Reward?
I observe Texas Instruments (TXN) delivers superior shareholder rewards compared to Micron Technology (MU). TXN boasts a robust 3.17% dividend yield and a near 100% payout ratio, signaling strong cash return to shareholders. Its free cash flow comfortably covers dividends, enhancing sustainability. TXN’s sizeable buybacks further amplify total returns. Conversely, MU’s yield is a scant 0.38%, with a modest 6% payout ratio, reflecting a cautious distribution approach. MU channels more cash into growth and capital expenditure, but its free cash flow coverage is tight at 1.07x, raising sustainability concerns. TXN’s aggressive yet well-covered dividends and consistent buybacks provide a more attractive total return profile in 2026.
Comparative Score Analysis: The Strategic Profile
The radar chart reveals the fundamental DNA and trade-offs of Micron Technology, Inc. and Texas Instruments Incorporated:
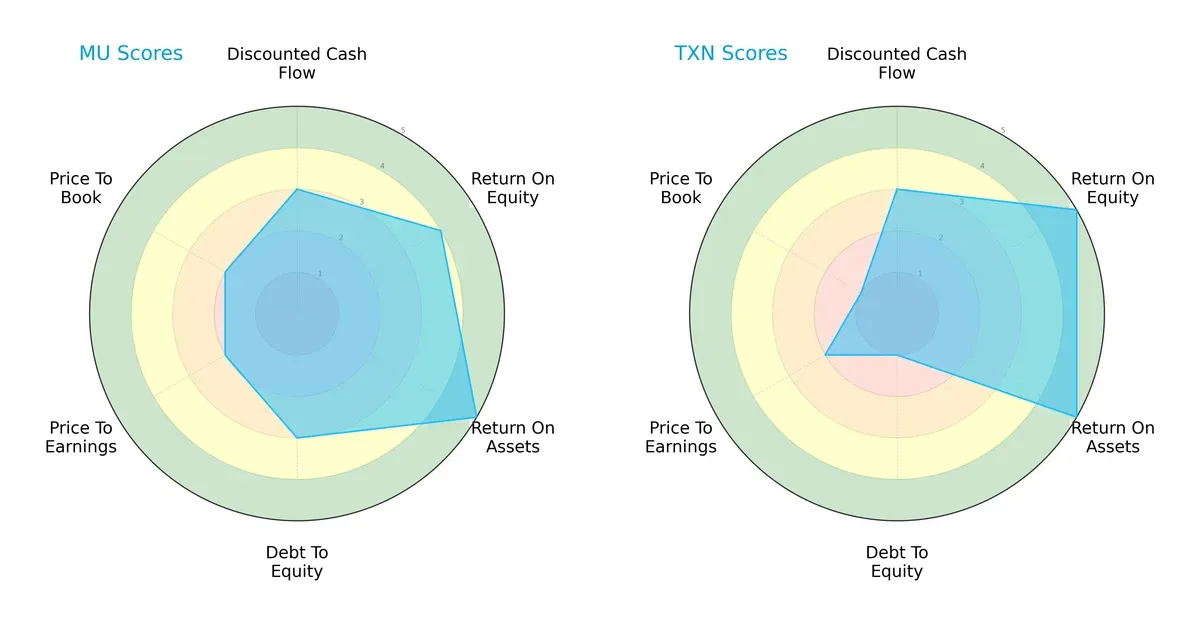
Micron shows strength in ROA (5) and ROE (4), reflecting efficient asset and equity use. Texas Instruments leads in ROE (5) but suffers from a weak debt-to-equity score (1), signaling higher leverage risk. Both share moderate DCF (3) and P/E (2) scores. Micron offers a more balanced profile; Texas Instruments relies heavily on profitability but carries financial risk.
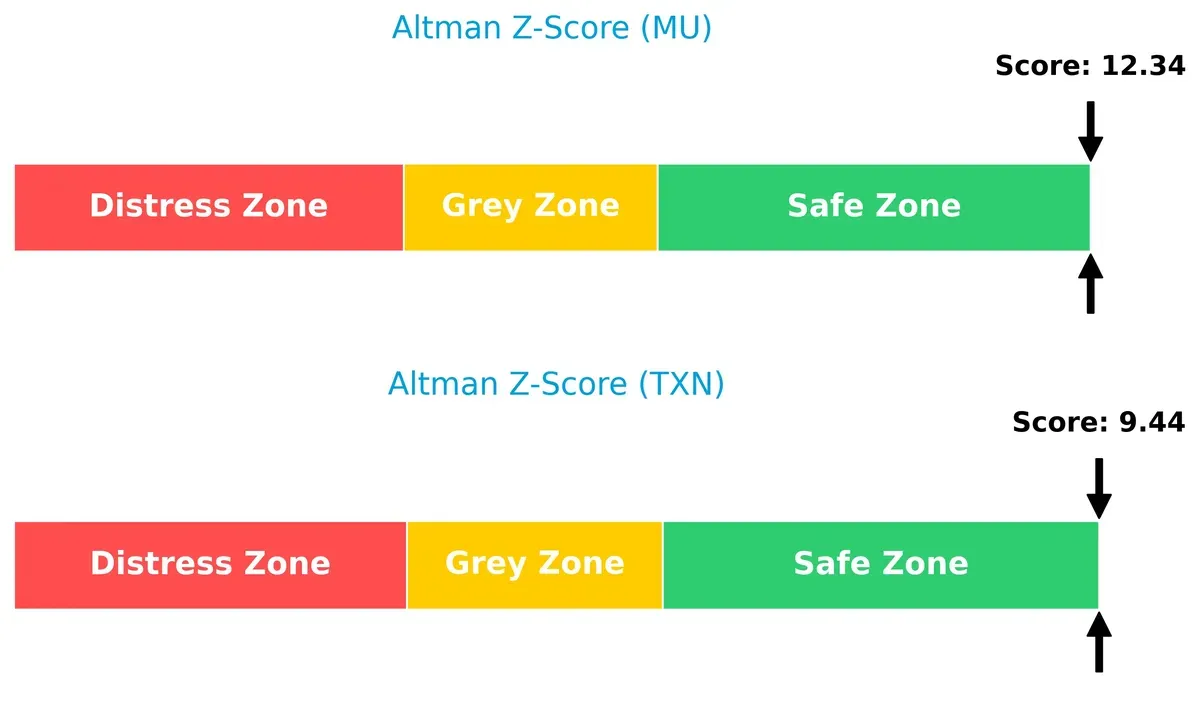
Bankruptcy Risk: Solvency Showdown
Micron’s Altman Z-Score of 12.3 surpasses Texas Instruments’ 9.4, both secure but indicating Micron’s stronger buffer against bankruptcy in volatile markets:
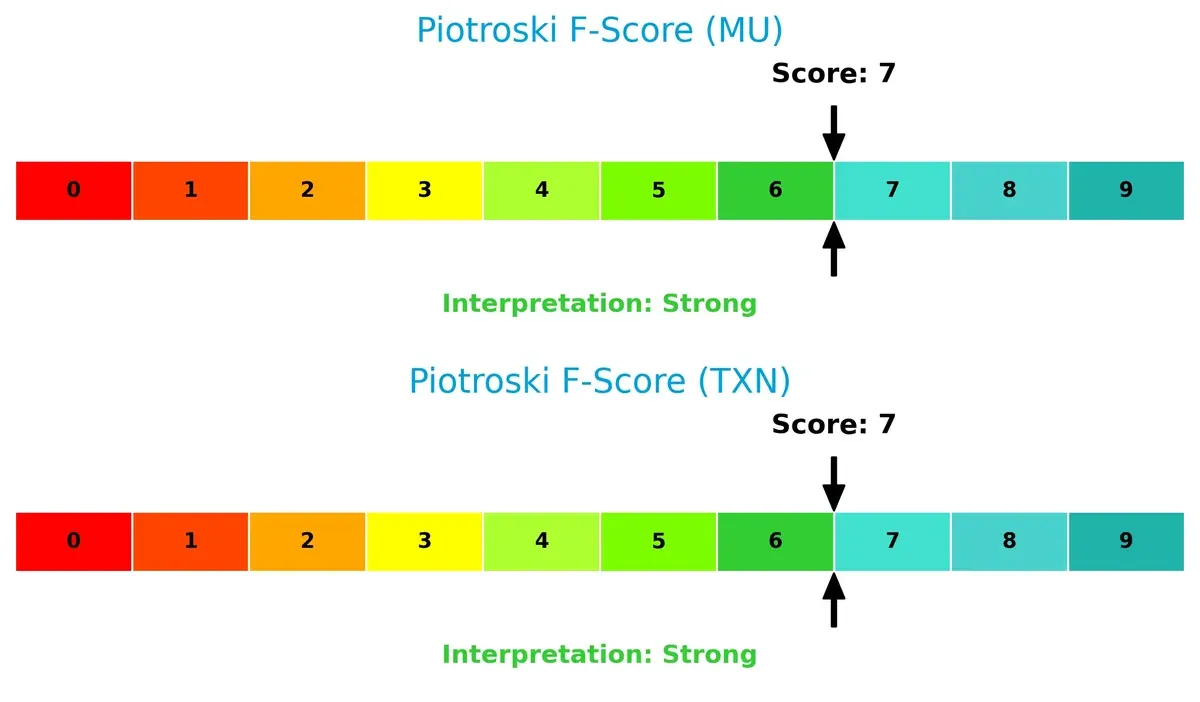
Financial Health: Quality of Operations
Both companies post a Piotroski F-Score of 7, signaling strong financial health with no glaring red flags in internal operations:
How are the two companies positioned?
This section dissects the operational DNA of MU and TXN by comparing their revenue distribution and internal dynamics. The goal: confront their economic moats to identify which model offers the most resilient competitive advantage today.
Revenue Segmentation: The Strategic Mix
This visual comparison dissects how Micron Technology, Inc. and Texas Instruments Incorporated diversify their income streams and where their primary sector bets lie:
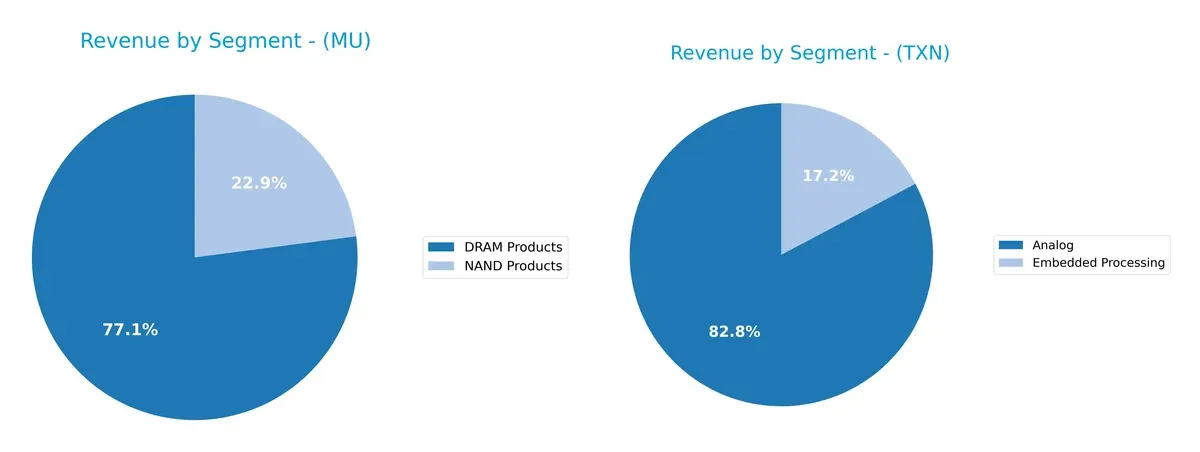
Micron’s revenue pivots heavily on DRAM Products at $28.6B and NAND Products at $8.5B, showing concentration risk in memory chips. Texas Instruments dominates with $12.2B in Analog and $2.5B in Embedded Processing, reflecting a more balanced portfolio. TI’s broader mix mitigates volatility, while Micron’s focus anchors its dominance in memory, exposing it to cyclical tech swings and pricing pressures.
Strengths and Weaknesses Comparison
This table compares the Strengths and Weaknesses of Micron Technology, Inc. (MU) and Texas Instruments Incorporated (TXN):
MU Strengths
- Strong net margin at 22.84%
- Favorable ROE at 15.76%
- Solid current and quick ratios indicate liquidity
- Low debt-to-equity and strong interest coverage
- Large US revenue base at 24.1B
- Diversified product segments including DRAM and NAND
TXN Strengths
- Higher net margin at 28.28%
- Superior ROE at 30.73%
- Favorable ROIC above WACC at 16.52%
- Strong quick ratio and interest coverage
- Higher dividend yield at 3.17%
- Broad geographic presence including Asia and EMEA
MU Weaknesses
- ROIC below WACC at 12.12% signals capital inefficiency
- High WACC at 22.1% adds cost pressure
- Asset turnover ratios unfavorable
- Low dividend yield at 0.38%
- Concentrated revenue with heavy US reliance
TXN Weaknesses
- Elevated PE and PB ratios suggest premium valuation
- Current ratio unfavorable at 4.35, possibly inefficient asset use
- Moderate debt level with neutral debt-to-assets ratio
- Asset turnover and fixed asset turnover only neutral
Both companies show solid profitability and liquidity with slightly favorable financial ratios. MU’s capital efficiency and diversification lag TXN’s stronger returns and global reach. Each faces valuation or operational efficiency challenges, critical for their strategic positioning.
The Moat Duel: Analyzing Competitive Defensibility
A structural moat shields a company’s long-term profits from competitive erosion. Without it, market share and margins inevitably decline:
Micron Technology, Inc.: Cost Advantage and Scale Dominance
Micron leverages cost advantages in memory chip manufacturing, reflected in improving margins and soaring revenue growth. Yet, its ROIC lags WACC, signaling value destruction despite rising profitability. Expansion into automotive and cloud memory could deepen this moat if efficiency gains continue in 2026.
Texas Instruments Incorporated: Intangible Assets and Analog Ecosystem
Texas Instruments’ moat rests on proprietary analog and embedded processing technology, driving superior margins and consistent value creation (ROIC above WACC). However, its declining ROIC trend and shrinking net margin reveal emerging challenges. New market demands in industrial and automotive electronics offer growth but require strategic reinvestment.
Verdict: Cost Leadership vs. Intellectual Property Moats
Micron’s growing profitability contrasts with a negative ROIC spread, unlike Texas Instruments’ positive but declining capital returns. TI’s intangible asset moat is wider, offering steadier value creation. I believe Texas Instruments is better positioned to defend market share amid evolving semiconductor demands.
Which stock offers better returns?
Over the past 12 months, Micron Technology, Inc. and Texas Instruments Incorporated showed strong bullish trends with notable price gains and accelerating momentum in their stock prices.
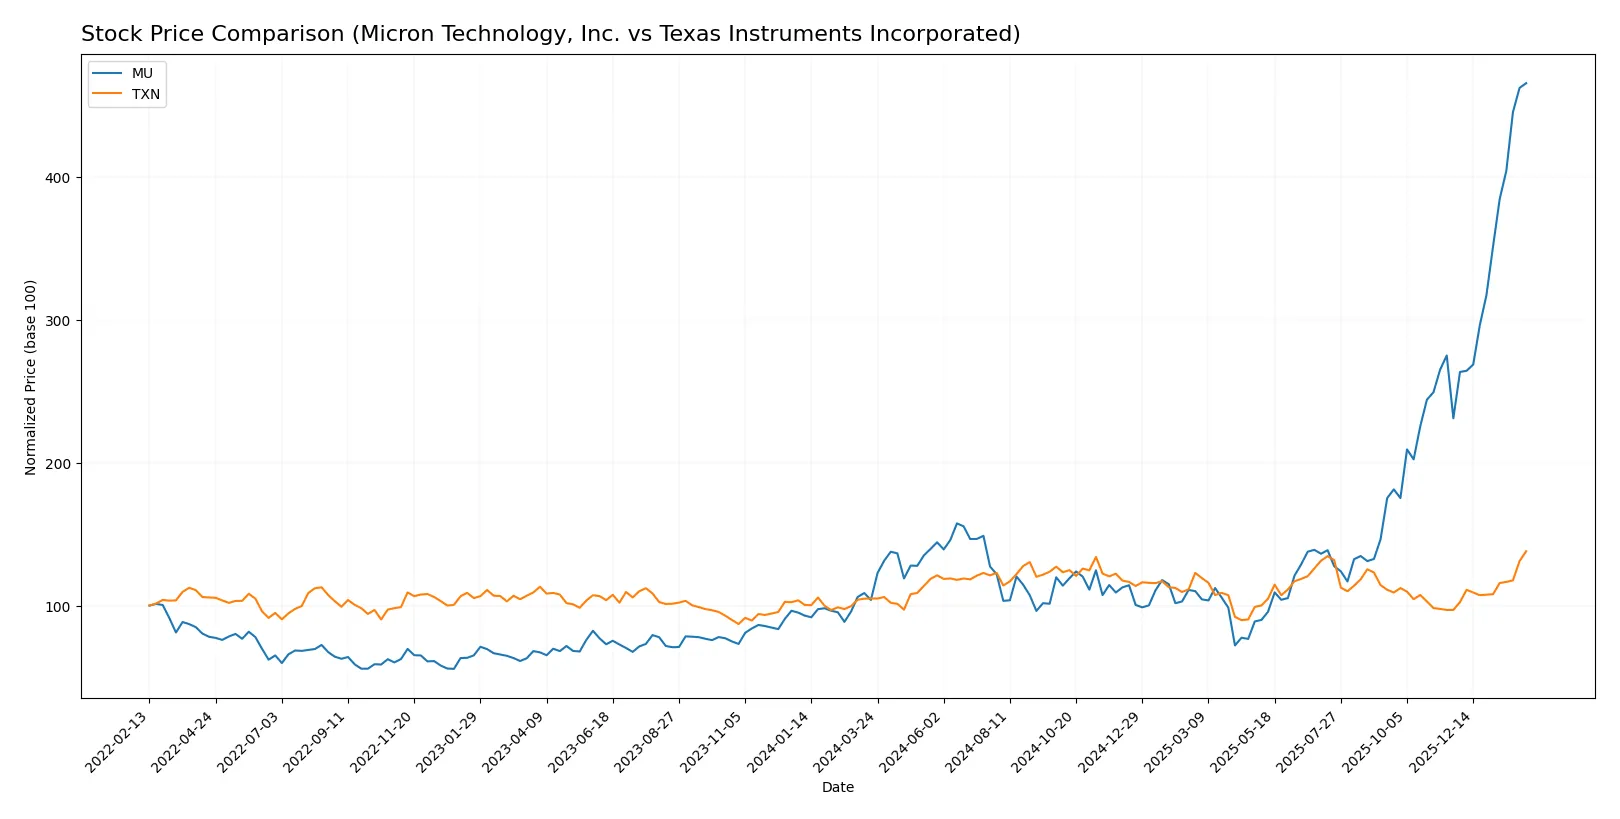
Trend Comparison
Micron Technology’s stock surged 348.11% over the past year, showing clear acceleration and a high volatility level with prices ranging from 64.72 to 417.86.
Texas Instruments rose 31.5% in the same period, also accelerating but with much lower volatility and a price range between 147.6 and 226.87.
Micron Technology delivered a significantly higher market return than Texas Instruments, outperforming by over 300 percentage points in total price appreciation.
Target Prices
Analysts show a mixed but cautiously optimistic outlook for key semiconductor players.
| Company | Target Low | Target High | Consensus |
|---|---|---|---|
| Micron Technology, Inc. | 190 | 480 | 345.61 |
| Texas Instruments Incorporated | 160 | 260 | 204.64 |
Micron’s consensus target at 346 falls below its current 416 price, signaling possible downside risk. Texas Instruments trades above consensus at 227 versus a 205 target, hinting at limited near-term upside.

Don’t Let Luck Decide Your Entry Point
Optimize your entry points with our advanced ProRealTime indicators. You’ll get efficient buy signals with precise price targets for maximum performance. Start outperforming now!
How do institutions grade them?
Micron Technology, Inc. Grades
The following table summarizes recent institutional grades for Micron Technology, Inc.:
| Grading Company | Action | New Grade | Date |
|---|---|---|---|
| Mizuho | Maintain | Outperform | 2026-01-27 |
| Stifel | Maintain | Buy | 2026-01-20 |
| Rosenblatt | Maintain | Buy | 2026-01-20 |
| TD Cowen | Maintain | Buy | 2026-01-20 |
| Citigroup | Maintain | Buy | 2026-01-15 |
| Wells Fargo | Maintain | Overweight | 2026-01-15 |
| Cantor Fitzgerald | Maintain | Overweight | 2026-01-14 |
| Keybanc | Maintain | Overweight | 2026-01-13 |
| B of A Securities | Maintain | Buy | 2026-01-13 |
| Lynx Global | Maintain | Buy | 2026-01-12 |
Texas Instruments Incorporated Grades
The following table summarizes recent institutional grades for Texas Instruments Incorporated:
| Grading Company | Action | New Grade | Date |
|---|---|---|---|
| Keybanc | Maintain | Overweight | 2026-01-28 |
| Deutsche Bank | Maintain | Hold | 2026-01-28 |
| Truist Securities | Maintain | Hold | 2026-01-28 |
| Cantor Fitzgerald | Maintain | Neutral | 2026-01-28 |
| Mizuho | Maintain | Underperform | 2026-01-28 |
| Stifel | Maintain | Hold | 2026-01-28 |
| UBS | Maintain | Buy | 2026-01-28 |
| Goldman Sachs | Maintain | Sell | 2026-01-28 |
| JP Morgan | Maintain | Overweight | 2026-01-28 |
| Jefferies | Maintain | Hold | 2026-01-28 |
Which company has the best grades?
Micron Technology holds consistently positive grades, mostly Buy or Outperform, indicating broad institutional confidence. Texas Instruments shows mixed ratings, including Hold and Underperform, signaling varied investor sentiment. This spread suggests different risk-return profiles for investors to consider.
Risks specific to each company
The following categories identify the critical pressure points and systemic threats facing both firms in the 2026 market environment:
1. Market & Competition
Micron Technology, Inc.
- Faces intense competition in memory and storage sectors, with cyclical demand volatility.
Texas Instruments Incorporated
- Competes in analog and embedded processing with more diversified product lines and stable end markets.
2. Capital Structure & Debt
Micron Technology, Inc.
- Maintains low debt-to-equity (0.28) and strong interest coverage (21.26), indicating conservative leverage.
Texas Instruments Incorporated
- Higher debt-to-equity (0.86) and moderate interest coverage (11.52) reflect a riskier capital structure.
3. Stock Volatility
Micron Technology, Inc.
- Higher beta (1.505) signals more volatile stock price, typical of semiconductor memory firms.
Texas Instruments Incorporated
- Beta near 1 (0.995) suggests more stable stock movements, reflecting diversified product exposure.
4. Regulatory & Legal
Micron Technology, Inc.
- Subject to global export restrictions on memory tech, increasing compliance complexity.
Texas Instruments Incorporated
- Faces regulatory scrutiny related to analog components, generally lower risk than memory sector.
5. Supply Chain & Operations
Micron Technology, Inc.
- Memory chip production is capital-intensive and sensitive to supply chain disruptions.
Texas Instruments Incorporated
- Analog and embedded segments benefit from diversified suppliers, reducing operational risks.
6. ESG & Climate Transition
Micron Technology, Inc.
- Energy-intensive manufacturing poses challenges for carbon footprint reduction.
Texas Instruments Incorporated
- Advances in power-efficient analog chips align well with climate transition trends.
7. Geopolitical Exposure
Micron Technology, Inc.
- High exposure to US-China tensions affecting memory chip exports.
Texas Instruments Incorporated
- Some geopolitical risk, but less concentrated than Micron due to product and market diversity.
Which company shows a better risk-adjusted profile?
Micron’s primary risk lies in market cyclicality and geopolitical tensions, while Texas Instruments faces higher leverage and valuation risks. Despite Micron’s stock volatility, its conservative debt profile and operational challenges suggest a balanced risk. Texas Instruments’ elevated debt and stretched valuation raise caution, despite strong profitability and diversified markets. I see Micron offering a better risk-adjusted profile due to lower financial leverage and a safer balance sheet under current conditions.
Final Verdict: Which stock to choose?
Micron Technology, Inc. (MU) stands out as a dynamic growth engine with remarkable earnings momentum and improving profitability. Its superpower lies in rapid expansion and operational leverage. Investors should watch its capital efficiency closely, as ROIC lags behind WACC. MU fits an aggressive growth portfolio willing to tolerate some volatility for outsized gains.
Texas Instruments Incorporated (TXN) commands a strategic moat through its consistent value creation and industry-leading returns on capital. The company offers a safer, more stable profile with robust margins and steady cash flow. TXN suits investors seeking Growth at a Reasonable Price (GARP) with a preference for income and capital preservation.
If you prioritize high-growth potential and can stomach short-term operational inefficiencies, Micron Technology might be the compelling choice due to its accelerating profitability and market traction. However, if you seek better stability and durable value creation, Texas Instruments offers a more conservative yet quality investment with a well-established competitive advantage.
Disclaimer: Investment carries a risk of loss of initial capital. The past performance is not a reliable indicator of future results. Be sure to understand risks before making an investment decision.
Go Further
I encourage you to read the complete analyses of Micron Technology, Inc. and Texas Instruments Incorporated to enhance your investment decisions: