Home > Comparison > Technology > MU vs TER
The strategic rivalry between Micron Technology, Inc. and Teradyne, Inc. shapes the semiconductor industry’s evolution. Micron, a capital-intensive memory and storage manufacturer, contrasts with Teradyne’s high-tech automated test equipment and industrial robotics model. This head-to-head reflects a battle between manufacturing scale and innovation-driven automation. This analysis aims to identify which trajectory offers superior risk-adjusted returns for a diversified portfolio in the dynamic technology sector.
Table of contents
Companies Overview
Micron Technology and Teradyne both hold key positions in the semiconductor industry, shaping global tech infrastructure.
Micron Technology, Inc.: Memory and Storage Powerhouse
Micron Technology dominates as a leading designer and manufacturer of memory and storage products. Its revenue hinges on DRAM, NAND, and NOR memory sales across cloud, enterprise, mobile, and industrial markets. In 2026, Micron focuses on expanding low-latency, high-speed memory solutions to capture demand in data centers and automotive applications.
Teradyne, Inc.: Automation and Test Equipment Specialist
Teradyne leads in automatic test equipment and industrial automation. It generates revenue from semiconductor test systems, industrial robots, and wireless test solutions, serving fabs and fabless companies. The 2026 strategy emphasizes scaling collaborative robotics and advancing comprehensive semiconductor and wireless device testing platforms.
Strategic Collision: Similarities & Divergences
Micron and Teradyne diverge in their core philosophies: Micron centers on memory product innovation, while Teradyne prioritizes automated testing infrastructure. Both battle for influence over semiconductor supply chains but from different angles—Micron in component production, Teradyne in quality assurance and automation. Their investment profiles contrast: Micron offers exposure to memory tech cycles; Teradyne provides a play on semiconductor manufacturing efficiency.
Income Statement Comparison
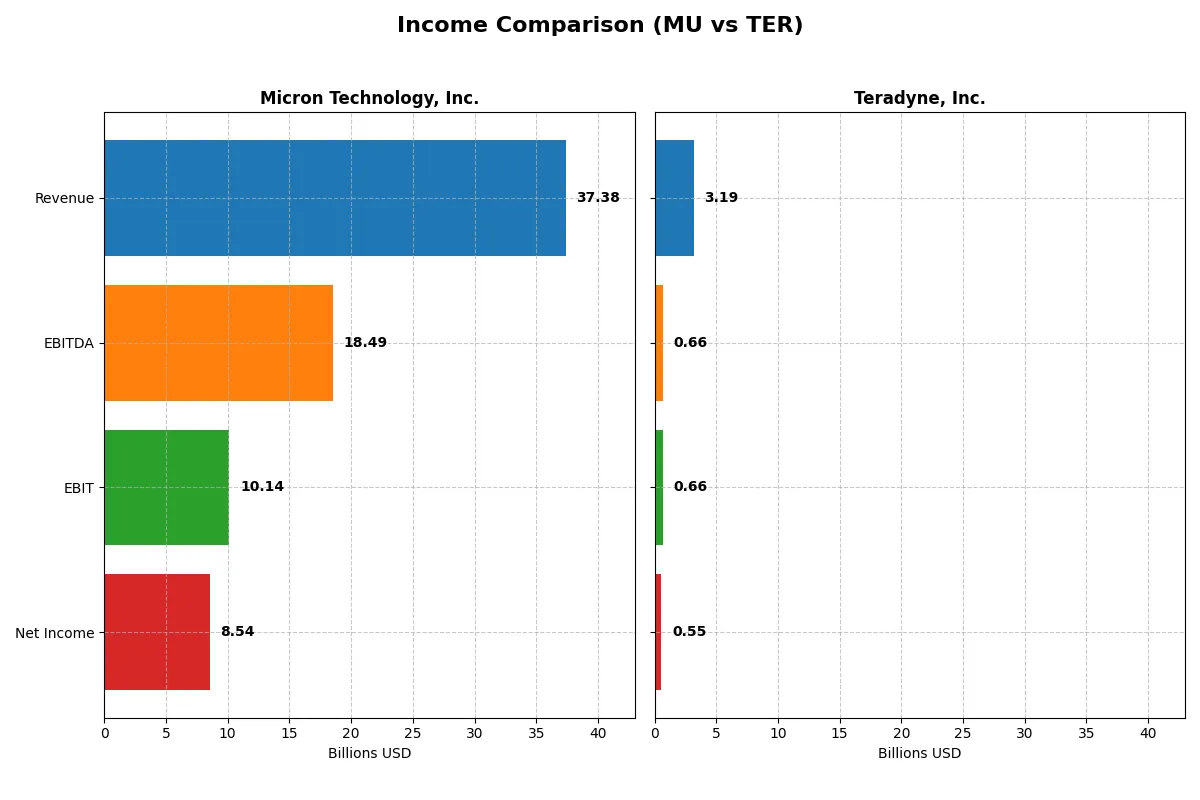
This data dissects the core profitability and scalability of both corporate engines to reveal who dominates the bottom line:
| Metric | Micron Technology, Inc. (MU) | Teradyne, Inc. (TER) |
|---|---|---|
| Revenue | 37.4B | 3.19B |
| Cost of Revenue | 22.5B | 1.33B |
| Operating Expenses | 5.0B | 1.21B |
| Gross Profit | 14.9B | 1.86B |
| EBITDA | 18.5B | 656M |
| EBIT | 10.1B | 656M |
| Interest Expense | 477M | 8.0M |
| Net Income | 8.54B | 554M |
| EPS | 7.65 | 3.49 |
| Fiscal Year | 2025 | 2025 |
Income Statement Analysis: The Bottom-Line Duel
This income statement comparison reveals which company runs a more efficient and profitable corporate engine over recent years.
Micron Technology, Inc. Analysis
Micron’s revenue surged from $15.5B in 2023 to $37.4B in 2025, lifting net income from a $5.8B loss to $8.5B profit. Its gross margin improved to 39.8%, reflecting better cost control. The net margin reached 22.8% in 2025, signaling strong profitability and operational momentum after a historic trough in 2023.
Teradyne, Inc. Analysis
Teradyne’s revenue grew steadily from $2.7B in 2023 to $3.2B in 2025, with net income rising from $449M to $554M. The company maintains a high gross margin of 58.2% but shows a net margin of 17.4%, lower than Micron’s. Recent margin contraction and slower net income growth suggest modest efficiency gains amid steady top-line expansion.
Verdict: High-Growth Scale vs. Stable Margin Strength
Micron delivers stronger revenue and net income growth, with a robust margin rebound. Teradyne holds superior gross margins but lags in net income expansion and margin improvement. Micron’s profile suits investors seeking dynamic earnings momentum, while Teradyne appeals to those prioritizing steady, margin-focused performance.
Financial Ratios Comparison
These vital ratios act as a diagnostic tool to expose the underlying fiscal health, valuation premiums, and capital efficiency of each company:
| Ratios | Micron Technology, Inc. (MU) | Teradyne, Inc. (TER) |
|---|---|---|
| ROE | 15.8% (2025) | 19.2% (2024) |
| ROIC | 12.1% (2025) | 17.2% (2024) |
| P/E | 15.9 (2025) | 36.9 (2024) |
| P/B | 2.51 (2025) | 7.11 (2024) |
| Current Ratio | 2.52 (2025) | 2.91 (2024) |
| Quick Ratio | 1.79 (2025) | 1.84 (2024) |
| D/E | 0.28 (2025) | 0.03 (2024) |
| Debt-to-Assets | 18.5% (2025) | 2.1% (2024) |
| Interest Coverage | 20.7 (2025) | 165.5 (2024) |
| Asset Turnover | 0.45 (2025) | 0.76 (2024) |
| Fixed Asset Turnover | 0.79 (2025) | 4.88 (2024) |
| Payout ratio | 6.1% (2025) | 14.1% (2024) |
| Dividend yield | 0.38% (2025) | 0.38% (2024) |
| Fiscal Year | 2025 | 2024 |
Efficiency & Valuation Duel: The Vital Signs
Financial ratios act as a company’s DNA, exposing hidden risks and operational strengths crucial for investors’ decisions.
Micron Technology, Inc.
Micron’s ROE at 15.76% signals solid profitability, while net margin at 22.84% confirms efficient operations. The P/E ratio of 15.94 suggests the stock trades at a reasonable valuation. Despite a low dividend yield of 0.38%, Micron reinvests heavily in R&D, fostering growth but presenting some risk given its unfavorable ROIC versus WACC.
Teradyne, Inc.
Teradyne delivers a stronger ROE of 19.24% and a healthy net margin of 19.23%, reflecting operational efficiency. However, its P/E ratio of 36.93 and P/B of 7.11 indicate a stretched valuation. The company supports investors with a modest 0.38% dividend yield while maintaining a favorable balance sheet and high-interest coverage, reducing financial risk.
Premium Valuation vs. Operational Safety
Teradyne trades at a premium but offers higher profitability and stronger balance sheet metrics. Micron provides a more balanced valuation with solid returns but shows caution signals in capital efficiency. Investors seeking growth with operational safety might prefer Teradyne’s profile, while value-focused investors may find Micron more appealing.
Which one offers the Superior Shareholder Reward?
I compare Micron Technology, Inc. (MU) and Teradyne, Inc. (TER) on their shareholder returns through dividends and buybacks. MU yields 0.38% with a low payout ratio near 6%, signaling conservative dividends backed by thin free cash flow coverage (only ~9.5%). Its buyback intensity is modest given high capital expenditures (~14.2/share). TER offers a similar yield around 0.38% but at a higher payout ratio (~14%), supported by robust free cash flow conversion (~70%). TER’s buyback program is more aggressive, complementing dividends for total return. Historically in tech hardware, TER’s balanced distribution with strong cash flow and low debt (2% assets) sustains long-term value better than MU’s capital-intensive, lower-yield approach. I conclude TER provides a superior total shareholder reward in 2026.
Comparative Score Analysis: The Strategic Profile
The radar chart reveals the fundamental DNA and trade-offs of Micron Technology and Teradyne, highlighting their financial strengths and valuation differences:
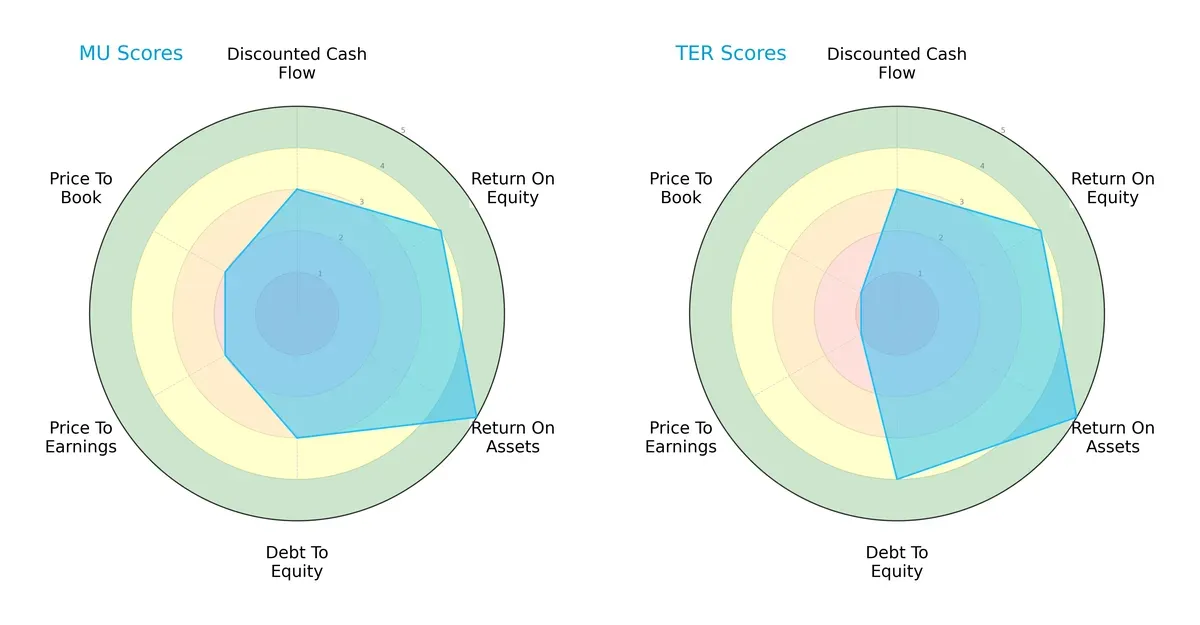
Both companies show strong operational efficiency with identical ROE (4) and ROA (5) scores. Teradyne edges out with a better debt-to-equity score (4 vs. 3), signaling a more conservative balance sheet. Micron holds a slight advantage in valuation metrics (PE and PB scores at 2 vs. Teradyne’s 1), suggesting it faces less market premium risk. Overall, Micron presents a more balanced profile, while Teradyne leans on its financial stability to offset valuation challenges.
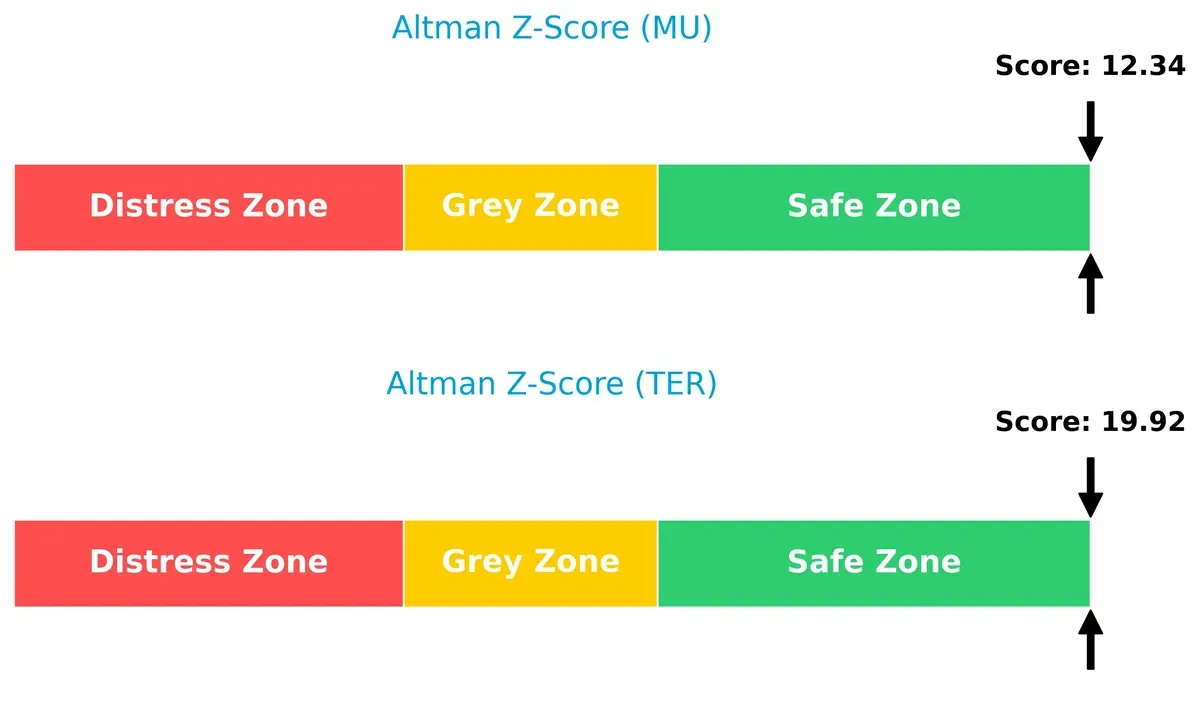
Bankruptcy Risk: Solvency Showdown
Micron and Teradyne both sit comfortably in the safe zone, but Teradyne’s Altman Z-Score (19.9) significantly exceeds Micron’s (12.3), implying superior long-term solvency and reduced bankruptcy risk in this cycle:
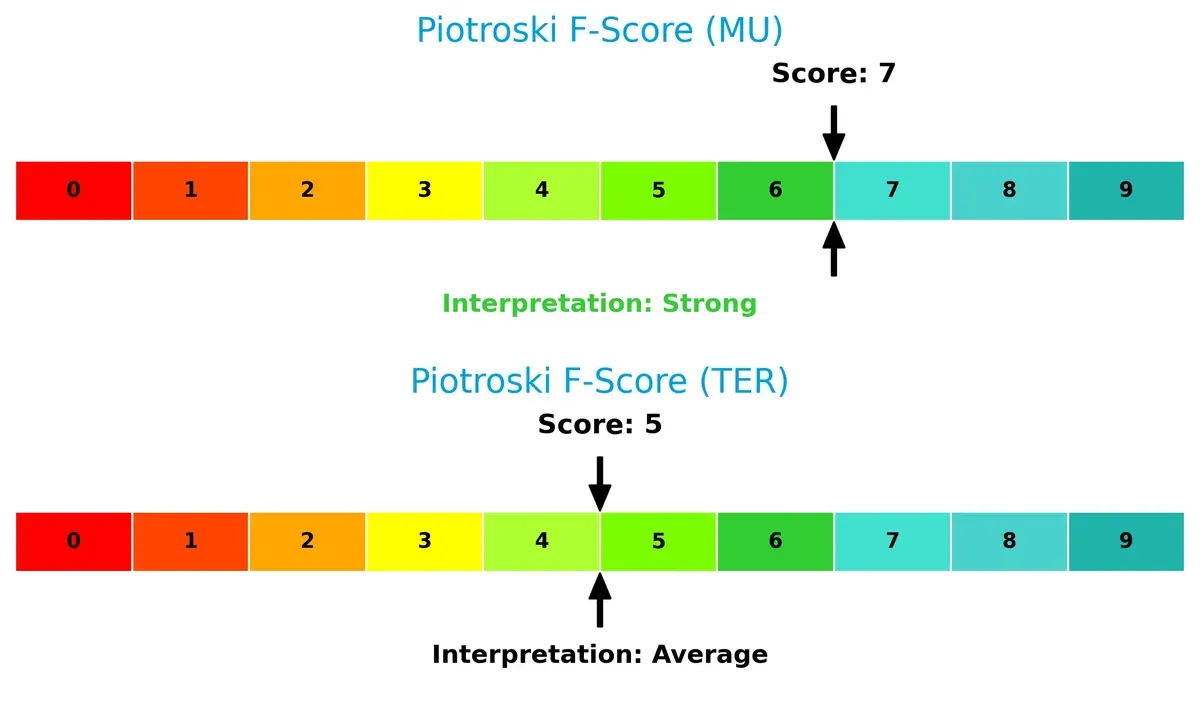
Financial Health: Quality of Operations
Micron’s Piotroski F-Score of 7 outpaces Teradyne’s 5, indicating stronger fundamental health and fewer red flags in profitability, leverage, and liquidity:
How are the two companies positioned?
This section dissects MU and TER’s operational DNA by comparing revenue distribution and internal strengths and weaknesses. The goal is to confront their economic moats to identify the more resilient and sustainable competitive advantage today.
Revenue Segmentation: The Strategic Mix
This visual comparison dissects how Micron Technology and Teradyne diversify their income streams and highlights each firm’s primary sector bets:
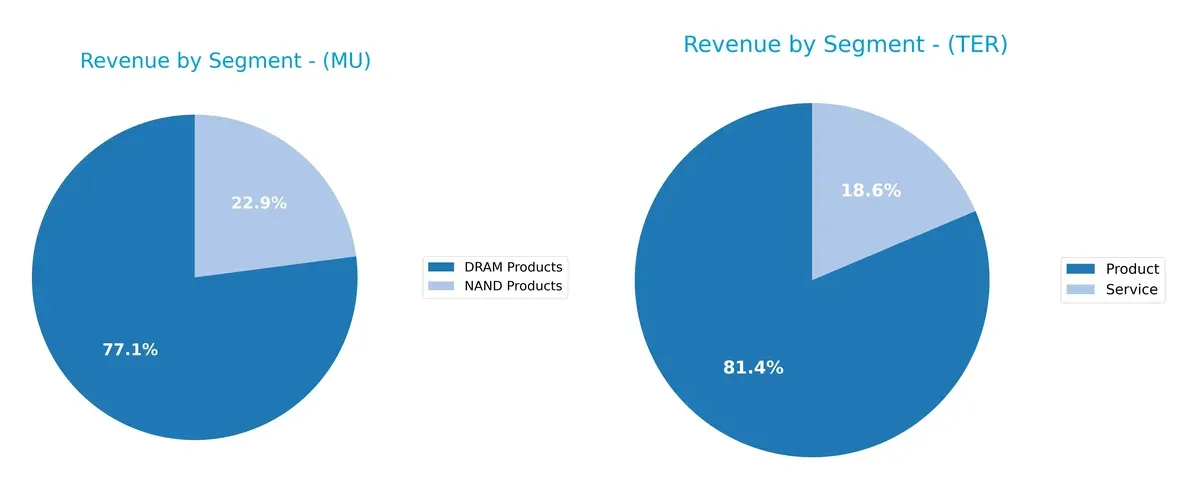
Micron Technology anchors revenue heavily in DRAM products at $28.6B, with NAND adding $8.5B, showing a strong concentration in memory chips. In contrast, Teradyne splits revenue between products ($2.3B) and services ($525M), revealing a more balanced mix. Micron’s focus signals infrastructure dominance but exposes it to memory cycle volatility. Teradyne’s diversification across products and services reduces concentration risk and supports ecosystem lock-in through testing and automation solutions.
Strengths and Weaknesses Comparison
This table compares the Strengths and Weaknesses of Micron Technology, Inc. (MU) and Teradyne, Inc. (TER):
MU Strengths
- Strong net margin of 22.84%
- Favorable ROE at 15.76%
- Solid liquidity with current ratio 2.52 and quick ratio 1.79
- Low debt-to-assets at 18.45%
- Diversified revenue streams across DRAM and NAND products
- Significant US and Taiwan market presence
TER Strengths
- Favorable net margin of 19.23%
- Higher ROE at 19.24%
- Excellent interest coverage of 81.79
- Very low debt-to-assets at 2.07%
- Strong fixed asset turnover at 4.88
- Balanced revenue from product and service segments
- Global footprint including EMEA, Asia, and US markets
MU Weaknesses
- ROIC at 12.12% below WACC of 22.1%, indicating potential value destruction
- Unfavorable asset and fixed asset turnover ratios
- Dividend yield low at 0.38%
- PE and PB ratios neutral, may imply fair valuation
- Heavy dependence on semiconductor memory segment
TER Weaknesses
- High PE of 36.93 and PB of 7.11, indicating expensive valuation
- ROIC and WACC data unavailable, limiting capital efficiency assessment
- Dividend yield also low at 0.38%
- Asset turnover neutral at 0.76, suggesting moderate efficiency
Both companies exhibit robust profitability and strong liquidity with distinct capital structures. MU faces challenges in capital returns relative to its cost of capital, while TER’s valuation appears stretched. Their global diversification and market segmentation reflect differing strategic focuses in semiconductor and industrial automation sectors.
The Moat Duel: Analyzing Competitive Defensibility
A structural moat is the only fortress protecting long-term profits from relentless competition and market erosion:
Micron Technology, Inc.: Cost Advantage with Margin Resilience
Micron’s moat stems from its cost-efficient DRAM and NAND manufacturing. It sustains high gross margins near 40% and EBIT margins above 27%. Robust revenue and profit growth in 2025 suggest deepening market reach despite industry cyclicality.
Teradyne, Inc.: Specialized Automation and Testing Expertise
Teradyne’s moat relies on specialized test equipment and industrial automation. Its gross margin exceeds 58%, but EBIT margin trails Micron’s at 20.6%. Growth is modest with recent margin pressure, signaling challenges in scaling beyond core semiconductor test markets.
Cost Leadership vs. Niche Specialization: Who Holds the Moat Edge?
Micron’s cost advantage delivers wider economic value and margin expansion, while Teradyne’s niche expertise faces growth and margin headwinds. I see Micron better positioned to defend and expand its market share through scale and innovation.
Which stock offers better returns?
The stock prices of Micron Technology and Teradyne have shown strong upward momentum over the past year, with notable acceleration and increasing buyer dominance in recent months.
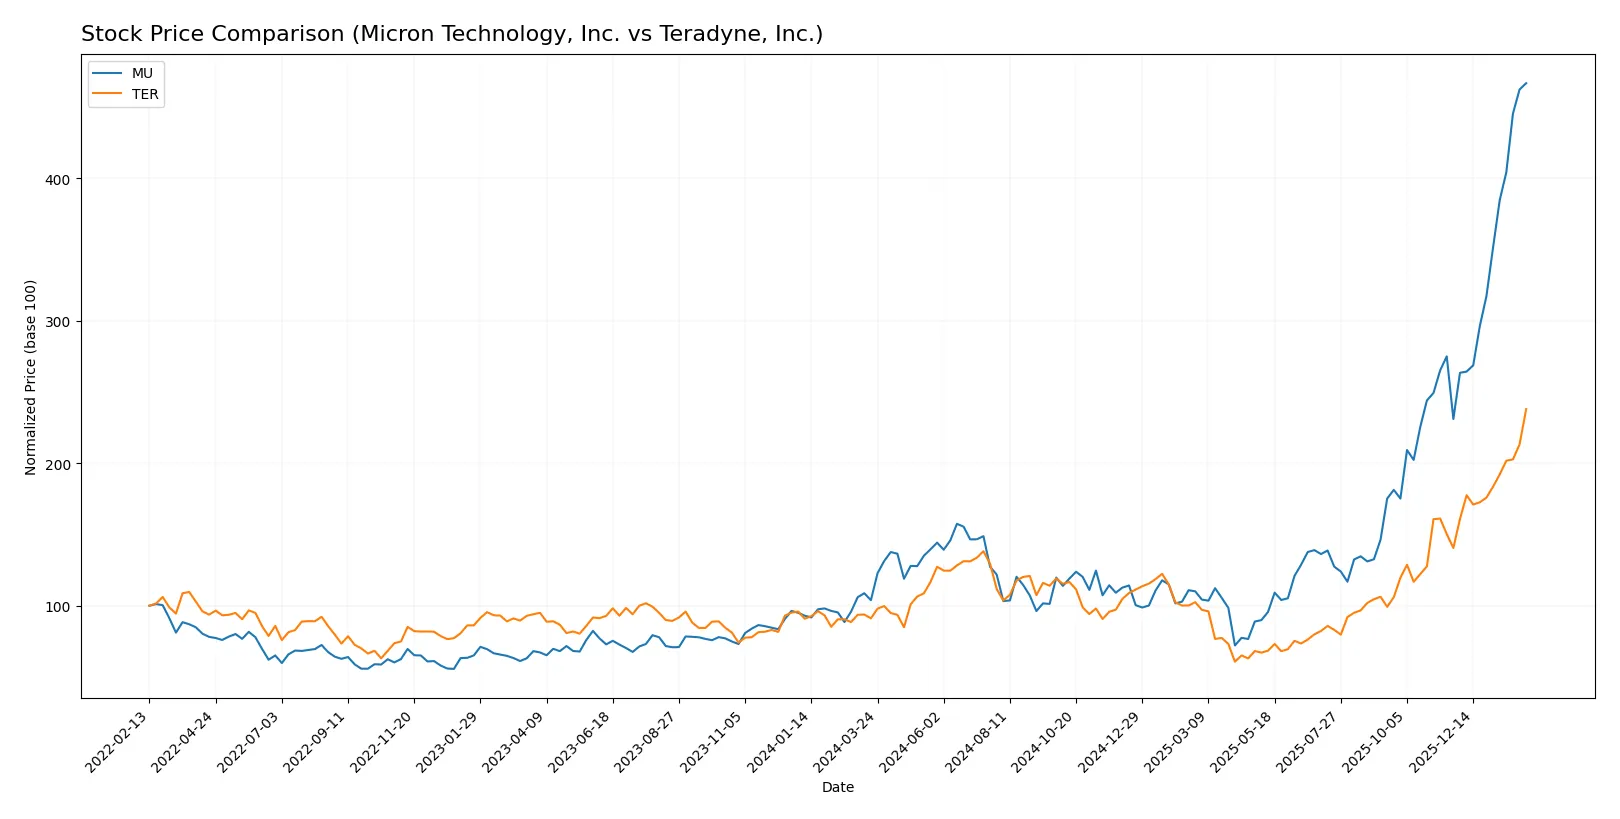
Trend Comparison
Micron Technology’s stock surged 349.19% over the past 12 months, marking a bullish trend with accelerating gains and a high volatility level of 75.35. The price ranged from 64.72 to 418.87.
Teradyne’s stock rose 161.09% in the same period, also bullish with acceleration but lower volatility at 39.2. Its price moved between 68.72 and 269.07, indicating steady growth.
Micron Technology outperformed Teradyne in market performance, delivering more than double the price appreciation over the past year with stronger recent acceleration.
Target Prices
Analysts present a mixed but generally optimistic target consensus for Micron Technology and Teradyne.
| Company | Target Low | Target High | Consensus |
|---|---|---|---|
| Micron Technology, Inc. | 190 | 480 | 345.61 |
| Teradyne, Inc. | 136 | 280 | 230.17 |
Micron’s consensus target of 345.61 sits below its current price of 415.83, suggesting potential downside or a market premium. Teradyne’s target consensus of 230.17 is also below its current 270.05, indicating cautious analyst expectations despite recent gains.

Don’t Let Luck Decide Your Entry Point
Optimize your entry points with our advanced ProRealTime indicators. You’ll get efficient buy signals with precise price targets for maximum performance. Start outperforming now!
How do institutions grade them?
Micron Technology, Inc. Grades
The following table summarizes recent institutional grades for Micron Technology, Inc.:
| Grading Company | Action | New Grade | Date |
|---|---|---|---|
| Mizuho | Maintain | Outperform | 2026-01-27 |
| Stifel | Maintain | Buy | 2026-01-20 |
| Rosenblatt | Maintain | Buy | 2026-01-20 |
| TD Cowen | Maintain | Buy | 2026-01-20 |
| Citigroup | Maintain | Buy | 2026-01-15 |
| Wells Fargo | Maintain | Overweight | 2026-01-15 |
| Cantor Fitzgerald | Maintain | Overweight | 2026-01-14 |
| Keybanc | Maintain | Overweight | 2026-01-13 |
| B of A Securities | Maintain | Buy | 2026-01-13 |
| Lynx Global | Maintain | Buy | 2026-01-12 |
Teradyne, Inc. Grades
The following table summarizes recent institutional grades for Teradyne, Inc.:
| Grading Company | Action | New Grade | Date |
|---|---|---|---|
| Evercore ISI Group | Maintain | Outperform | 2026-02-03 |
| Cantor Fitzgerald | Maintain | Overweight | 2026-02-02 |
| Stifel | Maintain | Buy | 2026-01-30 |
| UBS | Maintain | Buy | 2026-01-26 |
| B of A Securities | Maintain | Buy | 2026-01-22 |
| Stifel | Maintain | Buy | 2026-01-14 |
| B of A Securities | Maintain | Buy | 2026-01-13 |
| Goldman Sachs | Upgrade | Buy | 2025-12-16 |
| Stifel | Upgrade | Buy | 2025-12-02 |
| Citigroup | Maintain | Buy | 2025-11-12 |
Which company has the best grades?
Both companies receive strong institutional support with predominantly Buy and Outperform grades. Teradyne shows more recent upgrades from Sell and Hold to Buy, signaling improving sentiment. This could influence investor confidence differently compared to Micron’s steady maintenance of positive ratings.
Risks specific to each company
The following categories identify the critical pressure points and systemic threats facing both firms in the 2026 market environment:
1. Market & Competition
Micron Technology, Inc.
- Faces intense price competition in memory products amid cyclical semiconductor downturns.
Teradyne, Inc.
- Operates in highly specialized automated test equipment markets with strong competition but niche positioning.
2. Capital Structure & Debt
Micron Technology, Inc.
- Maintains moderate leverage with D/E of 0.28 and solid interest coverage at 21.26x, indicating manageable debt risk.
Teradyne, Inc.
- Extremely conservative capital structure with minimal debt (D/E 0.03) and very strong interest coverage at 81.79x.
3. Stock Volatility
Micron Technology, Inc.
- Beta of 1.505 suggests above-market volatility but less extreme than peers in semiconductors.
Teradyne, Inc.
- Higher beta at 1.821 signals greater sensitivity to market swings and riskier stock price fluctuations.
4. Regulatory & Legal
Micron Technology, Inc.
- Subject to semiconductor export controls and trade policy risks, given global supply chain exposure.
Teradyne, Inc.
- Faces regulatory scrutiny mainly in industrial automation and wireless sectors, with less exposure to export restrictions.
5. Supply Chain & Operations
Micron Technology, Inc.
- Vulnerable to raw material shortages and capacity constraints in memory chip fabrication.
Teradyne, Inc.
- Benefits from diversified segments but exposed to supply chain disruptions for complex test equipment components.
6. ESG & Climate Transition
Micron Technology, Inc.
- Faces pressure to reduce energy consumption in manufacturing and improve sustainability of semiconductor processes.
Teradyne, Inc.
- Increasing focus on robotics and automation aligns with energy efficiency trends, but still faces ESG risks in manufacturing.
7. Geopolitical Exposure
Micron Technology, Inc.
- High geopolitical risk due to reliance on Asian manufacturing hubs and ongoing US-China tensions.
Teradyne, Inc.
- Lower geopolitical risk profile, with more US-centric operations and diversified global customers.
Which company shows a better risk-adjusted profile?
Micron’s most impactful risk is its exposure to cyclical semiconductor markets and geopolitical tensions impacting supply chains. Teradyne’s main risk lies in its high stock volatility and expensive valuation multiples. Despite these risks, Teradyne’s pristine balance sheet and strong liquidity improve its risk-adjusted profile. Teradyne’s debt-to-assets at 2.07% contrasts sharply with Micron’s 18.45%, underscoring superior financial stability. This financial prudence and operational diversification make Teradyne the safer choice for risk-conscious investors in 2026.
Final Verdict: Which stock to choose?
Micron Technology’s superpower lies in its remarkable ability to rebound with accelerating growth and strong profitability metrics. Its main point of vigilance is the current discrepancy between ROIC and WACC, signaling potential value destruction despite rising profitability. It fits well within an aggressive growth portfolio willing to weather volatility for substantial upside.
Teradyne stands out with a strategic moat rooted in operational efficiency and a rock-solid balance sheet, underscored by exceptionally low leverage and superior interest coverage. Relative to Micron, it offers a safer profile but trades at a notable valuation premium. It suits a GARP (Growth at a Reasonable Price) portfolio seeking stability alongside growth.
If you prioritize high-growth momentum and can tolerate some capital efficiency risks, Micron’s accelerating earnings and improving margins make it the compelling choice. However, if you seek better financial stability with a defensible moat and lower leverage, Teradyne offers superior risk-adjusted resilience despite commanding a premium valuation.
Disclaimer: Investment carries a risk of loss of initial capital. The past performance is not a reliable indicator of future results. Be sure to understand risks before making an investment decision.
Go Further
I encourage you to read the complete analyses of Micron Technology, Inc. and Teradyne, Inc. to enhance your investment decisions: