Home > Comparison > Technology > MU vs STM
The strategic rivalry between Micron Technology, Inc. and STMicroelectronics N.V. shapes the semiconductor industry’s future. Micron operates as a memory and storage powerhouse with a capital-intensive model focused on DRAM and NAND technologies. In contrast, STMicroelectronics emphasizes diversified analog, sensor, and microcontroller products with broad industrial and automotive applications. This analysis pits Micron’s scale and specialization against ST’s diversified approach to identify which offers superior risk-adjusted returns for a balanced portfolio.
Table of contents
Companies Overview
Micron Technology and STMicroelectronics are pivotal players in the semiconductor industry, shaping global technology trends.
Micron Technology, Inc.: Memory and Storage Powerhouse
Micron Technology dominates the memory and storage segment, designing DRAM, NAND, and NOR products. Its revenue stems from supplying memory solutions for cloud servers, mobile devices, and automotive markets. In 2026, Micron focuses on advancing high-speed memory technologies to capture growth in enterprise and consumer storage sectors.
STMicroelectronics N.V.: Diverse Semiconductor Innovator
STMicroelectronics leads with a broad semiconductor portfolio, including automotive ICs, analog products, sensors, and microcontrollers. Its revenue relies on serving automotive, industrial, and personal electronics markets worldwide. The company emphasizes innovation in power transistors and MEMS to strengthen its position in industrial and automotive applications.
Strategic Collision: Similarities & Divergences
Micron pursues a specialized memory-focused strategy, while STMicroelectronics adopts a diversified semiconductor approach. They clash primarily in automotive and industrial segments, where memory and sensor integration overlap. Investors face distinct profiles: Micron bets on memory tech leadership, whereas ST bets on broad industrial innovation and product variety.
Income Statement Comparison
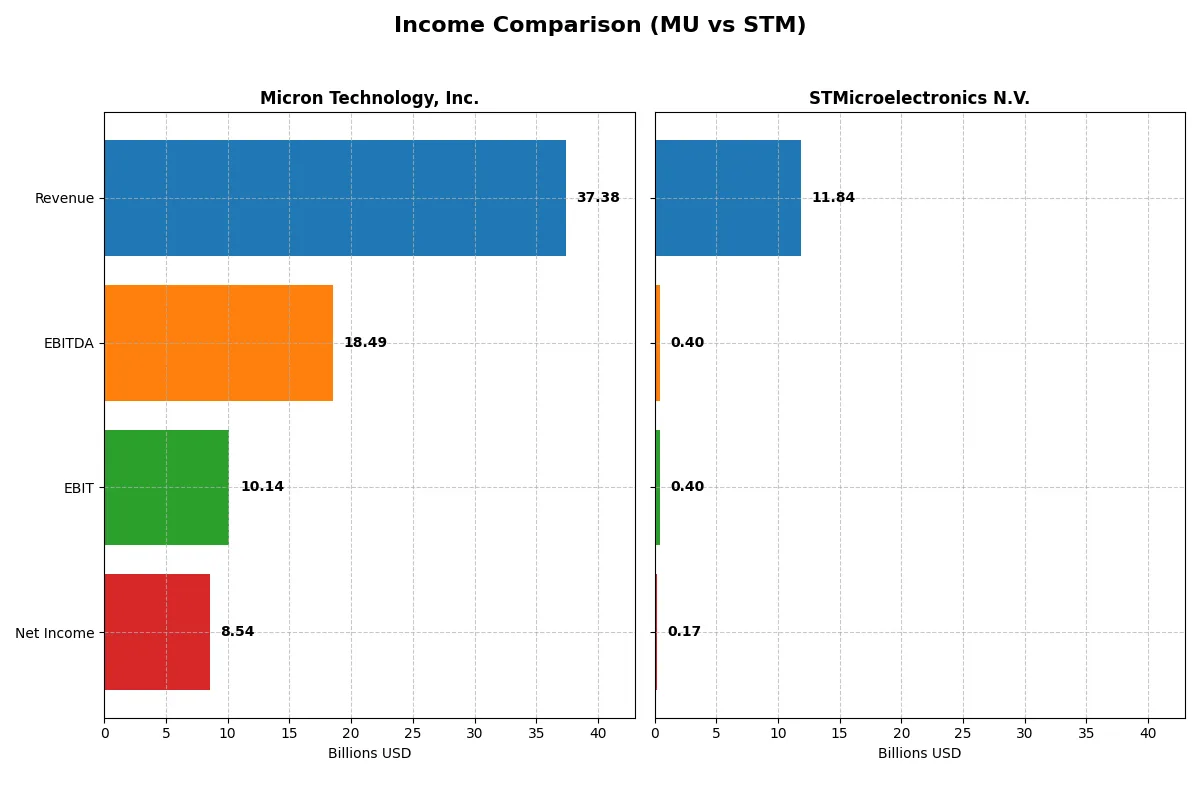
This data dissects the core profitability and scalability of both corporate engines to reveal who dominates the bottom line:
| Metric | Micron Technology, Inc. (MU) | STMicroelectronics N.V. (STM) |
|---|---|---|
| Revenue | 37.4B | 11.8B |
| Cost of Revenue | 22.5B | 7.8B |
| Operating Expenses | 5.0B | 3.7B |
| Gross Profit | 14.9B | 4.0B |
| EBITDA | 18.5B | 0.4B |
| EBIT | 10.1B | 0.4B |
| Interest Expense | 0.5B | 0 |
| Net Income | 8.5B | 0 |
| EPS | 7.65 | 0.19 |
| Fiscal Year | 2025 | 2025 |
Income Statement Analysis: The Bottom-Line Duel
The income statement comparison uncovers which company converts revenue into profit more efficiently and sustains margin strength over time.
Micron Technology, Inc. Analysis
Micron’s revenue surged from $15.5B in 2023 to $37.4B in 2025, with net income rebounding sharply from a $5.8B loss to $8.5B profit. Its gross margin climbs to nearly 40%, while net margin hits 22.8%, reflecting robust cost control and accelerating profitability in 2025. Momentum is strong, driven by efficient operating expense management and rising EPS.
STMicroelectronics N.V. Analysis
STMicroelectronics’ revenue declined by 11% from $17.3B in 2023 to $11.8B in 2025, dragging net income down from $4.2B to near breakeven. Despite a stable gross margin around 34%, its net margin plummeted to 1.4%, signaling margin compression and weak bottom-line performance. Recent years show deteriorating profitability and shrinking EBIT, indicating operational challenges.
Margin Strength vs. Revenue Growth
Micron decisively outperforms STMicroelectronics in both revenue growth and margin expansion over 2021–2025. Micron’s ability to transform higher sales into robust profits contrasts with ST’s declining revenue and compressed margins. For investors prioritizing sustainable profitability, Micron’s profile offers clearer fundamental strength and operational efficiency.
Financial Ratios Comparison
These vital ratios act as a diagnostic tool to expose the underlying fiscal health, valuation premiums, and capital efficiency of the companies compared below:
| Ratios | Micron Technology, Inc. (MU) | STMicroelectronics N.V. (STM) |
|---|---|---|
| ROE | 15.76% | 0.93% |
| ROIC | 12.12% | 0.67% |
| P/E | 15.94 | 0 (no positive earnings) |
| P/B | 2.51 | 0 |
| Current Ratio | 2.52 | 3.36 |
| Quick Ratio | 1.79 | 2.43 |
| D/E (Debt-to-Equity) | 0.28 | 0.12 |
| Debt-to-Assets | 18.45% | 8.60% |
| Interest Coverage | 20.69 | 0 (no interest coverage) |
| Asset Turnover | 0.45 | 0.48 |
| Fixed Asset Turnover | 0.79 | 1.07 |
| Payout ratio | 6.11% | 0% |
| Dividend yield | 0.38% | 0% |
| Fiscal Year | 2025 | 2025 |
Efficiency & Valuation Duel: The Vital Signs
Financial ratios act as the company’s DNA, uncovering hidden risks and operational strengths that shape investor confidence and valuation.
Micron Technology, Inc.
Micron posts a solid 15.76% ROE and a strong 22.84% net margin, signaling efficient profitability. Its P/E at 15.94 and P/B at 2.51 suggest a fairly valued stock. Shareholders see modest 0.38% dividend yield, reflecting a cautious payout amid reinvestment in R&D and growth initiatives.
STMicroelectronics N.V.
STMicroelectronics shows weak profitability with a 0.93% ROE and 1.41% net margin, indicating operational challenges. The absence of P/E and P/B ratios implies limited valuation clarity. No dividends are paid, and the company likely prioritizes reinvestment in R&D, given its 17.3% R&D-to-revenue spend, to fuel future growth.
Balanced Profitability vs. Growth Uncertainty
Micron offers a better profitability profile and fair valuation, balancing risk and reward effectively. STMicroelectronics carries operational weakness and unclear valuation, fitting investors seeking growth with tolerance for risk and lower current returns.
Which one offers the Superior Shareholder Reward?
I find Micron Technology (MU) delivers a more sustainable shareholder reward than STMicroelectronics (STM) in 2026. MU pays a modest dividend yield of 0.38% with a low payout ratio (~6%), backed by positive free cash flow coverage. Its buyback programs, implied by strong cash flows and low debt, boost total returns. STM’s dividend yield is slightly higher at 1.28%, but its payout ratio (~18%) and negative free cash flow raise sustainability concerns. STM’s weak buyback activity and volatile margins limit its distribution reliability. MU’s prudent capital allocation and resilient cash generation position it as the superior total return choice.
Comparative Score Analysis: The Strategic Profile
The radar chart reveals the fundamental DNA and trade-offs of Micron Technology, Inc. and STMicroelectronics N.V., highlighting their core financial strengths and valuation nuances:
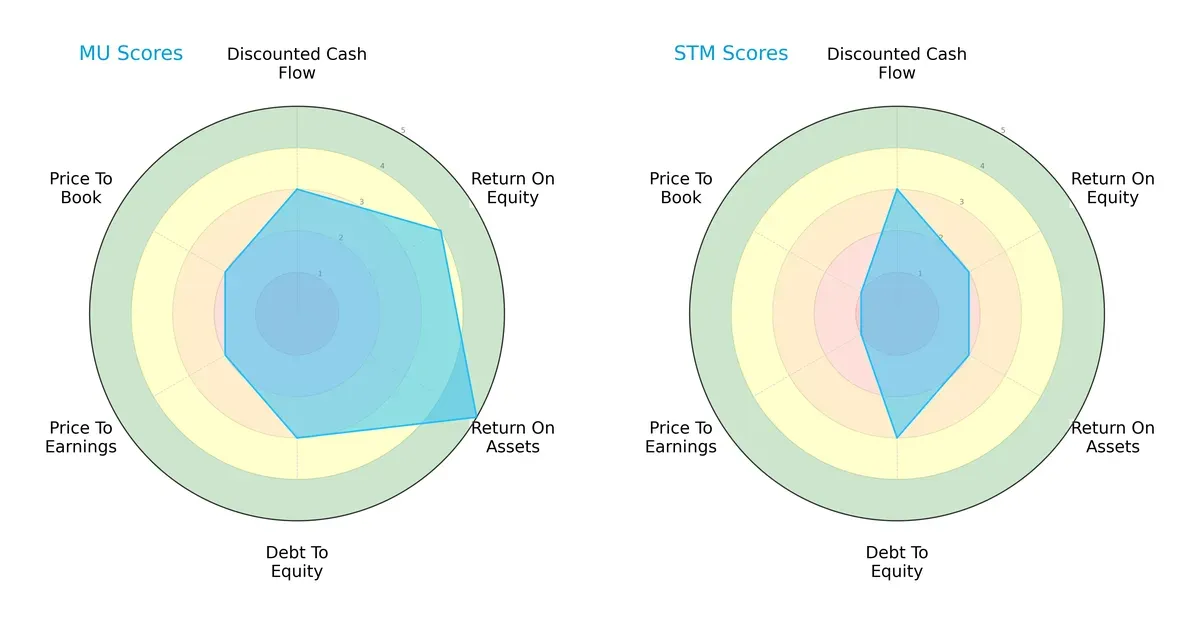
Micron shows a more balanced profile with superior ROE (4 vs. 2) and ROA (5 vs. 2) scores, indicating efficient asset utilization and profit generation. Both have moderate DCF (3) and debt-to-equity scores (3). STMicroelectronics lags on valuation metrics, scoring very unfavorable on P/E (1 vs. 2) and P/B (1 vs. 2), suggesting potential overvaluation or weaker market sentiment. Micron relies on operational efficiency, while STMicroelectronics faces pricing challenges.
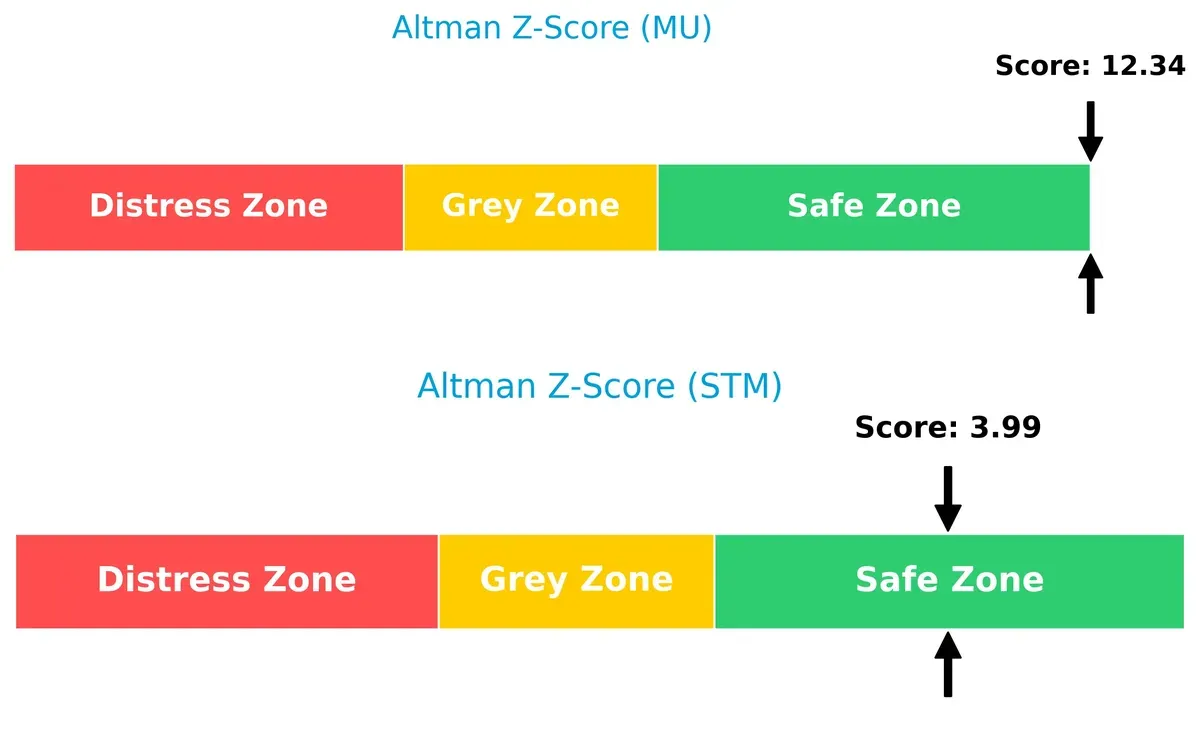
Bankruptcy Risk: Solvency Showdown
Micron’s Altman Z-Score (12.3) far exceeds STMicroelectronics’ (4.0), placing both safely above distress but indicating Micron’s superior long-term solvency and resilience in this cycle:
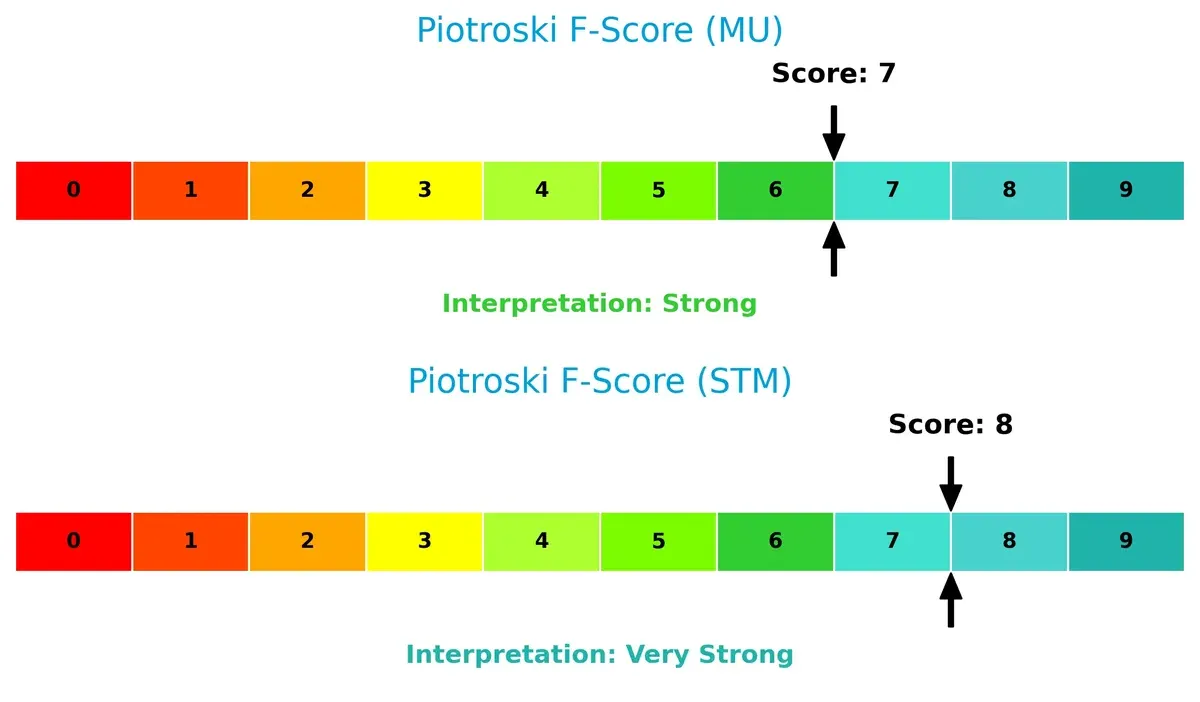
Financial Health: Quality of Operations
STMicroelectronics scores an 8 on the Piotroski scale, just above Micron’s strong 7, signaling slightly better financial health and internal operations. Neither shows red flags, but STMicroelectronics edges out in operational quality:
How are the two companies positioned?
This section dissects MU and STM’s operational DNA by comparing revenue distribution and internal dynamics. Our goal is to confront their economic moats to identify the most resilient, sustainable advantage today.
Revenue Segmentation: The Strategic Mix
This visual comparison dissects how Micron Technology and STMicroelectronics diversify their income streams and where their primary sector bets lie:
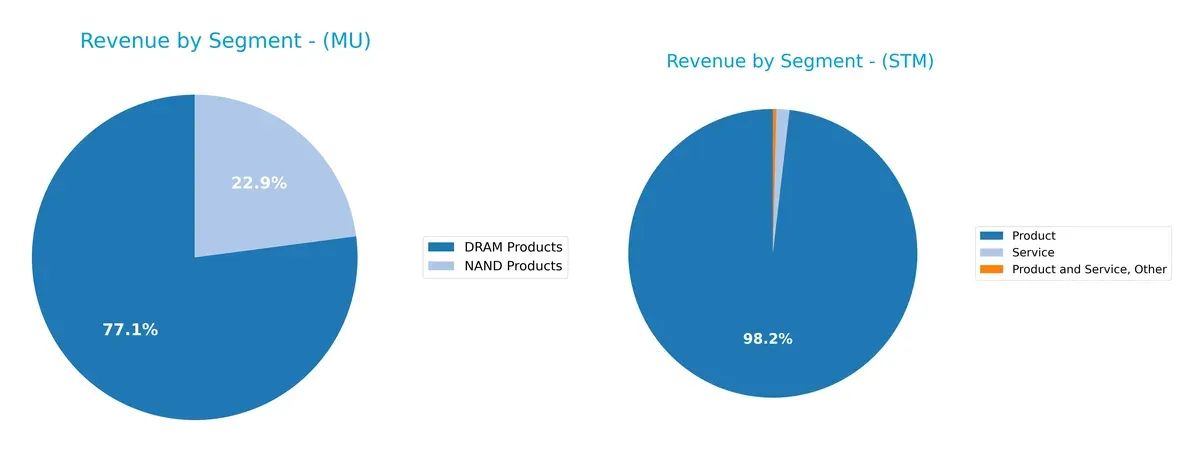
Micron Technology anchors its revenue in DRAM Products, generating $28.6B in 2025, dwarfing its NAND segment at $8.5B. This concentration signals strong dominance but exposes it to memory cycle volatility. STMicroelectronics exhibits a more diversified mix, with $13.2B from Product sales and smaller Service and Other streams, reducing dependency risk. Micron’s focused exposure contrasts with ST’s broader ecosystem, each strategy reflecting different resilience and growth dynamics.
Strengths and Weaknesses Comparison
This table compares the Strengths and Weaknesses of Micron Technology, Inc. and STMicroelectronics N.V.:
Micron Technology Strengths
- Strong profitability with 22.84% net margin and 15.76% ROE
- Favorable liquidity ratios: current ratio 2.52, quick ratio 1.79
- Low debt levels with 0.28 debt-to-equity and 18.45% debt-to-assets
- Large US and Taiwan market presence generating multi-billion revenues
- Balanced revenue mix across DRAM and NAND products segments
STMicroelectronics Strengths
- Favorable valuation metrics with PE and PB rated positively
- Strong interest coverage with infinite ratio, low debt with 0.12 debt-to-equity
- Diverse geographic presence including Singapore, Switzerland, and Europe
- Solid quick ratio of 2.43 supports near-term liquidity
- Moderate asset turnover showing efficient use of fixed assets
Micron Technology Weaknesses
- Unfavorable ROIC (12.12%) below high WACC (22.1%) questions capital efficiency
- Asset turnover ratios low: 0.45 total and 0.79 fixed asset turnover
- Dividend yield low at 0.38%, limiting income appeal
- Neutral valuation metrics reflect mixed market sentiment
- High WACC at 22.1% implies elevated capital cost and risk
STMicroelectronics Weaknesses
- Weak profitability with 1.41% net margin and 0.93% ROE
- ROIC at 0.67%, below WACC of 9.52%, indicating poor capital returns
- Unfavorable current ratio at 3.36 may reflect inefficient working capital
- Zero dividend yield reduces shareholder income potential
- Asset turnover only fair with 0.48 total and 1.07 fixed asset turnover
Both companies demonstrate strengths in liquidity and geographic diversification. Micron leads significantly in profitability and scale, while STMicroelectronics shows advantages in valuation and conservative leverage. Weaknesses highlight Micron’s capital efficiency challenges and ST’s struggle with profitability and working capital management. These factors shape each firm’s strategic focus on operational improvements and market positioning.
The Moat Duel: Analyzing Competitive Defensibility
A structural moat alone shields long-term profits from relentless competitive pressures and market erosion. Let’s dissect the moats of Micron Technology and STMicroelectronics:
Micron Technology, Inc.: Technology-Driven Scale Advantage
Micron’s moat stems from its cost advantage as a leading memory chip manufacturer. It sustains high gross margins near 40% and robust net margins above 22%. Although ROIC trails WACC, improving profitability signals potential moat strengthening through new product cycles and market expansion in cloud and mobile sectors for 2026.
STMicroelectronics N.V.: Diversified Product Niche
STMicroelectronics relies on its broad analog and sensor portfolio, differentiating from Micron’s memory focus. Yet, slender EBIT and net margins under 4% reveal a fragile moat. Declining ROIC confirms eroding competitive power. Expansion into power semiconductors and automotive electronics offers growth potential but faces intense rivals and margin pressure.
Cost Leadership vs. Product Breadth: Who Defends Better?
Micron’s cost-driven moat is deeper, supported by margin strength and growth in high-demand memory markets. STMicroelectronics’ niche breadth faces margin and profitability challenges. I see Micron better equipped to defend market share amid semiconductor volatility in 2026.
Which stock offers better returns?
Micron Technology, Inc. and STMicroelectronics N.V. show contrasting price movements over the past year, reflecting divergent trading dynamics and market sentiment.
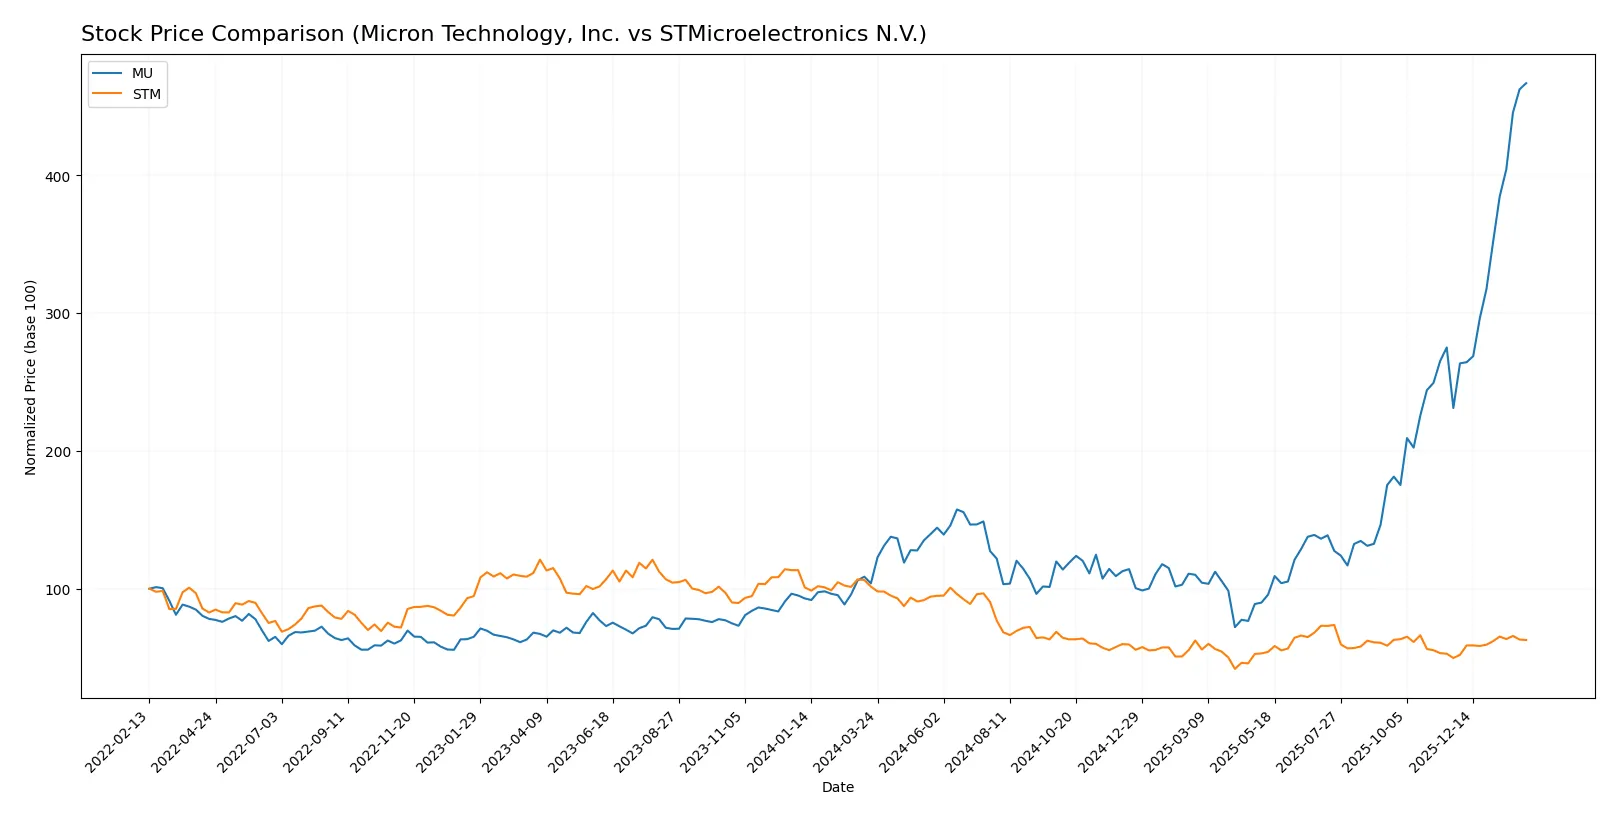
Trend Comparison
Micron Technology’s stock surged 349.19% over the past year, displaying a bullish trend with accelerating momentum and heightened volatility between $64.72 and $418.87.
STMicroelectronics’ stock declined 38.15% in the same period, marking a bearish trend with acceleration but lower volatility, fluctuating between $18.49 and $44.85.
Micron’s strong price appreciation significantly outperforms STMicroelectronics, delivering superior market returns despite higher volatility.
Target Prices
Analysts present a mixed but generally positive target price consensus for Micron Technology and STMicroelectronics.
| Company | Target Low | Target High | Consensus |
|---|---|---|---|
| Micron Technology, Inc. | 190 | 480 | 345.61 |
| STMicroelectronics N.V. | 28 | 45 | 37.67 |
Micron’s consensus target of $345.61 is below its current price near $417, signaling cautious optimism. STMicroelectronics’ $37.67 consensus target exceeds its current $27.75, implying upside potential.

Don’t Let Luck Decide Your Entry Point
Optimize your entry points with our advanced ProRealTime indicators. You’ll get efficient buy signals with precise price targets for maximum performance. Start outperforming now!
How do institutions grade them?
Micron Technology, Inc. Grades
The following table summarizes recent institutional grades for Micron Technology:
| Grading Company | Action | New Grade | Date |
|---|---|---|---|
| Mizuho | Maintain | Outperform | 2026-01-27 |
| Stifel | Maintain | Buy | 2026-01-20 |
| Rosenblatt | Maintain | Buy | 2026-01-20 |
| TD Cowen | Maintain | Buy | 2026-01-20 |
| Citigroup | Maintain | Buy | 2026-01-15 |
| Wells Fargo | Maintain | Overweight | 2026-01-15 |
| Cantor Fitzgerald | Maintain | Overweight | 2026-01-14 |
| Keybanc | Maintain | Overweight | 2026-01-13 |
| B of A Securities | Maintain | Buy | 2026-01-13 |
| Lynx Global | Maintain | Buy | 2026-01-12 |
STMicroelectronics N.V. Grades
The following table summarizes recent institutional grades for STMicroelectronics:
| Grading Company | Action | New Grade | Date |
|---|---|---|---|
| TD Cowen | Maintain | Buy | 2025-10-24 |
| Susquehanna | Maintain | Positive | 2025-10-22 |
| Susquehanna | Maintain | Positive | 2025-07-25 |
| Baird | Upgrade | Outperform | 2025-07-22 |
| Susquehanna | Maintain | Positive | 2025-07-22 |
| Jefferies | Upgrade | Buy | 2025-02-19 |
| Bernstein | Downgrade | Market Perform | 2025-02-05 |
| Susquehanna | Maintain | Positive | 2025-01-31 |
| Barclays | Downgrade | Underweight | 2025-01-22 |
| JP Morgan | Downgrade | Neutral | 2024-12-09 |
Which company has the best grades?
Micron Technology consistently receives strong Buy, Outperform, and Overweight ratings from multiple firms in early 2026. STMicroelectronics shows a mixed trend with upgrades but also recent downgrades to Market Perform and Underweight. This suggests Micron holds more favorable institutional sentiment, potentially attracting more investor confidence.
Risks specific to each company
The following categories identify the critical pressure points and systemic threats facing both firms in the 2026 market environment:
1. Market & Competition
Micron Technology, Inc.
- Faces intense competition in memory and storage segments dominated by cyclical demand swings.
STMicroelectronics N.V.
- Competes broadly in automotive and analog semiconductors, with diverse but fragmented markets.
2. Capital Structure & Debt
Micron Technology, Inc.
- Maintains moderate leverage with a debt-to-assets ratio of 18.45%, supported by strong interest coverage.
STMicroelectronics N.V.
- Exhibits lower leverage at 8.6% debt-to-assets and infinite interest coverage, reflecting conservative capital structure.
3. Stock Volatility
Micron Technology, Inc.
- Beta of 1.505 indicates higher-than-market volatility, reflecting sensitivity to semiconductor cycles.
STMicroelectronics N.V.
- Beta of 1.322 shows somewhat lower volatility but still above market average, indicating sector exposure.
4. Regulatory & Legal
Micron Technology, Inc.
- US-based firm faces evolving export controls and IP regulations impacting global memory chip sales.
STMicroelectronics N.V.
- European headquarters expose it to EU regulatory frameworks and trade policies affecting semiconductor exports.
5. Supply Chain & Operations
Micron Technology, Inc.
- Complex global supply chain with risks from component shortages and geopolitical tensions in Asia.
STMicroelectronics N.V.
- Diverse production footprint mitigates some risk but still vulnerable to semiconductor wafer supply constraints.
6. ESG & Climate Transition
Micron Technology, Inc.
- Faces pressure to reduce energy-intensive manufacturing emissions and enhance sustainable sourcing.
STMicroelectronics N.V.
- Strong focus on energy efficiency in automotive and industrial segments, but transition risks remain.
7. Geopolitical Exposure
Micron Technology, Inc.
- US-China tech tensions pose risks to supply chains and market access, especially in memory sectors.
STMicroelectronics N.V.
- Exposure to EU-US trade relations and Asia-Pacific geopolitical dynamics creates operational uncertainties.
Which company shows a better risk-adjusted profile?
Micron’s most impactful risk is its high market volatility driven by cyclical memory demand and geopolitical tensions with China. STMicroelectronics’ primary concern is weak profitability amid regulatory and supply chain pressures. Despite higher volatility, Micron’s stronger financial ratios and capital structure translate into a better risk-adjusted profile. Micron’s Altman Z-Score of 12.3 versus STMicroelectronics’ 4.0 confirms superior financial resilience, justifying cautious preference for Micron in 2026.
Final Verdict: Which stock to choose?
Micron Technology’s superpower lies in its robust growth trajectory and operational efficiency, driving strong profitability despite a challenging capital cost environment. Its main point of vigilance is the negative spread between ROIC and WACC, indicating value destruction risks. This stock suits aggressive growth portfolios willing to embrace cyclicality for outsized returns.
STMicroelectronics commands a strategic moat through diversified product lines and solid balance-sheet health, offering comparative safety with lower leverage and stable liquidity. However, its declining profitability and negative income growth over recent years temper enthusiasm. STM fits a cautious GARP (Growth at a Reasonable Price) profile seeking moderate upside with risk mitigation.
If you prioritize high-growth potential and can tolerate corporate cyclicality, Micron outshines due to its accelerating revenue and margin expansion. However, if you seek better stability and a resilient balance sheet amid industry headwinds, STMicroelectronics offers a safer haven despite weaker earnings momentum. Both present distinct analytical scenarios aligned with different risk appetites.
Disclaimer: Investment carries a risk of loss of initial capital. The past performance is not a reliable indicator of future results. Be sure to understand risks before making an investment decision.
Go Further
I encourage you to read the complete analyses of Micron Technology, Inc. and STMicroelectronics N.V. to enhance your investment decisions: