In the fast-evolving semiconductor industry, Micron Technology, Inc. (MU) and Silicon Laboratories Inc. (SLAB) stand out as key players driving innovation in memory solutions and mixed-signal technologies. Both companies serve critical markets like IoT, cloud computing, and industrial automation, making their strategies and market positions highly relevant for investors. In this article, I will analyze these firms to help you identify which offers the most compelling investment opportunity.

Table of contents
Companies Overview
I will begin the comparison between Micron Technology and Silicon Laboratories by providing an overview of these two companies and their main differences.
Micron Technology Overview
Micron Technology, Inc. is a leading global designer, manufacturer, and seller of memory and storage products. Operating through four segments, it offers DRAM, NAND, and NOR memory products under the Micron and Crucial brands. Its markets include cloud servers, enterprise, client, graphics, networking, smartphones, automotive, industrial, and consumer sectors. Founded in 1978, Micron is headquartered in Boise, Idaho, with a market cap of 373B USD.
Silicon Laboratories Overview
Silicon Laboratories Inc. is a fabless semiconductor company specializing in analog-intensive mixed-signal solutions such as wireless microcontrollers and sensors. Its products serve diverse IoT applications, including home security, industrial automation, smart metering, lighting, and medical instrumentation. Founded in 1996 and based in Austin, Texas, Silicon Labs has a market cap of about 4.9B USD and focuses on innovative IoT-related technologies.
Key similarities and differences
Both companies operate in the semiconductor industry and serve technology markets with advanced chip solutions. Micron focuses on memory and storage technologies targeting broad sectors including cloud and automotive, while Silicon Labs specializes in analog mixed-signal and IoT solutions for connected devices. Micron is a much larger company by market cap and employee count, whereas Silicon Labs is more niche with a fabless business model concentrated on IoT applications.
Income Statement Comparison
The table below presents a side-by-side comparison of key income statement metrics for Micron Technology, Inc. and Silicon Laboratories Inc. for their most recent fiscal years.

| Metric | Micron Technology, Inc. (MU) | Silicon Laboratories Inc. (SLAB) |
|---|---|---|
| Market Cap | 373B | 4.9B |
| Revenue | 37.4B | 584M |
| EBITDA | 18.5B | -105M |
| EBIT | 10.1B | -154M |
| Net Income | 8.5B | -191M |
| EPS | 7.65 | -5.93 |
| Fiscal Year | 2025 | 2024 |
Income Statement Interpretations
Micron Technology, Inc.
Micron Technology’s revenue increased significantly from $27.7B in 2021 to $37.4B in 2025, with net income rising from $5.9B to $8.5B over the same period. Margins improved, highlighted by a gross margin of 39.8% and net margin of 22.8% in 2025. The latest year showed robust revenue and profit growth, with net income surging 984% year-over-year, reflecting strong operational leverage and margin expansion.
Silicon Laboratories Inc.
Silicon Laboratories’ revenue grew modestly from $511M in 2020 to $584M in 2024 but declined 25% in the latest year. Net income, however, deteriorated sharply, turning negative to -$191M in 2024 from a modest profit in prior years. Despite a favorable gross margin of 53.4%, the company faced unfavorable EBIT and net margins, reflecting challenges in operational efficiency and profitability in the most recent fiscal year.
Which one has the stronger fundamentals?
Micron Technology exhibits stronger fundamentals, supported by consistent revenue and net income growth, expanding margins, and favorable profitability metrics. Conversely, Silicon Laboratories struggles with declining profitability and shrinking net income despite stable gross margins, leading to an unfavorable overall income statement evaluation. Therefore, Micron’s income statement trends indicate more robust financial health and operational strength.
Financial Ratios Comparison
The table below presents a side-by-side comparison of key financial ratios for Micron Technology, Inc. (MU) and Silicon Laboratories Inc. (SLAB) based on their most recent fiscal year data.
| Ratios | Micron Technology, Inc. (2025) | Silicon Laboratories Inc. (2024) |
|---|---|---|
| ROE | 15.8% | -17.7% |
| ROIC | 12.1% | -18.2% |
| P/E | 15.9 | -21.5 |
| P/B | 2.51 | 3.81 |
| Current Ratio | 2.52 | 6.15 |
| Quick Ratio | 1.79 | 5.07 |
| D/E | 0.28 | 0.01 |
| Debt-to-Assets | 18.5% | 1.3% |
| Interest Coverage | 20.7 | -126.3 |
| Asset Turnover | 0.45 | 0.48 |
| Fixed Asset Turnover | 0.79 | 4.42 |
| Payout ratio | 6.1% | 0% |
| Dividend yield | 0.38% | 0% |
Interpretation of the Ratios
Micron Technology, Inc.
Micron Technology shows predominantly strong ratios, including a favorable net margin of 22.84% and ROE of 15.76%, indicating solid profitability and efficiency. However, its asset turnover and fixed asset turnover ratios are weak, suggesting potential operational inefficiencies. The company pays dividends with a low yield of 0.38%, which is somewhat unfavorable, reflecting cautious shareholder returns.
Silicon Laboratories Inc.
Silicon Laboratories faces significant challenges with unfavorable profitability ratios, including a net margin of -32.69% and negative returns on equity and invested capital. Despite a strong fixed asset turnover and very low debt levels, its interest coverage is deeply negative, raising concerns. The company does not pay dividends, likely due to its negative earnings and focus on reinvestment and growth.
Which one has the best ratios?
Based on the evaluations, Micron Technology presents a more favorable overall financial profile with stronger profitability, leverage, and liquidity ratios. Silicon Laboratories, meanwhile, suffers from weak profitability and coverage metrics, resulting in an unfavorable global assessment. Therefore, Micron holds the advantage in terms of ratio strength.
Strategic Positioning
This section compares the strategic positioning of Micron Technology, Inc. and Silicon Laboratories Inc., focusing on market position, key segments, and exposure to technological disruption:
Micron Technology, Inc.
- Leading semiconductor firm with $373B market cap and strong competitive pressure in memory and storage markets.
- Diverse segments: DRAM, NAND, compute, mobile, embedded memory products driving revenues globally.
- Operates in mature memory technology fields with incremental innovation but exposed to semiconductor cycles.
Silicon Laboratories Inc.
- Smaller $4.9B market cap fabless semiconductor firm facing competitive pressures in mixed-signal IoT solutions.
- Focused on analog-intensive mixed-signal solutions for IoT applications including industrial and smart devices.
- Faces disruption risks from evolving IoT technologies and rapid changes in wireless and sensor markets.
Micron Technology, Inc. vs Silicon Laboratories Inc. Positioning
Micron has a diversified portfolio with broad end markets in memory and storage, providing scale advantages but cyclicality risks. Silicon Labs concentrates on IoT mixed-signal semiconductors, offering niche specialization but higher exposure to rapid technological shifts and smaller scale.
Which has the best competitive advantage?
Micron exhibits a slightly favorable moat with growing ROIC, indicating improving profitability and value creation. Silicon Labs shows a very unfavorable moat with declining ROIC, suggesting value destruction and weaker competitive positioning.
Stock Comparison
The stock price chart highlights strong bullish momentum for Micron Technology, Inc. (MU) with substantial gains and acceleration, while Silicon Laboratories Inc. (SLAB) also shows a moderate bullish trend but with less pronounced price growth over the past 12 months.
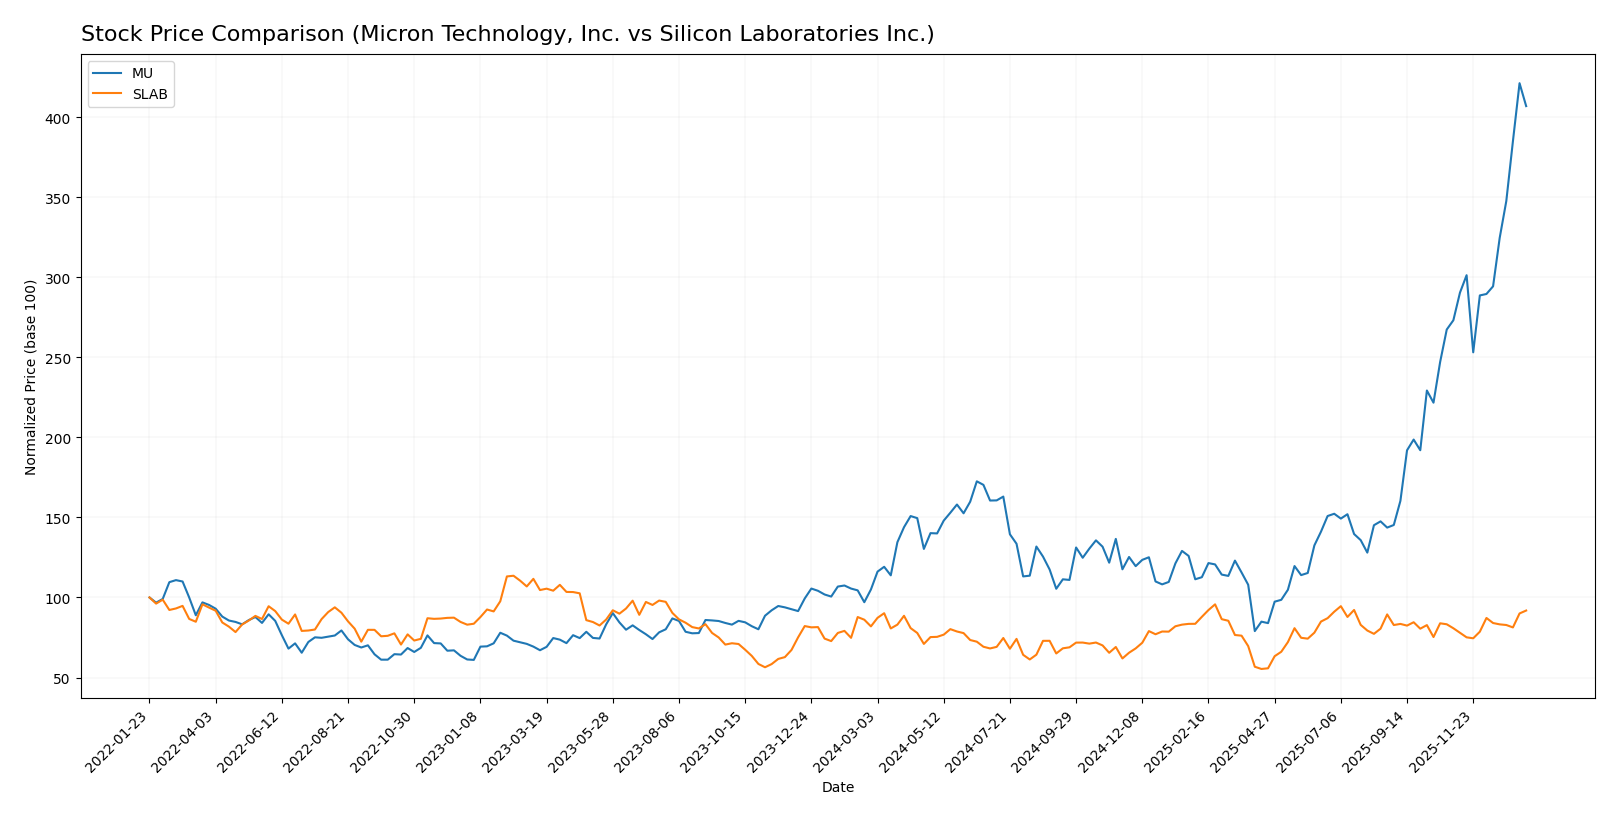
Trend Analysis
Micron Technology, Inc. (MU) experienced a significant bullish trend over the past year, with a price increase of 287.62%, showing acceleration and high volatility (std deviation 57.56). The stock reached a high of 345.09 and a low of 64.72.
Silicon Laboratories Inc. (SLAB) recorded a moderate bullish trend with a 12.08% price increase over the same period, also showing acceleration but with lower volatility (std deviation 14.09). Its price ranged between 89.82 and 155.33.
Comparing both stocks, MU delivered the highest market performance with a markedly stronger bullish trend and greater price appreciation than SLAB over the past 12 months.
Target Prices
The current analyst consensus reveals a balanced outlook for Micron Technology, Inc. and Silicon Laboratories Inc.
| Company | Target High | Target Low | Consensus |
|---|---|---|---|
| Micron Technology, Inc. | 450 | 190 | 328.22 |
| Silicon Laboratories Inc. | 165 | 130 | 151.67 |
Analysts expect Micron’s stock to trade slightly below its consensus target of 328.22, close to the current price of 333.35 USD. Silicon Laboratories shows a target consensus above its current price of 149.05 USD, indicating moderate upside potential.
Analyst Opinions Comparison
This section compares analysts’ ratings and grades for Micron Technology, Inc. (MU) and Silicon Laboratories Inc. (SLAB):
Rating Comparison
MU Rating
- Rating: B, classified as Very Favorable by analysts.
- Discounted Cash Flow Score: 1, indicating a Very Unfavorable valuation based on cash flows.
- ROE Score: 4, showing a Favorable return on shareholders’ equity.
- ROA Score: 5, rated Very Favorable for asset utilization efficiency.
- Debt To Equity Score: 3, moderate financial risk with balanced debt use.
- Overall Score: 3, a Moderate overall financial standing.
SLAB Rating
- Rating: C-, classified as Very Favorable by analysts.
- Discounted Cash Flow Score: 2, considered Moderate in valuation based on cash flows.
- ROE Score: 1, reflecting a Very Unfavorable return on equity.
- ROA Score: 1, rated Very Unfavorable for asset utilization efficiency.
- Debt To Equity Score: 1, indicating Very Unfavorable financial risk due to high debt levels.
- Overall Score: 1, a Very Unfavorable overall financial standing.
Which one is the best rated?
Based strictly on the data, MU is better rated than SLAB, with a higher overall score (3 vs 1) and superior scores in ROE, ROA, and debt management. SLAB’s ratings and financial scores are notably lower across all key metrics.
Scores Comparison
Here is a comparison of the Altman Z-Score and Piotroski Score for both companies:
MU Scores
- Altman Z-Score: 10.5, indicating a safe zone status
- Piotroski Score: 7, classified as strong
SLAB Scores
- Altman Z-Score: 15.6, indicating a safe zone status
- Piotroski Score: 4, classified as average
Which company has the best scores?
SLAB has a higher Altman Z-Score than MU, both in the safe zone, indicating stronger bankruptcy risk protection. MU has a better Piotroski Score, suggesting stronger financial health. Scores vary by metric.
Grades Comparison
The following section presents the recent grades and rating consensus for Micron Technology, Inc. and Silicon Laboratories Inc.:
Micron Technology, Inc. Grades
This table summarizes the latest grades assigned by reputable grading companies for Micron Technology, Inc.:
| Grading Company | Action | New Grade | Date |
|---|---|---|---|
| Keybanc | Maintain | Overweight | 2026-01-13 |
| B of A Securities | Maintain | Buy | 2026-01-13 |
| Lynx Global | Maintain | Buy | 2026-01-12 |
| Mizuho | Maintain | Outperform | 2026-01-09 |
| UBS | Maintain | Buy | 2026-01-07 |
| Piper Sandler | Maintain | Overweight | 2026-01-07 |
| Piper Sandler | Maintain | Overweight | 2025-12-18 |
| Barclays | Maintain | Overweight | 2025-12-18 |
| Keybanc | Maintain | Overweight | 2025-12-18 |
| Wolfe Research | Maintain | Outperform | 2025-12-18 |
Micron Technology’s grades predominantly indicate a positive outlook, with consistent buy, overweight, and outperform ratings maintained over recent months.
Silicon Laboratories Inc. Grades
This table summarizes the latest grades assigned by reputable grading companies for Silicon Laboratories Inc.:
| Grading Company | Action | New Grade | Date |
|---|---|---|---|
| Morgan Stanley | Maintain | Equal Weight | 2025-08-06 |
| Susquehanna | Maintain | Neutral | 2025-08-06 |
| Barclays | Maintain | Equal Weight | 2025-08-05 |
| Susquehanna | Maintain | Neutral | 2025-07-22 |
| Stifel | Maintain | Buy | 2025-07-18 |
| Keybanc | Maintain | Overweight | 2025-07-08 |
| Benchmark | Maintain | Buy | 2025-05-27 |
| Benchmark | Maintain | Buy | 2025-05-14 |
| Susquehanna | Maintain | Neutral | 2025-05-14 |
| Needham | Maintain | Buy | 2025-05-14 |
Silicon Laboratories’ grades show a mixture of buy and neutral/equal weight ratings, reflecting a more cautious but generally favorable stance.
Which company has the best grades?
Micron Technology, Inc. has received more consistently positive grades, including multiple buy, overweight, and outperform ratings, compared to Silicon Laboratories Inc., which exhibits a balanced mix of buy and neutral ratings. This suggests investors may perceive Micron as having stronger growth or performance potential, while Silicon Laboratories reflects a more moderate risk-return profile.
Strengths and Weaknesses
Below is a comparative overview of key strengths and weaknesses for Micron Technology, Inc. (MU) and Silicon Laboratories Inc. (SLAB) based on the most recent financial and operational data.
| Criterion | Micron Technology, Inc. (MU) | Silicon Laboratories Inc. (SLAB) |
|---|---|---|
| Diversification | Strong product diversification with DRAM & NAND segments and multiple business units generating billions annually. | Limited product range focused mainly on Industrial & Commercial segment, less diversified. |
| Profitability | Favorable profitability metrics: net margin 22.84%, ROE 15.76%, ROIC 12.12%, demonstrating efficient capital use. | Unfavorable profitability: net margin -32.69%, ROE -17.69%, ROIC -18.15%, indicating losses and value destruction. |
| Innovation | Growing ROIC trend suggests improving operational efficiency and innovation capacity. | Declining ROIC trend implies challenges in sustaining innovation and profitability. |
| Global presence | Large global footprint with significant market share in memory products. | Smaller scale with a niche market presence mainly in industrial and IoT sectors. |
| Market Share | Significant market share in memory chips (DRAM and NAND), leading industry position. | Smaller market share, concentrated in specialized semiconductor solutions. |
Key takeaway: Micron Technology shows strong profitability, diversification, and a growing competitive position, making it a more favorable investment option. Silicon Laboratories struggles with profitability and market breadth, posing higher investment risks.
Risk Analysis
Below is a comparison of key risks for Micron Technology, Inc. (MU) and Silicon Laboratories Inc. (SLAB) as of the most recent fiscal years:
| Metric | Micron Technology, Inc. (MU) | Silicon Laboratories Inc. (SLAB) |
|---|---|---|
| Market Risk | Beta 1.50, high volatility in semiconductor cycles | Beta 1.55, exposure to IoT market fluctuations |
| Debt Level | Low debt-to-equity (0.28), strong interest coverage | Very low debt (0.01), but negative interest coverage |
| Regulatory Risk | Moderate, US-based with global operations | Moderate, US base with significant China exposure |
| Operational Risk | Large-scale manufacturing complexity, supply chain sensitivity | Fabless model reduces capital risk, but tech dependency high |
| Environmental Risk | Standard industry compliance, moderate energy use | Lower manufacturing footprint, but growing sustainability demands |
| Geopolitical Risk | Exposure to US-China trade tensions | High exposure to international markets, including China |
Micron faces typical semiconductor market volatility and supply chain risks, but its strong financial health mitigates debt concerns. Silicon Laboratories struggles operationally with negative margins and interest coverage, making market and operational risks more impactful recently. Geopolitical tensions affecting global supply chains remain a critical risk for both.
Which Stock to Choose?
Micron Technology, Inc. (MU) shows a strong income evolution with a 48.85% revenue growth in the last year and consistent profitability, reflected in a favorable net margin of 22.84%. Financial ratios mostly favor MU, with low debt (D/E 0.28) and solid liquidity (current ratio 2.52). Its rating is very favorable, supported by a strong Altman Z-score (10.5) and a Piotroski score of 7, indicating good financial health and moderate risk.
Silicon Laboratories Inc. (SLAB) displays a challenging income trend, with a negative net margin of -32.69% and declining profitability over the last year. Although it maintains very low debt (D/E 0.01) and high liquidity (current ratio 6.15), most financial ratios are unfavorable. Its overall rating is very unfavorable, despite a safe zone Altman Z-score (15.6) and an average Piotroski score of 4, signaling potential financial instability.
Investors focused on growth and improving profitability may find MU’s favorable rating and strong income evolution appealing, while those with a higher risk tolerance seeking turnaround opportunities might consider SLAB, despite its unfavorable financial ratios and income trends. The choice could depend on the investor’s risk profile and strategy emphasis.
Disclaimer: Investment carries a risk of loss of initial capital. The past performance is not a reliable indicator of future results. Be sure to understand risks before making an investment decision.
Go Further
I encourage you to read the complete analyses of Micron Technology, Inc. and Silicon Laboratories Inc. to enhance your investment decisions: