In the fast-evolving semiconductor industry, Micron Technology, Inc. (MU) and Qnity Electronics, Inc. (Q) stand out as key players driving innovation and growth. While Micron is a well-established leader in memory and storage solutions, Qnity focuses on cutting-edge electronic materials essential for chip manufacturing. This comparison explores their market strategies and potential, helping you decide which company deserves a place in your investment portfolio.

Table of contents
Companies Overview
I will begin the comparison between Micron Technology and Qnity Electronics by providing an overview of these two companies and their main differences.
Micron Technology Overview
Micron Technology, Inc. is a leading player in the semiconductors industry, specializing in designing, manufacturing, and selling memory and storage products globally. Founded in 1978 and headquartered in Boise, Idaho, Micron operates through multiple business units covering DRAM, NAND, and NOR memory technologies. Its products serve diverse markets including cloud servers, enterprise, mobile devices, and automotive sectors.
Qnity Electronics Overview
Qnity Electronics, Inc., formerly known as Novus SpinCo 1, focuses on providing electronic solutions and materials essential for semiconductor chip manufacturing and advanced electronic materials. Based in Wilmington, Delaware, and publicly listed since October 2025, Qnity operates within the semiconductors sector, concentrating on niche components for the chip production process rather than finished memory products.
Key similarities and differences
Both companies operate in the semiconductors industry within the technology sector and are US-based. Micron Technology has a broad product portfolio with direct sales worldwide and a market cap exceeding 373B USD, while Qnity Electronics is a more recent entrant focusing on specialized materials for chip manufacturing with a market cap around 19B USD. Micron’s business model centers on finished memory products for diverse end markets, whereas Qnity targets upstream materials and solutions in the semiconductor supply chain.
Income Statement Comparison
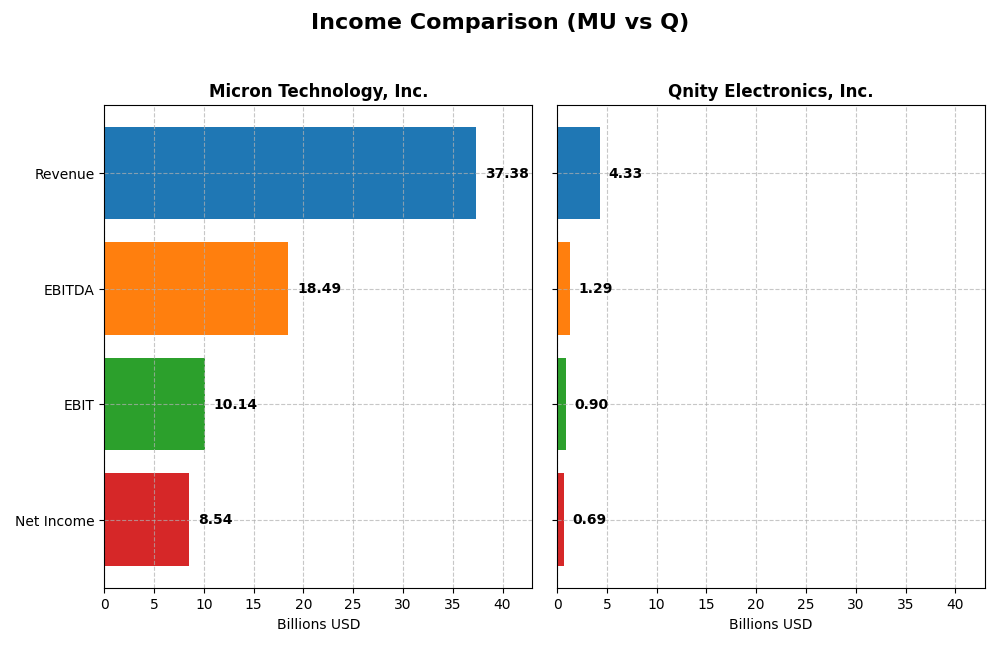
This table compares the key income statement metrics for Micron Technology, Inc. and Qnity Electronics, Inc. based on their most recent fiscal year data.
| Metric | Micron Technology, Inc. | Qnity Electronics, Inc. |
|---|---|---|
| Market Cap | 373B | 18.8B |
| Revenue | 37.4B | 4.3B |
| EBITDA | 18.5B | 1.3B |
| EBIT | 10.1B | 898M |
| Net Income | 8.5B | 693M |
| EPS | 7.65 | 3.31 |
| Fiscal Year | 2025 | 2024 |
Income Statement Interpretations
Micron Technology, Inc.
Micron Technology showed strong revenue growth from $15.5B in 2023 to $37.4B in 2025, with net income rebounding dramatically from a loss of $-5.8B in 2023 to a gain of $8.5B in 2025. Margins improved significantly, with a gross margin near 40% and net margin at 22.8% in 2025. The latest year saw exceptional profitability growth and margin expansion.
Qnity Electronics, Inc.
Qnity Electronics experienced moderate revenue growth, increasing from $4.0B in 2023 to $4.3B in 2024, with net income rising from $507M to $693M. Gross and EBIT margins were healthy, at 46.1% and 20.7% respectively in 2024, while net margin improved to 16%. However, its overall period revenue and net income trends were slightly unfavorable, reflecting some volatility.
Which one has the stronger fundamentals?
Micron Technology presents stronger fundamentals with robust revenue and net income growth, favorable margin improvements, and low interest expense ratios. Qnity Electronics shows positive short-term margin trends but weaker overall growth and a higher relative interest expense. Micron’s sustained profitability and margin expansion suggest a more resilient income statement profile.
Financial Ratios Comparison
The table below presents a selection of key financial ratios for Micron Technology, Inc. (MU) and Qnity Electronics, Inc. (Q) based on their most recent fiscal year data, enabling a straightforward comparison.
| Ratios | Micron Technology, Inc. (MU) FY 2025 | Qnity Electronics, Inc. (Q) FY 2024 |
|---|---|---|
| ROE | 15.76% | 6.51% |
| ROIC | 12.12% | 5.92% |
| P/E | 15.94 | 28.80 |
| P/B | 2.51 | 1.88 |
| Current Ratio | 2.52 | 1.77 |
| Quick Ratio | 1.79 | 1.06 |
| D/E (Debt-to-Equity) | 0.28 | 0.02 |
| Debt-to-Assets | 18.45% | 1.56% |
| Interest Coverage | 20.69 | 3.03 |
| Asset Turnover | 0.45 | 0.35 |
| Fixed Asset Turnover | 0.79 | 2.59 |
| Payout Ratio | 6.11% | 0% |
| Dividend Yield | 0.38% | 0% |
Interpretation of the Ratios
Micron Technology, Inc.
Micron Technology displays mostly strong financial ratios, including a favorable net margin of 22.84% and return on equity at 15.76%, indicating solid profitability and efficient capital use. However, its weighted average cost of capital (WACC) is unfavorable at 10.52%, and asset turnover ratios are weak. The company pays a modest dividend with a 0.38% yield, reflecting a cautious payout amid some operational challenges.
Qnity Electronics, Inc.
Qnity Electronics shows mixed ratios, with a favorable net margin of 15.99% but a weak return on equity of 6.51%. Its WACC is low and favorable at 5.79%, supporting capital efficiency, though the price-to-earnings ratio is high and unfavorable at 28.8. The firm does not pay dividends, likely due to a reinvestment strategy and growth focus, with no share repurchase programs noted.
Which one has the best ratios?
Micron Technology presents a more favorable overall ratio profile, with 57.14% favorable metrics versus Qnity’s 42.86%. Despite some weaknesses in turnover and dividend yield, Micron’s profitability and capital structure metrics are stronger. Qnity faces challenges with profitability returns and valuation, though it benefits from lower WACC and a conservative debt profile.
Strategic Positioning
This section compares the strategic positioning of Micron Technology, Inc. and Qnity Electronics, Inc., including their market position, key segments, and exposure to technological disruption:
Micron Technology, Inc.
- Leading semiconductor firm with $373B market cap, facing high competitive pressure.
- Diverse segments: DRAM, NAND, Compute, Mobile, Storage, Embedded driving revenues.
- Exposed to semiconductor tech advances through memory and storage innovation.
Qnity Electronics, Inc.
- Smaller semiconductor materials provider with $18.8B market cap, less competitive pressure.
- Focused on electronic solutions and materials for semiconductor chip manufacturing.
- Exposure limited to advanced electronic materials in semiconductor manufacturing.
Micron Technology vs Qnity Electronics Positioning
Micron pursues a diversified business model across multiple memory and storage segments, supporting broader market exposure but facing intense competition. Qnity focuses narrowly on semiconductor materials, potentially reducing diversification but specializing in a niche area.
Which has the best competitive advantage?
Both companies currently lack strong competitive moats; Micron shows slightly favorable growing profitability, while Qnity maintains stable but neutral profitability without clear value creation.
Stock Comparison
The stock price movements of Micron Technology, Inc. (MU) and Qnity Electronics, Inc. (Q) over the past 12 months reveal contrasting dynamics, with MU showing strong upward momentum and Q experiencing a modest decline.

Trend Analysis
Micron Technology, Inc. (MU) exhibited a bullish trend over the past year, with a 287.62% price increase and accelerating momentum. The stock reached a high of 345.09 and demonstrated significant volatility, with a standard deviation of 57.56.
Qnity Electronics, Inc. (Q) showed a bearish trend over the same period, with a 5.39% price decline and stable acceleration. The stock price fluctuated within a narrower range, hitting a high of 95.0, and showed lower volatility, reflected in a 5.64 standard deviation.
Comparing both stocks, Micron Technology delivered substantially higher market performance than Qnity Electronics, driven by strong buyer dominance and accelerating price gains over the past year.
Target Prices
The current analyst consensus shows a positive outlook for both Micron Technology, Inc. and Qnity Electronics, Inc.
| Company | Target High | Target Low | Consensus |
|---|---|---|---|
| Micron Technology, Inc. | 450 | 190 | 328.22 |
| Qnity Electronics, Inc. | 117 | 92 | 105.89 |
Analysts expect Micron’s price to remain near current levels, with upside potential versus the present 333.35 USD stock price. Qnity’s targets suggest a significant upside from its current 89.88 USD price, indicating bullish sentiment.
Analyst Opinions Comparison
This section compares analysts’ ratings and grades for Micron Technology, Inc. (MU) and Qnity Electronics, Inc. (Q):
Rating Comparison
MU Rating
- Rating: B, evaluated as Very Favorable by analysts.
- Discounted Cash Flow Score: 1, considered Very Unfavorable.
- ROE Score: 4, rated Favorable for profit generation.
- ROA Score: 5, considered Very Favorable for asset use.
- Debt To Equity Score: 3, marked Moderate for financial risk.
- Overall Score: 3, Moderate overall financial standing.
Q Rating
- Rating: B+, also Very Favorable according to analysts.
- Discounted Cash Flow Score: 4, considered Favorable.
- ROE Score: 3, rated Moderate in profit efficiency.
- ROA Score: 4, rated Favorable for asset utilization.
- Debt To Equity Score: 3, also Moderate for financial risk.
- Overall Score: 3, Moderate overall financial standing.
Which one is the best rated?
Based strictly on the provided data, Q holds a higher rating (B+) and a favorable discounted cash flow score, while MU has stronger ROE and ROA scores. Both share the same overall and debt-to-equity scores, with Q being slightly better rated overall.
Scores Comparison
Here is a comparison of the financial scores for Micron Technology, Inc. and Qnity Electronics, Inc.:
MU Scores
- Altman Z-Score: 10.5, indicating a safe zone with low bankruptcy risk.
- Piotroski Score: 7, considered strong financial health.
Q Scores
- No data available for Altman Z-Score.
- No data available for Piotroski Score.
Which company has the best scores?
Based on the available data, Micron Technology has clearly defined and strong financial scores, while Qnity Electronics lacks any provided score data for comparison. Therefore, only Micron’s scores can be evaluated.
Grades Comparison
Here is a comparison of the latest grades issued by recognized grading companies for both Micron Technology, Inc. and Qnity Electronics, Inc.:
Micron Technology, Inc. Grades
The following table summarizes recent grades from reputable financial institutions for Micron Technology, Inc.:
| Grading Company | Action | New Grade | Date |
|---|---|---|---|
| Keybanc | Maintain | Overweight | 2026-01-13 |
| B of A Securities | Maintain | Buy | 2026-01-13 |
| Lynx Global | Maintain | Buy | 2026-01-12 |
| Mizuho | Maintain | Outperform | 2026-01-09 |
| UBS | Maintain | Buy | 2026-01-07 |
| Piper Sandler | Maintain | Overweight | 2026-01-07 |
| Piper Sandler | Maintain | Overweight | 2025-12-18 |
| Barclays | Maintain | Overweight | 2025-12-18 |
| Keybanc | Maintain | Overweight | 2025-12-18 |
| Wolfe Research | Maintain | Outperform | 2025-12-18 |
Overall, Micron Technology maintains a consistently positive outlook, with multiple firms rating it as Buy, Overweight, or Outperform, indicating confidence in the stock’s potential.
Qnity Electronics, Inc. Grades
The following table shows the recent grades from recognized grading companies for Qnity Electronics, Inc.:
| Grading Company | Action | New Grade | Date |
|---|---|---|---|
| RBC Capital | Maintain | Outperform | 2025-11-25 |
| Mizuho | Maintain | Outperform | 2025-11-20 |
Qnity Electronics has fewer grades available but both are positive, with Outperform ratings maintained by RBC Capital and Mizuho.
Which company has the best grades?
Micron Technology, Inc. has received a broader and more frequent range of positive grades, mostly Buy, Overweight, and Outperform, from several reputable firms, suggesting stronger analyst conviction. Qnity Electronics, Inc. has positive but limited coverage, which may imply higher uncertainty or less analyst focus for investors.
Strengths and Weaknesses
Below is a comparative overview of key strengths and weaknesses for Micron Technology, Inc. (MU) and Qnity Electronics, Inc. (Q) based on recent financial and strategic data.
| Criterion | Micron Technology, Inc. (MU) | Qnity Electronics, Inc. (Q) |
|---|---|---|
| Diversification | Strong product diversification: DRAM $28.6B, NAND $8.5B (2025) | Limited product data, less diversified |
| Profitability | High net margin 22.84%, ROE 15.76%, ROIC 12.12% (2025) | Moderate net margin 15.99%, low ROE 6.51%, neutral ROIC 5.92% (2024) |
| Innovation | Growing ROIC trend (+8.2%), signaling improving profitability and potential innovation | Stable ROIC, no growth trend, indicating limited innovation impact |
| Global presence | Large global footprint implied by broad product segments and revenues | Smaller scale, less evidence of broad global presence |
| Market Share | Leading semiconductor memory market player with large DRAM and NAND sales | Smaller player with uncertain market share |
Key takeaways: Micron Technology demonstrates strong profitability, product diversification, and a positive innovation trajectory, though its market is competitive. Qnity Electronics shows stable but modest profitability and lacks clear competitive advantages. Investors should weigh MU’s growth and scale against Q’s stability and smaller footprint.
Risk Analysis
Below is a comparative table of key risks for Micron Technology, Inc. (MU) and Qnity Electronics, Inc. (Q) based on the most recent data available:
| Metric | Micron Technology, Inc. (MU) | Qnity Electronics, Inc. (Q) |
|---|---|---|
| Market Risk | High beta (1.503) indicates elevated volatility sensitivity | Beta data unavailable; IPO in 2025 suggests market exposure uncertainty |
| Debt level | Low debt-to-equity ratio (0.28), favorable leverage | Very low debt-to-equity (0.02), low financial risk |
| Regulatory Risk | Moderate, semiconductor industry faces ongoing regulatory scrutiny | Moderate, as a new entrant in semiconductor materials, regulatory environment evolving |
| Operational Risk | Moderate; large-scale manufacturing complexity with 48K employees | Higher uncertainty due to smaller size and recent market entry |
| Environmental Risk | Moderate; semiconductor production involves hazardous materials | Moderate; electronic materials manufacturing also entails environmental considerations |
| Geopolitical Risk | Elevated, given global supply chain dependencies and trade tensions | Elevated, similar exposure due to semiconductor sector dynamics |
The most impactful risks for investors include Micron’s market volatility and geopolitical exposure, which could affect supply chains and costs amid global tensions. Qnity, as a recent IPO and smaller player, carries higher operational uncertainty and market risk due to limited track record. Both companies face moderate regulatory and environmental risks inherent to semiconductors, but their low debt levels support financial resilience.
Which Stock to Choose?
Micron Technology, Inc. (MU) shows a strong income evolution with a 48.85% revenue growth in 2025 and consistently favorable profitability metrics, including a 22.84% net margin and 15.76% ROE. Its debt levels remain manageable with a net debt to EBITDA of 0.30, supported by a very favorable rating of B and solid liquidity ratios.
Qnity Electronics, Inc. (Q) displays moderate income growth, with a 7.43% revenue increase in 2024 and a 15.99% net margin. However, profitability ratios such as ROE at 6.51% are less favorable. The company maintains very low debt with a net debt to EBITDA of 0.02 and holds a very favorable B+ rating, though its overall financial ratios are slightly less strong compared to MU.
Investors focused on growth and higher profitability might see MU’s strong income and favorable financial ratios as more appealing, while those prioritizing stability with lower debt and consistent, though moderate, profitability could find Q’s profile more suitable. The differing MOAT evaluations—with MU’s slightly favorable and Q’s neutral moat status—might further inform risk tolerance considerations.
Disclaimer: Investment carries a risk of loss of initial capital. The past performance is not a reliable indicator of future results. Be sure to understand risks before making an investment decision.
Go Further
I encourage you to read the complete analyses of Micron Technology, Inc. and Qnity Electronics, Inc. to enhance your investment decisions: