Micron Technology, Inc. and Onto Innovation Inc. are two key players in the semiconductor industry, each driving innovation in memory solutions and process control technologies respectively. While Micron focuses on advanced memory and storage products, Onto excels in precision metrology and analytical software for semiconductor manufacturing. This comparison highlights their market overlap and innovation strategies, helping you decide which company presents the most compelling investment opportunity today.
Table of contents
Companies Overview
I will begin the comparison between Micron Technology, Inc. and Onto Innovation Inc. by providing an overview of these two companies and their main differences.
Micron Technology, Inc. Overview
Micron Technology, Inc. is a global leader in the design, manufacture, and sale of memory and storage products. Founded in 1978 and headquartered in Boise, Idaho, Micron operates through four main segments, offering DRAM, NAND, and NOR memory products for diverse markets including cloud servers, enterprise, client, automotive, and mobile devices. The company markets its products via direct sales, distributors, and online channels.
Onto Innovation Inc. Overview
Onto Innovation Inc., established in 1940 and based in Wilmington, Massachusetts, specializes in process control tools for semiconductor manufacturing. Its offerings include macro defect inspection, optical metrology, lithography systems, and process control software. Serving semiconductor and advanced packaging manufacturers, Onto supports device packaging, testing, and yield management across multiple high-tech applications globally.
Key similarities and differences
Both companies operate in the semiconductor industry within the technology sector and are based in the US. Micron focuses on memory and storage semiconductor products, while Onto Innovation provides process control tools and software for semiconductor manufacturing. Micron is considerably larger in scale with 48K employees and a market cap of $373B, compared to Onto’s 1.5K employees and $9.9B market cap, reflecting their differing business scopes and market positions.
Income Statement Comparison
This table presents a side-by-side comparison of key income statement metrics for Micron Technology, Inc. and Onto Innovation Inc. for their most recent fiscal years.

| Metric | Micron Technology, Inc. (MU) | Onto Innovation Inc. (ONTO) |
|---|---|---|
| Market Cap | 373B | 9.9B |
| Revenue | 37.4B | 987M |
| EBITDA | 18.5B | 249M |
| EBIT | 10.1B | 187M |
| Net Income | 8.54B | 202M |
| EPS | 7.65 | 4.09 |
| Fiscal Year | 2025 | 2024 |
Income Statement Interpretations
Micron Technology, Inc.
Micron Technology experienced strong revenue growth from $15.5B in 2023 to $37.4B in 2025, alongside a significant net income recovery from a loss of $-5.8B in 2023 to $8.5B in 2025. Margins improved notably, with a gross margin of 39.79% and net margin at 22.84% in 2025. The recent year showed accelerated earnings growth and margin expansion, signaling operational strength.
Onto Innovation Inc.
Onto Innovation’s revenue rose steadily from $557M in 2020 to $987M in 2024, with net income increasing remarkably from $31M to $202M over the same period. The company maintained favorable margins, including a strong 52.19% gross margin and a 20.43% net margin in 2024. Recent growth was consistent and accompanied by an improvement in profitability metrics, reflecting solid operational efficiency.
Which one has the stronger fundamentals?
Both companies demonstrate favorable income statement trends, with Micron showing higher absolute revenue and net income, alongside impressive margin recoveries after a challenging year. Onto Innovation exhibits robust percentage growth in net income and margins over a shorter period, supported by consistent profitability. The choice of stronger fundamentals depends on scale preference versus growth intensity and margin stability.
Financial Ratios Comparison
The table below presents a side-by-side comparison of key financial ratios for Micron Technology, Inc. (MU) and Onto Innovation Inc. (ONTO) based on their most recent fiscal year data.
| Ratios | Micron Technology, Inc. (2025) | Onto Innovation Inc. (2024) |
|---|---|---|
| ROE | 15.8% | 10.5% |
| ROIC | 12.1% | 8.8% |
| P/E | 15.9 | 41.8 |
| P/B | 2.51 | 4.37 |
| Current Ratio | 2.52 | 8.69 |
| Quick Ratio | 1.79 | 7.00 |
| D/E | 0.28 | 0.008 |
| Debt-to-Assets | 18.5% | 0.7% |
| Interest Coverage | 20.7 | 0 |
| Asset Turnover | 0.45 | 0.47 |
| Fixed Asset Turnover | 0.79 | 7.16 |
| Payout ratio | 6.1% | 0% |
| Dividend yield | 0.38% | 0% |
Interpretation of the Ratios
Micron Technology, Inc.
Micron Technology shows generally strong financial ratios with favorable net margin at 22.84%, ROE at 15.76%, and ROIC at 12.12%, indicating efficient profitability and capital use. Some concerns arise from an unfavorable WACC of 10.52% and weak asset turnover ratios. The company pays dividends with a low yield of 0.38%, suggesting modest shareholder returns with cautious payout sustainability.
Onto Innovation Inc.
Onto Innovation presents mixed ratios: a favorable net margin of 20.43% but neutral ROE and ROIC, indicating moderate profitability. The high P/E of 41.76 and P/B of 4.37 are unfavorable, reflecting potentially stretched valuations. It does not pay dividends, focusing instead on reinvestment and R&D, aligning with its high current and quick ratios and very low debt, supporting growth priorities.
Which one has the best ratios?
Micron Technology offers a more favorable overall ratio profile, with 57.14% favorable metrics compared to Onto Innovation’s 42.86%. Despite some asset efficiency weaknesses, Micron’s profitability and capital structure metrics are stronger. Onto’s high valuation multiples and lack of dividends balance its solid liquidity and low leverage, resulting in a neutral global ratio opinion.
Strategic Positioning
This section compares the strategic positioning of Micron Technology, Inc. and Onto Innovation Inc. regarding market position, key segments, and exposure to technological disruption:
Micron Technology, Inc.
- Large market cap of $373B, operating in a highly competitive semiconductor sector.
- Diverse segments including memory/storage products: DRAM, NAND, embedded units.
- Exposure tied to semiconductor memory tech; innovation critical to maintain edge.
Onto Innovation Inc.
- Smaller market cap of $9.9B, competing in the semiconductor process control tools industry.
- Focused on process control tools, lithography, analytical software, and testing for semiconductor makers.
- Faces disruption from advances in optical metrology, lithography, and process control software.
Micron Technology, Inc. vs Onto Innovation Inc. Positioning
Micron pursues a diversified semiconductor memory and storage product strategy, benefiting from broad market applications but facing intense competition. Onto concentrates on niche process control and inspection tools, providing specialized solutions but with narrower market scope.
Which has the best competitive advantage?
Micron shows a slightly favorable moat with growing ROIC above WACC, indicating improving value creation. Onto has a slightly unfavorable moat despite rising ROIC, suggesting it currently destroys value but may improve profitability over time.
Stock Comparison
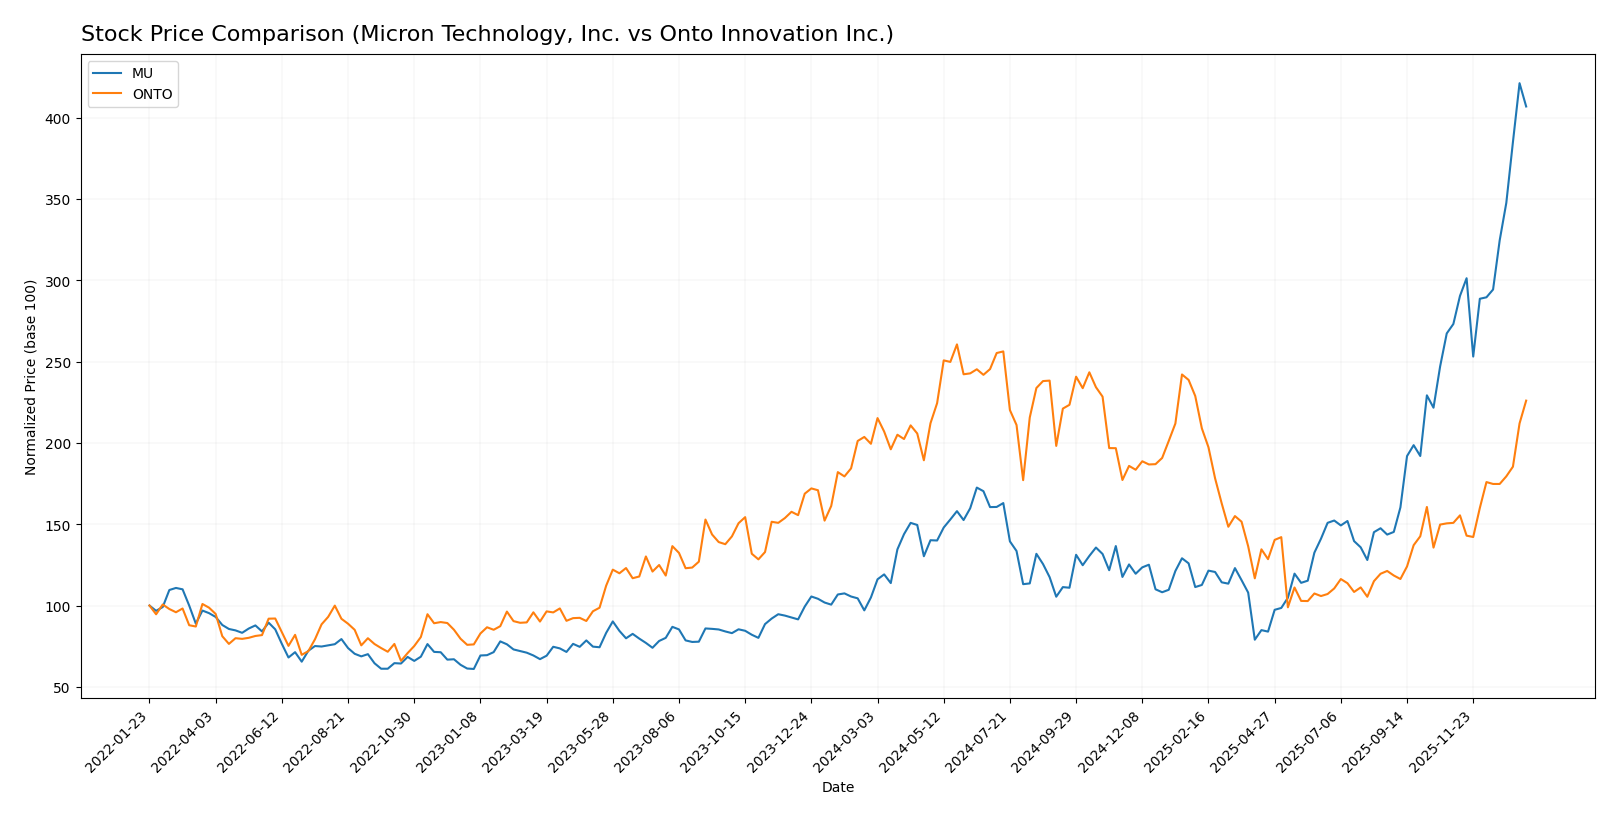
The stock prices of Micron Technology, Inc. and Onto Innovation Inc. have exhibited significant bullish momentum over the past year, with both showing acceleration in their upward trends and notable price gains.
Trend Analysis
Micron Technology, Inc. (MU) experienced a strong bullish trend with a price increase of 287.62% over the past 12 months, accompanied by acceleration and high volatility (std deviation 57.56). The stock reached a high of 345.09 and a low of 64.72.
Onto Innovation Inc. (ONTO) also showed a bullish trend, gaining 13.31% over the same period with acceleration and moderate volatility (std deviation 42.43). Its highest price was 233.14, with a low of 88.5.
Comparing both, Micron Technology delivered the highest market performance with a substantially larger price increase than Onto Innovation, reflecting stronger bullish momentum and greater price appreciation.
Target Prices
The current analyst consensus presents a balanced outlook for these semiconductor companies.
| Company | Target High | Target Low | Consensus |
|---|---|---|---|
| Micron Technology, Inc. | 450 | 190 | 328.22 |
| Onto Innovation Inc. | 200 | 160 | 178 |
Analysts expect Micron’s price to hover near the current $333, indicating moderate upside potential, while Onto Innovation’s consensus target is below its current $202, suggesting a possible correction or consolidation.
Analyst Opinions Comparison
This section compares analysts’ ratings and grades for Micron Technology, Inc. (MU) and Onto Innovation Inc. (ONTO):
Rating Comparison
MU Rating
- Rating: B, considered Very Favorable overall.
- Discounted Cash Flow Score: 1, rated Very Unfavorable indicating potential overvaluation concerns.
- ROE Score: 4, Favorable rating showing efficient profit generation from equity.
- ROA Score: 5, Very Favorable rating reflecting excellent asset utilization to generate earnings.
- Debt To Equity Score: 3, Moderate rating showing balanced financial risk.
- Overall Score: 3, Moderate indicating average financial standing.
ONTO Rating
- Rating: B+, considered Very Favorable overall.
- Discounted Cash Flow Score: 3, Moderate rating suggesting a more balanced valuation outlook.
- ROE Score: 3, Moderate rating indicating average efficiency in generating equity returns.
- ROA Score: 4, Favorable rating indicating good asset efficiency.
- Debt To Equity Score: 4, Favorable rating indicating relatively lower financial risk due to debt management.
- Overall Score: 3, Moderate indicating average financial standing.
Which one is the best rated?
Based on the provided data, ONTO holds a higher overall rating (B+) compared to MU’s B rating. ONTO scores better in discounted cash flow and debt-to-equity metrics, while MU excels in return on equity and assets. Overall, ONTO is slightly better rated.
Scores Comparison
Here is a comparison of the Altman Z-Score and Piotroski Score for Micron Technology and Onto Innovation:
Micron Technology Scores
- Altman Z-Score: 10.5, indicating a safe zone with low bankruptcy risk.
- Piotroski Score: 7, showing strong financial health and value potential.
Onto Innovation Scores
- Altman Z-Score: 34.2, indicating a safe zone with very low bankruptcy risk.
- Piotroski Score: 4, reflecting average financial strength and value.
Which company has the best scores?
Both companies are in the safe zone for bankruptcy risk with high Altman Z-Scores, but Onto Innovation’s score is substantially higher. Micron Technology has a stronger Piotroski Score, indicating better financial health compared to Onto Innovation’s average rating.
Grades Comparison
The following presents a comparison of the recent grades assigned to Micron Technology, Inc. and Onto Innovation Inc.:
Micron Technology, Inc. Grades
This table summarizes recent grades from established grading companies for Micron Technology, Inc.
| Grading Company | Action | New Grade | Date |
|---|---|---|---|
| Keybanc | Maintain | Overweight | 2026-01-13 |
| B of A Securities | Maintain | Buy | 2026-01-13 |
| Lynx Global | Maintain | Buy | 2026-01-12 |
| Mizuho | Maintain | Outperform | 2026-01-09 |
| UBS | Maintain | Buy | 2026-01-07 |
| Piper Sandler | Maintain | Overweight | 2026-01-07 |
| Piper Sandler | Maintain | Overweight | 2025-12-18 |
| Barclays | Maintain | Overweight | 2025-12-18 |
| Keybanc | Maintain | Overweight | 2025-12-18 |
| Wolfe Research | Maintain | Outperform | 2025-12-18 |
Micron Technology consistently maintains positive grades, predominantly “Buy,” “Overweight,” and “Outperform,” indicating stable analyst confidence.
Onto Innovation Inc. Grades
This table summarizes recent grades from established grading companies for Onto Innovation Inc.
| Grading Company | Action | New Grade | Date |
|---|---|---|---|
| Needham | Maintain | Buy | 2026-01-06 |
| Jefferies | Maintain | Buy | 2025-12-15 |
| Needham | Maintain | Buy | 2025-11-18 |
| B. Riley Securities | Maintain | Buy | 2025-11-18 |
| Evercore ISI Group | Maintain | Outperform | 2025-11-05 |
| Oppenheimer | Maintain | Outperform | 2025-10-14 |
| Stifel | Maintain | Hold | 2025-10-13 |
| B. Riley Securities | Maintain | Buy | 2025-10-10 |
| Jefferies | Upgrade | Buy | 2025-09-23 |
| Benchmark | Maintain | Buy | 2025-08-08 |
Onto Innovation shows a predominantly positive grading trend with multiple “Buy” and “Outperform” ratings, alongside a few “Hold” grades, reflecting generally favorable analyst views.
Which company has the best grades?
Both companies have a consensus “Buy” rating from analysts, but Micron Technology shows a stronger predominance of “Overweight” and “Outperform” grades, while Onto Innovation has a mix including some “Hold” ratings. This suggests Micron’s grades are slightly more consistently optimistic, which could influence investor sentiment toward greater confidence in its near-term prospects.
Strengths and Weaknesses
Below is a comparison table highlighting the key strengths and weaknesses of Micron Technology, Inc. (MU) and Onto Innovation Inc. (ONTO) based on their recent financial and strategic data.
| Criterion | Micron Technology, Inc. (MU) | Onto Innovation Inc. (ONTO) |
|---|---|---|
| Diversification | High product diversification across DRAM and NAND segments with strong revenue streams (DRAM $28.6B, NAND $8.5B in 2025) | Moderate diversification focused on systems, software, parts, and services; heavy reliance on Systems and Software revenue ($850M in 2024) |
| Profitability | Favorable net margin (22.8%), ROE (15.8%), and ROIC (12.1%); overall favorable financial ratios | Favorable net margin (20.4%) but neutral ROE (10.5%) and ROIC (8.8%); mixed financial ratios with some unfavorable liquidity ratios |
| Innovation | Ongoing growth in ROIC suggests improving capital efficiency but no strong moat yet (Slightly Favorable) | Rapid ROIC growth but overall value destruction (Slightly Unfavorable); innovation improving but not yet profitable |
| Global presence | Strong global market presence supported by large scale memory products and multiple business units | Smaller scale with specialized technology segments; less global scale compared to MU |
| Market Share | Large market share in memory markets (DRAM and NAND) with consistent revenue growth | Niche market player with growing product segments but smaller footprint and market share |
Key takeaways: Micron Technology stands out with strong diversification and profitability, supported by growing efficiency and global scale. Onto Innovation shows promising innovation and ROIC growth but has challenges in profitability and market reach, warranting cautious investment consideration.
Risk Analysis
Below is a comparative overview of key risks for Micron Technology, Inc. (MU) and Onto Innovation Inc. (ONTO) based on the most recent data.
| Metric | Micron Technology, Inc. (MU) | Onto Innovation Inc. (ONTO) |
|---|---|---|
| Market Risk | High beta (1.503) indicates notable market volatility exposure. | High beta (1.461) suggests similar market sensitivity. |
| Debt level | Moderate debt-to-equity ratio (0.28), low debt-to-assets (18.45%). | Minimal debt (debt-to-equity 0.01; debt-to-assets 0.72%). |
| Regulatory Risk | Semiconductor industry faces ongoing regulatory scrutiny globally. | Same industry risks, plus added scrutiny on advanced process control tools. |
| Operational Risk | Large-scale manufacturing complexity; supply chain disruptions possible. | Smaller scale but dependent on tech innovation and manufacturing precision. |
| Environmental Risk | Semiconductor manufacturing has significant environmental footprint. | Similar environmental concerns due to manufacturing processes. |
| Geopolitical Risk | Exposure to US-China trade tensions affecting supply chains and sales. | Also exposed to geopolitical tensions impacting semiconductor sector globally. |
The most impactful risks for both companies center on market volatility and geopolitical tensions, especially US-China relations impacting supply chains. Micron carries moderate debt but benefits from strong financial health, while Onto Innovation’s low debt reduces financial risk but it faces challenges in scaling operations and maintaining innovation leadership. Investors should weigh these factors carefully with their risk tolerance.
Which Stock to Choose?
Micron Technology, Inc. (MU) shows a favorable income evolution with strong revenue and profit growth, supported by advantageous financial ratios such as a 22.84% net margin and 15.76% ROE. Its debt levels are manageable, with a net debt to EBITDA of 0.30, and the company holds a very favorable B rating overall.
Onto Innovation Inc. (ONTO) also demonstrates favorable income growth, particularly in net income and margins, with a 20.43% net margin. Financial ratios are mixed: while debt metrics are excellent, valuation multiples and current ratio appear less favorable. ONTO holds a strong B+ rating but with a neutral global ratios opinion.
For investors prioritizing consistent profitability and strong financial fundamentals, MU’s very favorable rating and solid income growth might appear more attractive. Conversely, investors valuing rapid growth and low debt may find ONTO’s profile appealing despite its neutral ratios status. The choice could depend on whether one leans toward quality and stability or growth potential.
Disclaimer: Investment carries a risk of loss of initial capital. The past performance is not a reliable indicator of future results. Be sure to understand risks before making an investment decision.
Go Further
I encourage you to read the complete analyses of Micron Technology, Inc. and Onto Innovation Inc. to enhance your investment decisions: