Micron Technology, Inc. (MU) and ON Semiconductor Corporation (ON) are two prominent players in the semiconductor industry, each driving innovation in memory storage and intelligent power solutions respectively. Both companies address critical technology needs that overlap in sectors like automotive and industrial applications. This comparison aims to help investors understand which company offers the most compelling opportunity in a dynamic market. Let’s explore their strengths to identify the best fit for your portfolio.

Table of contents
Companies Overview
I will begin the comparison between Micron Technology, Inc. and ON Semiconductor Corporation by providing an overview of these two companies and their main differences.
Micron Technology, Inc. Overview
Micron Technology, Inc. designs, manufactures, and sells memory and storage products globally. Its product portfolio includes DRAM, NAND, and NOR memory devices used in cloud servers, enterprise, mobile, automotive, and consumer markets. Founded in 1978 and headquartered in Boise, Idaho, Micron operates through four business segments and markets its products via direct sales, distributors, and web channels, positioning itself as a key player in the semiconductor memory industry.
ON Semiconductor Corporation Overview
ON Semiconductor Corporation provides intelligent sensing and power solutions worldwide, focusing on electrification of automotive and sustainable energy sectors. It offers a broad range of analog, discrete, and integrated semiconductor products for power switching, signal processing, and imaging applications. Founded in 1992 and based in Scottsdale, Arizona, ON Semiconductor serves diverse markets through three business segments, emphasizing power efficiency and advanced sensing technologies.
Key similarities and differences
Both companies operate in the semiconductor industry and serve multiple end markets globally. Micron specializes in memory and storage technologies, while ON Semiconductor focuses on power management and sensing solutions. Micron has a larger market capitalization and workforce, reflecting its scale in memory products, whereas ON emphasizes power and analog semiconductor applications, targeting automotive electrification and sustainable energy systems.
Income Statement Comparison
This table compares the most recent fiscal year income statement metrics for Micron Technology, Inc. and ON Semiconductor Corporation, providing a snapshot of their financial performance.

| Metric | Micron Technology, Inc. | ON Semiconductor Corporation |
|---|---|---|
| Market Cap | 373B | 25B |
| Revenue | 37.4B | 7.1B |
| EBITDA | 18.5B | 2.5B |
| EBIT | 10.1B | 1.9B |
| Net Income | 8.5B | 1.6B |
| EPS | 7.65 | 3.68 |
| Fiscal Year | 2025 | 2024 |
Income Statement Interpretations
Micron Technology, Inc.
Micron Technology’s revenue rose significantly from $15.5B in 2023 to $37.4B in 2025, with net income recovering from a -$5.8B loss in 2023 to $8.5B in 2025. Margins improved notably, with a gross margin near 40% and net margin at 22.8% in 2025. The latest year showed strong growth in revenue and profitability, reflecting robust operational performance.
ON Semiconductor Corporation
ON Semiconductor’s revenue peaked at $8.3B in 2022 but declined to $7.1B in 2024, with net income falling from $2.2B in 2023 to $1.57B in 2024. Margins remain stable, with a gross margin around 45.4% and net margin about 22.2% in 2024. The recent year exhibited a contraction in revenue and earnings, signaling a slowdown in growth and profitability.
Which one has the stronger fundamentals?
Micron Technology demonstrates stronger fundamentals with consistent revenue and net income growth, alongside improved margins and favorable one-year and overall growth metrics. ON Semiconductor, despite solid margins, faces recent declines in revenue and earnings, with mixed growth signals. Micron’s financial trends suggest more robust operational momentum in the current fiscal environment.
Financial Ratios Comparison
The table below compares the most recent key financial ratios for Micron Technology, Inc. (MU) and ON Semiconductor Corporation (ON) based on their fiscal year 2025 and 2024 results respectively.
| Ratios | Micron Technology, Inc. (2025) | ON Semiconductor Corporation (2024) |
|---|---|---|
| ROE | 15.8% | 17.9% |
| ROIC | 12.1% | 11.9% |
| P/E | 15.9 | 17.1 |
| P/B | 2.51 | 3.06 |
| Current Ratio | 2.52 | 5.06 |
| Quick Ratio | 1.79 | 3.38 |
| D/E (Debt to Equity) | 0.28 | 0.38 |
| Debt-to-Assets | 18.5% | 23.9% |
| Interest Coverage | 20.7 | 28.4 |
| Asset Turnover | 0.45 | 0.50 |
| Fixed Asset Turnover | 0.79 | 1.61 |
| Payout Ratio | 6.1% | 0% |
| Dividend Yield | 0.38% | 0% |
Interpretation of the Ratios
Micron Technology, Inc.
Micron Technology shows a majority of favorable financial ratios, including strong net margin at 22.84% and return on equity at 15.76%, reflecting solid profitability and efficient capital use. However, the weighted average cost of capital (WACC) and asset turnover ratios are less favorable, indicating some operational efficiency concerns. The company pays a dividend, but its low yield of 0.38% and payout may pose risks if free cash flow coverage weakens.
ON Semiconductor Corporation
ON Semiconductor presents mostly favorable ratios with a net margin of 22.21% and a higher return on equity of 17.88%, suggesting robust profitability and shareholder value generation. Some caution is warranted due to an unfavorable price-to-book ratio at 3.06 and a very high current ratio of 5.06, which could imply inefficient asset use. The company does not pay dividends, likely prioritizing reinvestment and growth, which aligns with its strategic focus.
Which one has the best ratios?
Micron Technology demonstrates a more favorable overall ratio profile, with 57.14% favorable ratios compared to ON Semiconductor’s 50%, despite some operational efficiency drawbacks. ON Semiconductor’s slightly favorable rating reflects strengths in profitability but offset by asset utilization and liquidity concerns. Both companies maintain solid profitability, but Micron’s balanced financial metrics give it a slight edge in ratio quality.
Strategic Positioning
This section compares the strategic positioning of Micron Technology, Inc. and ON Semiconductor Corporation in terms of Market position, Key segments, and Exposure to technological disruption:
Micron Technology, Inc.
- Large market cap of 373B in semiconductors with strong NASDAQ presence; faces competitive pressure from memory product rivals.
- Diversified segments: DRAM, NAND, embedded, mobile, storage; key drivers include cloud, enterprise, automotive, and consumer markets.
- Exposure to disruption through memory technology innovation and evolving cloud and mobile demands in semiconductor memory.
ON Semiconductor Corporation
- Smaller market cap of 25B in semiconductors; competes in power and sensing markets with growing competitive intensity.
- Focused on power solutions, analog products, and intelligent sensing; key drivers are automotive electrification and sustainable energy.
- Faces disruption from advances in power electronics and image sensing technologies impacting automotive and industrial sectors.
Micron Technology, Inc. vs ON Semiconductor Corporation Positioning
Micron has a diversified approach across multiple memory and storage segments, benefiting from broad market exposure but facing intense competition. ON Semiconductor concentrates on power and sensing solutions, gaining from niche automotive and sustainable energy trends but with narrower segment diversity.
Which has the best competitive advantage?
Both companies show a slightly favorable moat with growing ROIC trends but currently shed value relative to WACC. Their competitive advantages are emerging rather than established, with improving profitability but no clear long-term dominance.
Stock Comparison
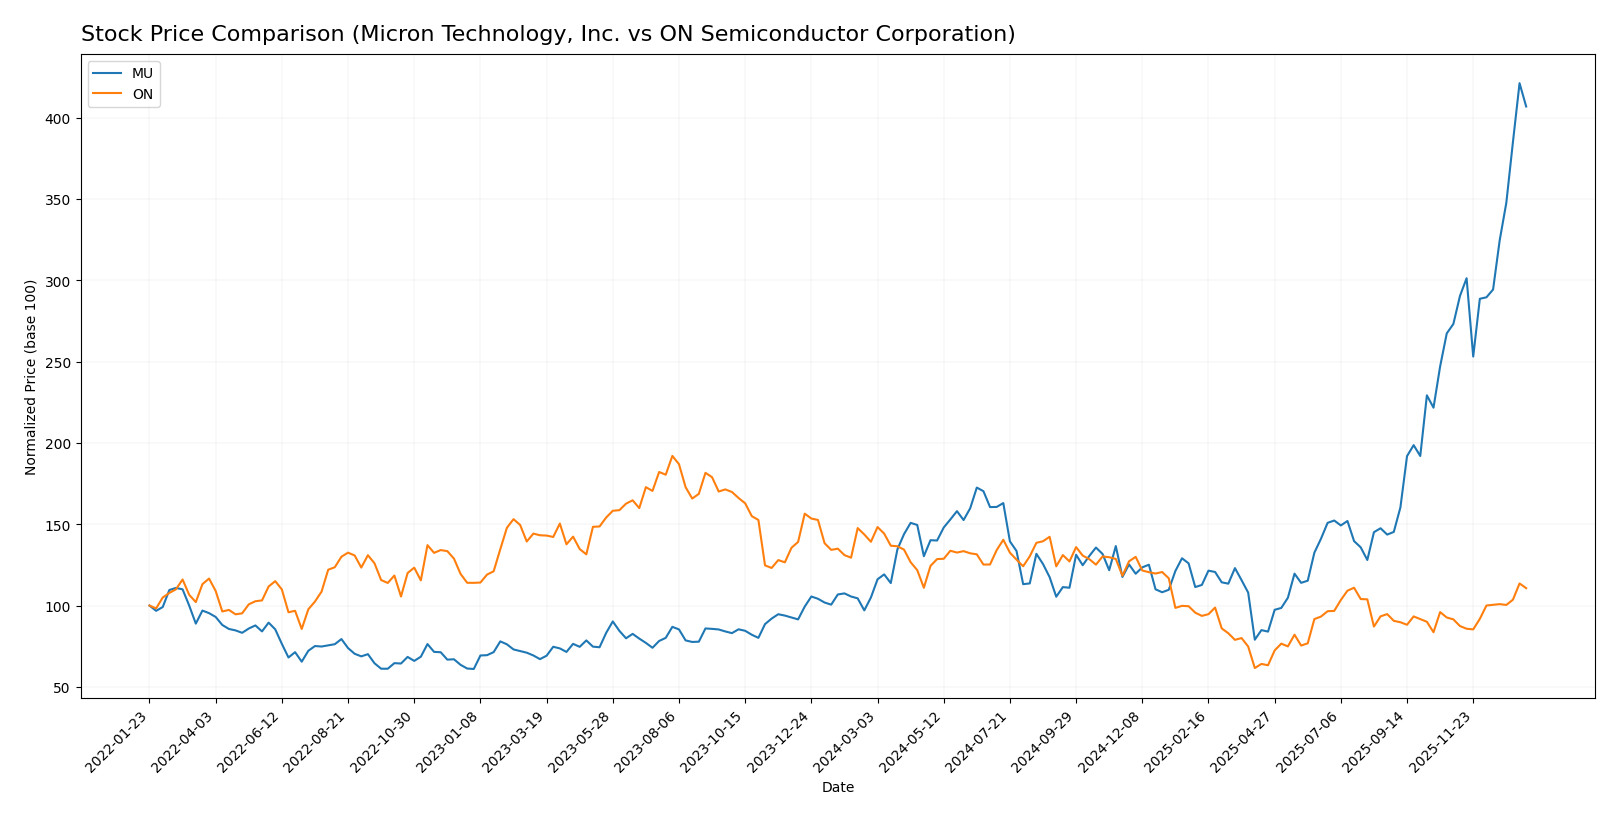
The stock price movements of Micron Technology, Inc. (MU) and ON Semiconductor Corporation (ON) over the past 12 months reveal contrasting trends, with MU showing strong acceleration and significant gains, while ON experiences a pronounced decline despite recent recovery.
Trend Analysis
Micron Technology, Inc. (MU) exhibited a bullish trend over the past year with a 287.62% price increase and accelerating momentum. The stock’s volatility is elevated with a 57.56 std deviation, hitting a high of 345.09 and a low of 64.72.
ON Semiconductor Corporation (ON) showed a bearish trend with a -20.49% price decline over the same period, despite acceleration. Volatility is moderate at 11.97 std deviation, with notable price extremes between 33.7 and 81.14.
Comparing both, MU delivered the highest market performance with a substantial price appreciation, whereas ON faced considerable losses despite recent positive momentum.
Target Prices
Analysts present a clear consensus on target prices for Micron Technology, Inc. and ON Semiconductor Corporation.
| Company | Target High | Target Low | Consensus |
|---|---|---|---|
| Micron Technology, Inc. | 450 | 190 | 328.22 |
| ON Semiconductor Corporation | 64 | 51 | 58.33 |
The consensus target price for Micron is slightly below its current price of 333.35 USD, indicating balanced expectations. ON Semiconductor’s target consensus at 58.33 USD is marginally below its current price of 60.58 USD, suggesting cautious optimism among analysts.
Analyst Opinions Comparison
This section compares analysts’ ratings and grades for Micron Technology, Inc. (MU) and ON Semiconductor Corporation (ON):
Rating Comparison
MU Rating
- Rating: B, classified as Very Favorable by analysts.
- Discounted Cash Flow Score: 1, indicating a Very Unfavorable valuation based on future cash flows.
- ROE Score: 4, reflecting Favorable efficiency in generating profit from equity.
- ROA Score: 5, signaling Very Favorable asset utilization.
- Debt To Equity Score: 3, considered Moderate financial risk.
- Overall Score: 3, assessed as Moderate overall financial standing.
ON Rating
- Rating: B-, also classified as Very Favorable by analysts.
- Discounted Cash Flow Score: 3, indicating a Moderate valuation.
- ROE Score: 2, reflecting Moderate profit efficiency.
- ROA Score: 3, indicating Moderate effectiveness in asset use.
- Debt To Equity Score: 2, also considered Moderate financial risk.
- Overall Score: 2, assessed as Moderate overall financial standing.
Which one is the best rated?
Micron Technology (MU) holds a higher rating (B vs. B-) and outperforms ON Semiconductor (ON) in key scores such as ROE and ROA. However, ON has a better Discounted Cash Flow score. Overall, MU is rated more favorably based strictly on the provided data.
Scores Comparison
Here is a comparison of the Altman Z-Score and Piotroski Score for the two companies:
MU Scores
- Altman Z-Score: 10.50, indicating a safe zone with very low bankruptcy risk.
- Piotroski Score: 7, classified as strong financial health.
ON Scores
- Altman Z-Score: 4.84, also in the safe zone, showing low bankruptcy risk.
- Piotroski Score: 6, classified as average financial health.
Which company has the best scores?
Based strictly on the provided scores, MU shows a higher Altman Z-Score and a stronger Piotroski Score than ON. MU’s metrics indicate better financial stability and strength compared to ON’s scores.
Grades Comparison
Here is a detailed comparison of the latest grades assigned to Micron Technology, Inc. and ON Semiconductor Corporation:
Micron Technology, Inc. Grades
The following table summarizes recent grades from reputable grading companies for Micron Technology, Inc.:
| Grading Company | Action | New Grade | Date |
|---|---|---|---|
| Keybanc | Maintain | Overweight | 2026-01-13 |
| B of A Securities | Maintain | Buy | 2026-01-13 |
| Lynx Global | Maintain | Buy | 2026-01-12 |
| Mizuho | Maintain | Outperform | 2026-01-09 |
| UBS | Maintain | Buy | 2026-01-07 |
| Piper Sandler | Maintain | Overweight | 2026-01-07 |
| Piper Sandler | Maintain | Overweight | 2025-12-18 |
| Barclays | Maintain | Overweight | 2025-12-18 |
| Keybanc | Maintain | Overweight | 2025-12-18 |
| Wolfe Research | Maintain | Outperform | 2025-12-18 |
Overall, Micron Technology shows a consistent trend of positive grades, predominantly “Buy,” “Overweight,” and “Outperform,” reflecting strong analyst confidence.
ON Semiconductor Corporation Grades
The following table presents recent grades from established grading companies for ON Semiconductor Corporation:
| Grading Company | Action | New Grade | Date |
|---|---|---|---|
| Piper Sandler | Maintain | Overweight | 2026-01-07 |
| Truist Securities | Maintain | Hold | 2025-12-19 |
| Morgan Stanley | Maintain | Equal Weight | 2025-11-24 |
| Truist Securities | Maintain | Hold | 2025-11-04 |
| Baird | Maintain | Neutral | 2025-11-04 |
| Rosenblatt | Maintain | Neutral | 2025-11-04 |
| Morgan Stanley | Maintain | Equal Weight | 2025-11-04 |
| TD Cowen | Maintain | Buy | 2025-11-04 |
| UBS | Maintain | Neutral | 2025-10-27 |
| B of A Securities | Maintain | Neutral | 2025-09-05 |
ON Semiconductor’s grades are more mixed but lean toward a moderate outlook, with many “Hold,” “Neutral,” and “Equal Weight” ratings alongside fewer “Buy” or “Overweight” grades.
Which company has the best grades?
Micron Technology, Inc. has received predominantly stronger grades such as “Buy,” “Overweight,” and “Outperform,” whereas ON Semiconductor Corporation shows a more cautious consensus with several “Hold” and “Neutral” ratings. This difference could influence investors’ perception of risk and growth potential between the two companies.
Strengths and Weaknesses
Below is a comparison of key strengths and weaknesses for Micron Technology, Inc. (MU) and ON Semiconductor Corporation (ON) based on the most recent data.
| Criterion | Micron Technology, Inc. (MU) | ON Semiconductor Corporation (ON) |
|---|---|---|
| Diversification | High revenue concentration in DRAM ($28.6B) and NAND ($8.5B) products, less diversified across segments | Balanced revenue across Power Solutions ($3.35B), Analog Solutions ($2.61B), and Intelligent Sensing ($1.13B) groups |
| Profitability | Favorable net margin (22.8%), ROE (15.8%), ROIC (12.1%) with growing profitability but ROIC below WACC | Favorable net margin (22.2%), ROE (17.9%), ROIC (11.9%), growing profitability but ROIC below WACC |
| Innovation | Moderate asset turnover ratios (0.45 overall, 0.79 fixed assets) suggest room for operational efficiency improvement | Slightly better fixed asset turnover (1.61) but neutral overall asset turnover (0.5) |
| Global presence | Strong presence in memory semiconductor markets with global customers | Diverse analog and power semiconductor markets with increasing global reach |
| Market Share | Leading in memory segments (DRAM and NAND) but faces intense competition | Growing market share in analog and power solutions, with innovation in sensing technologies |
Key takeaways: Both MU and ON show slightly favorable economic moats with growing profitability, though neither currently earns returns significantly above their cost of capital. MU is more concentrated in memory products, while ON benefits from a more diversified product mix. Investors should weigh MU’s market leadership in DRAM/NAND against ON’s broader portfolio and operational efficiency.
Risk Analysis
Below is a comparative table outlining key risk factors for Micron Technology, Inc. (MU) and ON Semiconductor Corporation (ON) based on the most recent data available:
| Metric | Micron Technology, Inc. (MU) | ON Semiconductor Corporation (ON) |
|---|---|---|
| Market Risk | Beta 1.503; volatile price range 61.54-351.23; sensitive to semiconductor cycle swings | Beta 1.543; price range 31.04-63.63; exposed to automotive and industrial markets cyclicality |
| Debt level | Debt-to-Equity 0.28; Debt-to-Assets 18.45%; Interest Coverage 21.26 (favorable) | Debt-to-Equity 0.38; Debt-to-Assets 23.9%; Interest Coverage 30.49 (favorable) |
| Regulatory Risk | Moderate; semiconductor industry subject to export controls and data security regulations | Moderate; automotive and industrial sectors face evolving regulatory standards |
| Operational Risk | Moderate; relies on advanced manufacturing, supply chain complexity | Moderate; diverse product segments but dependent on foundry and design services |
| Environmental Risk | Increasing focus on energy efficiency and waste management in manufacturing | Focus on sustainable energy solutions, but environmental compliance costs rising |
| Geopolitical Risk | High; US-China trade tensions impact supply chain and market access | High; global automotive supply chains affected by geopolitical shifts |
In synthesis, both companies face significant market and geopolitical risks due to their semiconductor industry exposure and global supply chains. Micron’s strong interest coverage and lower leverage reduce financial risk, while ON Semiconductor’s exposure to automotive electrification offers growth but with regulatory and environmental cost pressures. Investors should weigh cyclical volatility and geopolitical uncertainties as the most impactful risks in 2026.
Which Stock to Choose?
Micron Technology, Inc. (MU) shows strong income growth with a 48.85% revenue increase in the last year, favorable profitability ratios including a 22.84% net margin and 15.76% ROE, low debt levels, and a very favorable overall rating of B. Its financial ratios are mostly favorable, though some asset turnover metrics are weak.
ON Semiconductor Corporation (ON) exhibits a slight revenue decline over the past year but favorable long-term growth, with a 22.21% net margin and 17.88% ROE. Debt and interest coverage are well managed, though some ratios like P/B and current ratio are less favorable. Its rating is also very favorable at B- but with more moderate scores.
Considering the global income statements and financial ratios, MU’s consistently favorable growth and profitability metrics might appeal to growth-oriented investors, while ON’s stable profitability and moderate financial ratios could be more suitable for those seeking slightly more conservative value exposure. Both companies show increasing profitability trends but lack a strong economic moat.
Disclaimer: Investment carries a risk of loss of initial capital. The past performance is not a reliable indicator of future results. Be sure to understand risks before making an investment decision.
Go Further
I encourage you to read the complete analyses of Micron Technology, Inc. and ON Semiconductor Corporation to enhance your investment decisions: