Home > Comparison > Technology > MU vs NXPI
The strategic rivalry between Micron Technology, Inc. and NXP Semiconductors N.V. defines the current trajectory of the semiconductor sector. Micron operates as a capital-intensive memory and storage manufacturer, while NXP specializes in diversified semiconductor solutions including microcontrollers and connectivity. This head-to-head contrasts Micron’s scale-driven memory focus against NXP’s innovation in embedded and automotive chips. This analysis will determine which company presents a superior risk-adjusted profile for a diversified technology portfolio.
Table of contents
Companies Overview
Micron Technology and NXP Semiconductors are pivotal players shaping the semiconductor landscape.
Micron Technology, Inc.: Memory and Storage Powerhouse
Micron Technology dominates the memory and storage market with DRAM, NAND, and NOR products. Its revenue engine centers on dynamic random access memory and non-volatile storage solutions. In 2026, the company focused on expanding cloud server and mobile device applications, leveraging its broad portfolio to serve enterprise, consumer, and industrial sectors.
NXP Semiconductors N.V.: Connectivity and Sensor Innovator
NXP Semiconductors leads in microcontrollers and connectivity solutions, including wireless communications and sensors. Its revenue comes from diversified semiconductor products serving automotive, IoT, and mobile markets. In 2026, NXP prioritized enhancing security controllers and environmental sensors to capture growth in industrial automation and connected devices.
Strategic Collision: Similarities & Divergences
Micron and NXP share a semiconductor focus but differ in core business models—Micron emphasizes memory/storage, while NXP targets connectivity and sensors. They primarily compete in automotive and industrial sectors, where integrated systems demand both memory capacity and connectivity. Their investment profiles diverge sharply: Micron offers scale in memory tech; NXP provides niche innovation in secure, connected semiconductors.
Income Statement Comparison
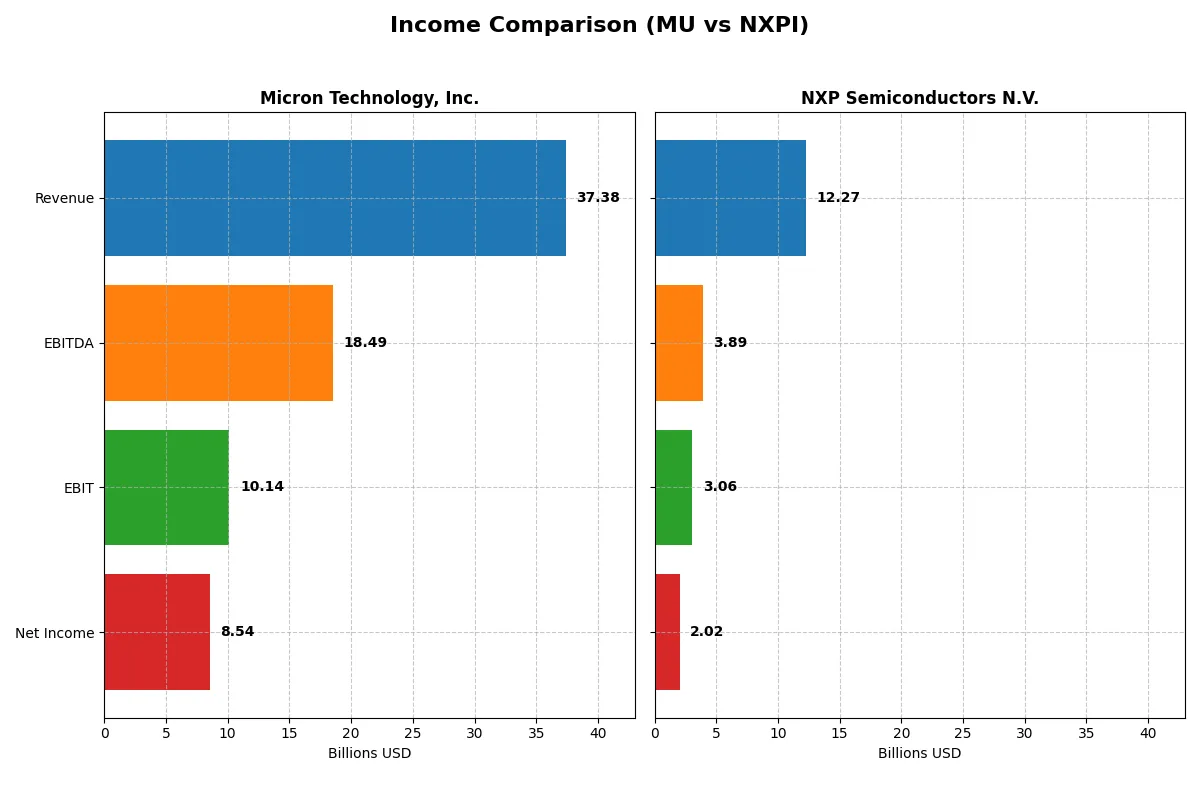
The following data dissects the core profitability and scalability of both corporate engines to reveal who dominates the bottom line:
| Metric | Micron Technology, Inc. (MU) | NXP Semiconductors N.V. (NXPI) |
|---|---|---|
| Revenue | 37.4B | 12.3B |
| Cost of Revenue | 22.5B | 5.6B |
| Operating Expenses | 5.0B | 3.4B |
| Gross Profit | 14.9B | 6.7B |
| EBITDA | 18.5B | 3.9B |
| EBIT | 10.1B | 3.1B |
| Interest Expense | 0.5B | 0.4B |
| Net Income | 8.5B | 2.0B |
| EPS | 7.65 | 8.00 |
| Fiscal Year | 2025 | 2025 |
Income Statement Analysis: The Bottom-Line Duel
This income statement comparison reveals which company delivers superior operational efficiency and profitability in a competitive semiconductor landscape.
Micron Technology, Inc. Analysis
Micron’s revenue soared from $15.5B in 2023 to $37.4B in 2025, with net income swinging from a loss of $-5.8B in 2023 to a robust $8.5B in 2025. Its gross margin improved sharply to 39.8%, while net margin reached a healthy 22.8%. The latest fiscal year highlights strong momentum and operational leverage driving significant earnings growth.
NXP Semiconductors N.V. Analysis
NXP’s revenue peaked at $13.3B in 2023 but declined slightly to $12.3B by 2025. Net income followed a similar trend, falling from $2.8B in 2023 to $2.0B in 2025. Despite a superior gross margin of 54.4%, net margin contracted to 16.5%. The recent year shows margin pressure and shrinking profitability, reflecting challenges in sustaining earnings growth.
Momentum Surge vs. Margin Stability
Micron outpaces NXP with explosive revenue and net income growth, reflecting superior operational efficiency and scaling benefits. NXP maintains higher gross margins but suffers declining net margins and earnings momentum. Investors seeking dynamic growth and expanding profitability may favor Micron’s current trajectory over NXP’s steadier yet faltering margin profile.
Financial Ratios Comparison
These vital ratios act as a diagnostic tool to expose the underlying fiscal health, valuation premiums, and capital efficiency of the companies compared below:
| Ratios | Micron Technology, Inc. (MU) | NXP Semiconductors N.V. (NXPI) |
|---|---|---|
| ROE | 15.8% (2025) | 27.3% (2024) |
| ROIC | 12.1% (2025) | 12.9% (2024) |
| P/E | 15.9 (2025) | 21.1 (2024) |
| P/B | 2.51 (2025) | 5.78 (2024) |
| Current Ratio | 2.52 (2025) | 2.36 (2024) |
| Quick Ratio | 1.79 (2025) | 1.60 (2024) |
| D/E | 0.28 (2025) | 1.18 (2024) |
| Debt-to-Assets | 18.5% (2025) | 44.5% (2024) |
| Interest Coverage | 20.7 (2025) | 8.59 (2024) |
| Asset Turnover | 0.45 (2025) | 0.52 (2024) |
| Fixed Asset Turnover | 0.79 (2025) | 3.86 (2024) |
| Payout ratio | 6.1% (2025) | 41.4% (2024) |
| Dividend yield | 0.38% (2025) | 1.96% (2024) |
| Fiscal Year | 2025 | 2024 |
Efficiency & Valuation Duel: The Vital Signs
Ratios act as the company’s DNA, exposing hidden risks and operational strengths that shape investor outcomes over time.
Micron Technology, Inc.
Micron posts a strong 15.76% ROE and a healthy 22.84% net margin, signaling solid profitability. Its P/E of 15.94 and P/B of 2.51 suggest a fairly valued stock. Despite a modest 0.38% dividend yield, Micron’s reinvestment in R&D supports growth and future competitiveness, balancing shareholder returns with innovation.
NXP Semiconductors N.V.
NXP shines with a robust 27.33% ROE and a 19.9% net margin, demonstrating operational efficiency. The P/E stands at 21.13, indicating a somewhat stretched valuation, while the high P/B of 5.78 raises caution. NXP delivers a 1.96% dividend yield, complementing strong cash flow and disciplined capital allocation to reward shareholders.
Balanced Profitability vs. Growth Premium
Both companies show slightly favorable ratio profiles, but Micron offers a more reasonable valuation with solid profitability, while NXP commands a premium for superior returns and dividends. Investors seeking value with growth may lean toward Micron; those favoring income and high return might prefer NXP’s profile.
Which one offers the Superior Shareholder Reward?
I compare Micron Technology (MU) and NXP Semiconductors (NXPI) on dividends, payout ratios, and buybacks. MU yields 0.38% with a low payout ratio of 6.1%, signaling ample free cash flow coverage but modest dividend income. NXPI offers a higher yield of 1.96% and a sustainable 41.4% payout ratio, supported by strong free cash flow. NXPI’s robust buyback program, returning 8B+ annually, dwarfs MU’s minimal buyback activity, amplifying total shareholder returns. NXPI’s balanced dividend and aggressive buybacks provide a more attractive, sustainable shareholder reward in 2026.
Comparative Score Analysis: The Strategic Profile
The radar chart reveals the fundamental DNA and trade-offs of both firms, highlighting their operational strengths and valuation nuances:
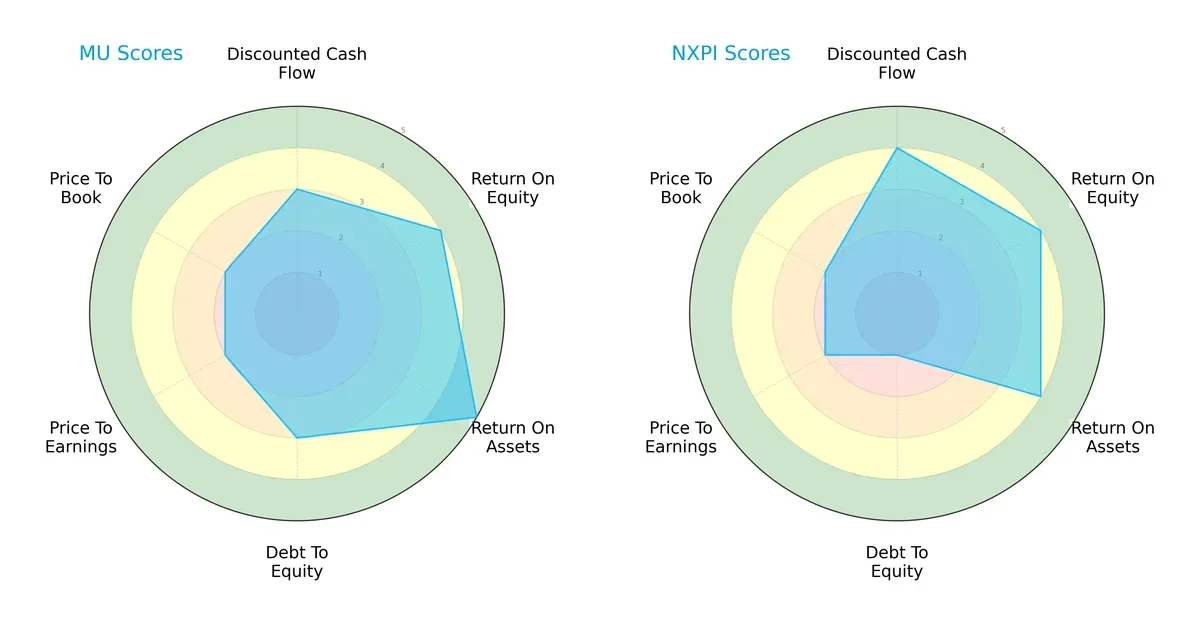
Micron Technology exhibits a strong asset utilization edge with a top ROA score of 5, while NXP Semiconductors leads on discounted cash flow efficiency with a score of 4. Both share parity in overall rating and ROE at 4, but NXP’s debt-to-equity score of 1 signals higher leverage risk compared to Micron’s moderate 3. Valuation metrics (P/E and P/B) are evenly matched, reflecting similar market perceptions. Micron has a more balanced financial profile; NXP leans on DCF strength but carries greater financial risk.
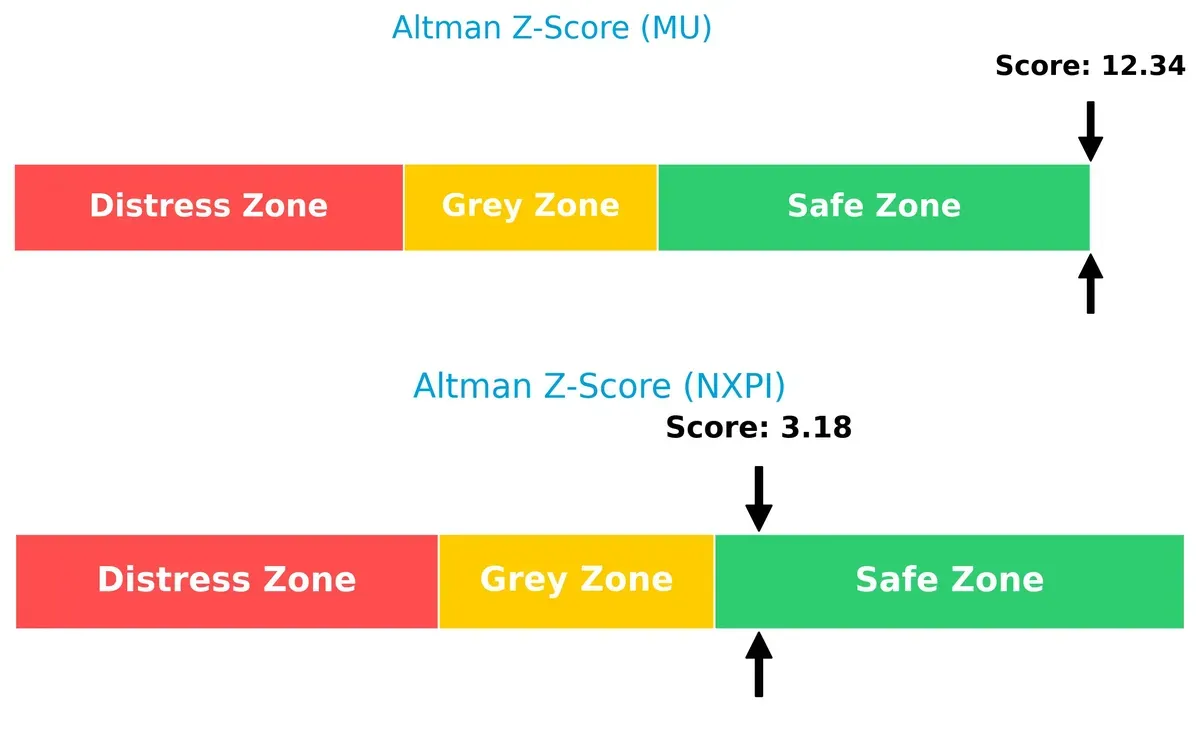
Bankruptcy Risk: Solvency Showdown
Micron’s Altman Z-Score of 12.3 far exceeds NXP’s 3.2, both safely above the distress threshold, indicating Micron’s superior solvency and resilience in this cycle:
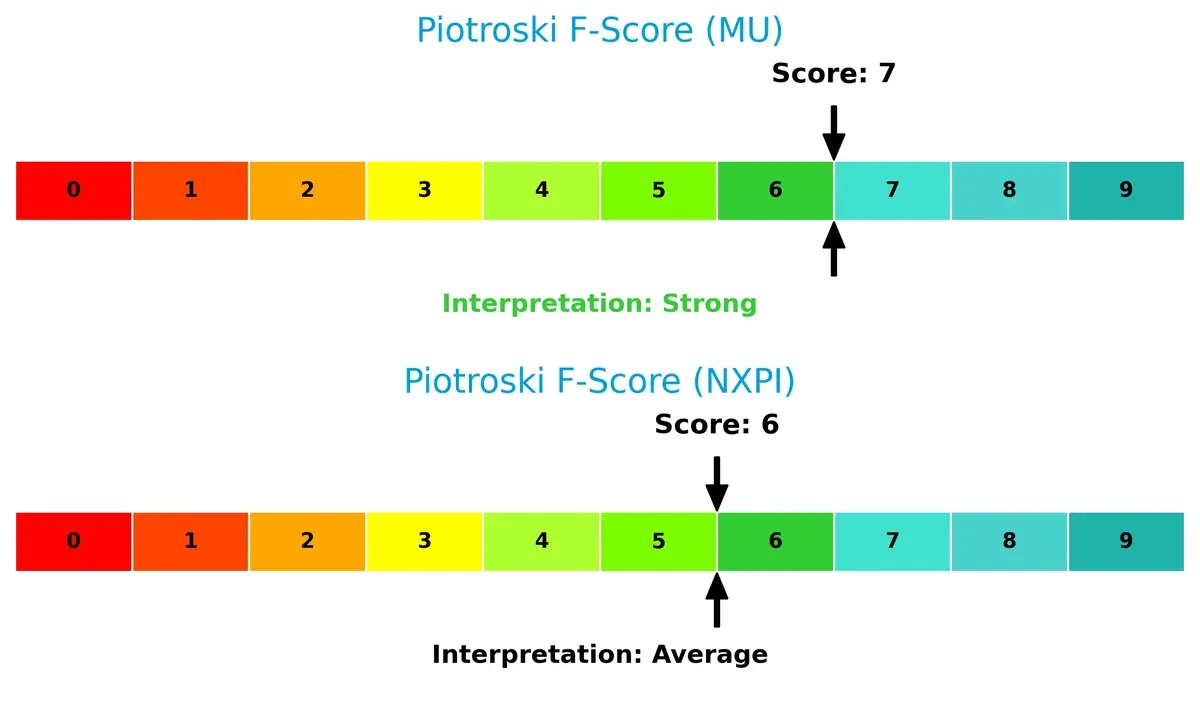
Financial Health: Quality of Operations
Micron’s Piotroski F-Score of 7 versus NXP’s 6 suggests stronger internal financial controls and profitability. NXP’s score signals mild caution but no immediate red flags:
How are the two companies positioned?
This section dissects the operational DNA of Micron and NXP by comparing their revenue distribution and analyzing internal strengths and weaknesses. The goal is to confront their economic moats and identify which model offers the most resilient competitive advantage today.
Revenue Segmentation: The Strategic Mix
This visual comparison dissects how Micron Technology, Inc. and NXP Semiconductors N.V. diversify their income streams and where their primary sector bets lie:
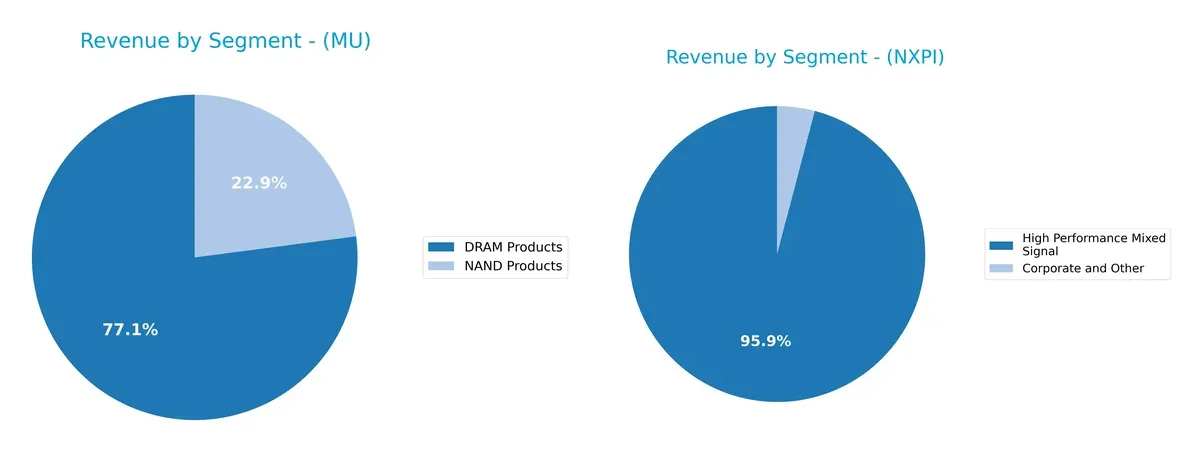
Micron anchors revenue in DRAM Products with $28.6B in 2025, dwarfing its NAND segment at $8.5B. This concentration signals deep specialization but heightens cyclicality risk. NXP relies heavily on High Performance Mixed Signal at $9B, complemented by smaller Corporate and Other segments, revealing a moderately diversified portfolio focused on analog and mixed-signal strength. Micron’s focus drives memory infrastructure dominance, while NXP pivots on broad industrial applications, reducing single-segment dependency.
Strengths and Weaknesses Comparison
This table compares the strengths and weaknesses of Micron Technology, Inc. (MU) and NXP Semiconductors N.V. (NXPI):
MU Strengths
- Strong profitability with 22.84% net margin and 15.76% ROE
- Favorable liquidity ratios with current ratio 2.52 and quick ratio 1.79
- Low debt levels with D/E at 0.28 and 18.45% debt to assets
- Large US and Taiwan revenue bases, indicating strong global presence
- Diverse product segments including DRAM and NAND products
NXPI Strengths
- Robust profitability with 19.9% net margin, 27.33% ROE, and 12.91% ROIC
- Favorable fixed asset turnover of 3.86 and adequate interest coverage
- Solid liquidity with current ratio 2.36 and quick ratio 1.6
- Diversified geographic sales across China, Germany, Japan, and Singapore
- Focus on high performance mixed signal products supporting innovation
MU Weaknesses
- Unfavorable ROIC at 12.12% below WACC of 22.1%, indicating capital allocation challenges
- Lower asset turnover ratios (0.45 total, 0.79 fixed assets)
- Low dividend yield at 0.38%
- Neutral P/E and P/B ratios limit valuation appeal
NXPI Weaknesses
- Higher debt to equity ratio at 1.18 indicating leverage concerns
- Elevated P/B ratio of 5.78 signals premium valuation risk
- Neutral dividend yield at 1.96%
- Asset turnover moderate at 0.52, limiting operational efficiency
Micron’s strengths lie in its strong liquidity, low leverage, and dominant US and Taiwan markets, but capital efficiency is a concern. NXP excels in profitability and asset utilization yet carries higher leverage and valuation risks. Both companies display slightly favorable financial profiles but face distinct strategic challenges.
The Moat Duel: Analyzing Competitive Defensibility
A structural moat is the critical barrier protecting long-term profits from competitive erosion in dynamic markets. Here’s how Micron and NXP stack up:
Micron Technology, Inc.: Cost Leadership in Memory Solutions
Micron’s primary moat lies in cost advantage through scale in DRAM and NAND memory production. I see margin stability with a 27% EBIT margin and rapidly growing profitability in 2025. Its expansion into embedded and automotive markets may deepen this edge, but intense price competition remains a threat.
NXP Semiconductors N.V.: Innovation-Driven Niche Focus
NXP’s moat derives from specialized products and strong intangible assets, particularly in automotive and IoT semiconductors. Despite recent revenue headwinds, it sustains a high 54% gross margin and growing ROIC. NXP’s ability to innovate and expand wireless connectivity solutions positions it well for future market disruption.
Cost Efficiency vs. Innovation Specialization
NXP holds the wider and deeper moat, demonstrated by a ROIC exceeding WACC by 3.6% and sharp ROIC growth. Micron’s growing ROIC is encouraging but still below WACC, signaling value erosion. NXP is better equipped to defend and grow its market share through innovation and niche dominance.
Which stock offers better returns?
The past year shows contrasting price dynamics: Micron Technology surges with strong buyer dominance, while NXP Semiconductors faces a sustained decline despite recent modest gains.
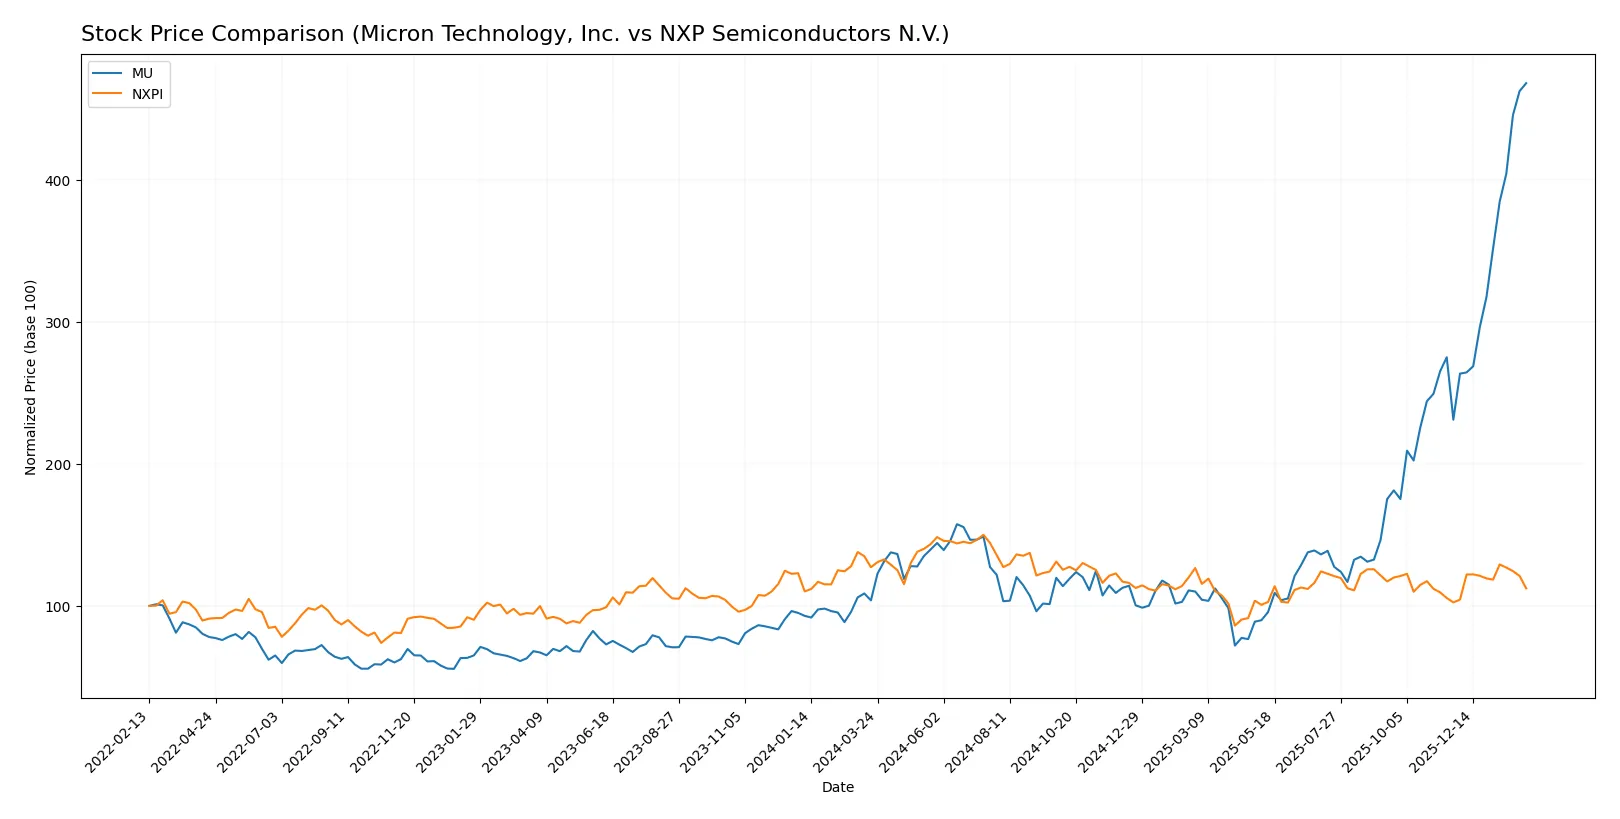
Trend Comparison
Micron Technology’s stock rose 350.32% over the last 12 months, marking a bullish trend with accelerating gains and high volatility. It hit a low of 64.72 and peaked at 419.93.
NXP Semiconductors declined 11.65% in the same period, reflecting a bearish trend despite acceleration. It ranged between 160.81 and 280.19, showing lower volatility than Micron.
Micron clearly outperformed NXP, delivering substantially higher returns and stronger buyer interest throughout the year.
Target Prices
Analyst consensus reveals a mixed but generally cautious outlook for leading semiconductor stocks.
| Company | Target Low | Target High | Consensus |
|---|---|---|---|
| Micron Technology, Inc. | 190 | 480 | 345.61 |
| NXP Semiconductors N.V. | 215 | 280 | 242.5 |
Targets for Micron Technology range widely from 190 to 480, with consensus below the current price of 416.63, implying downside risk. NXP’s consensus target at 242.5 exceeds its current 209.14 price, suggesting modest upside potential.

Don’t Let Luck Decide Your Entry Point
Optimize your entry points with our advanced ProRealTime indicators. You’ll get efficient buy signals with precise price targets for maximum performance. Start outperforming now!
How do institutions grade them?
The following tables summarize recent institutional grades for Micron Technology, Inc. and NXP Semiconductors N.V.:
Micron Technology, Inc. Grades
This table shows the latest grades issued by recognized financial institutions for Micron Technology:
| Grading Company | Action | New Grade | Date |
|---|---|---|---|
| Mizuho | Maintain | Outperform | 2026-01-27 |
| Stifel | Maintain | Buy | 2026-01-20 |
| Rosenblatt | Maintain | Buy | 2026-01-20 |
| TD Cowen | Maintain | Buy | 2026-01-20 |
| Citigroup | Maintain | Buy | 2026-01-15 |
| Wells Fargo | Maintain | Overweight | 2026-01-15 |
| Cantor Fitzgerald | Maintain | Overweight | 2026-01-14 |
| Keybanc | Maintain | Overweight | 2026-01-13 |
| B of A Securities | Maintain | Buy | 2026-01-13 |
| Lynx Global | Maintain | Buy | 2026-01-12 |
NXP Semiconductors N.V. Grades
Below are the recent grades assigned by reputable financial firms for NXP Semiconductors:
| Grading Company | Action | New Grade | Date |
|---|---|---|---|
| Wells Fargo | Maintain | Overweight | 2026-01-15 |
| Citigroup | Maintain | Buy | 2026-01-15 |
| Truist Securities | Maintain | Buy | 2025-12-19 |
| Truist Securities | Maintain | Buy | 2025-10-29 |
| JP Morgan | Maintain | Neutral | 2025-10-29 |
| Susquehanna | Maintain | Neutral | 2025-07-23 |
| JP Morgan | Maintain | Neutral | 2025-07-23 |
| Truist Securities | Maintain | Buy | 2025-07-23 |
| Wells Fargo | Maintain | Overweight | 2025-07-23 |
| Barclays | Maintain | Overweight | 2025-07-22 |
Which company has the best grades?
Micron Technology consistently earns “Buy” and “Outperform” ratings, reflecting strong institutional confidence. NXP Semiconductors shows a mix of “Buy,” “Overweight,” and several “Neutral” grades, indicating more cautious sentiment. Investors may interpret Micron’s higher-grade consistency as a sign of stronger market endorsement.
Risks specific to each company
The following categories identify critical pressure points and systemic threats facing Micron Technology, Inc. and NXP Semiconductors N.V. in the 2026 market environment:
1. Market & Competition
Micron Technology, Inc.
- Faces intense competition in memory and storage markets; a cyclical sector with volatile demand.
NXP Semiconductors N.V.
- Competes in diverse semiconductor segments including automotive and IoT; benefits from broad end-market exposure.
2. Capital Structure & Debt
Micron Technology, Inc.
- Maintains a low debt-to-equity ratio (0.28), ensuring financial flexibility and lower risk.
NXP Semiconductors N.V.
- Exhibits high leverage with debt-to-equity at 1.18, increasing financial vulnerability.
3. Stock Volatility
Micron Technology, Inc.
- Beta of 1.505 indicates above-average volatility relative to the market, posing higher risk.
NXP Semiconductors N.V.
- Slightly lower beta at 1.458 suggests marginally less volatility but still above market average.
4. Regulatory & Legal
Micron Technology, Inc.
- US-based, exposed to stringent tech export controls and IP regulations impacting semiconductor supply.
NXP Semiconductors N.V.
- European-headquartered with significant China exposure, faces complex regulatory environments and trade tensions.
5. Supply Chain & Operations
Micron Technology, Inc.
- Dependency on advanced manufacturing and raw materials; supply chain disruptions can impact production.
NXP Semiconductors N.V.
- Operates globally with diversified suppliers but also vulnerable to geopolitical and logistical risks.
6. ESG & Climate Transition
Micron Technology, Inc.
- Increasing pressure to reduce carbon footprint in energy-intensive memory production.
NXP Semiconductors N.V.
- Strong focus on sustainable products, but faces challenges in aligning operations with EU climate policies.
7. Geopolitical Exposure
Micron Technology, Inc.
- US-China tensions threaten access to critical Asian markets and technology transfers.
NXP Semiconductors N.V.
- Extensive operations in China and Europe expose it to geopolitical risks from trade wars and regional conflicts.
Which company shows a better risk-adjusted profile?
Micron’s low leverage and strong liquidity provide a safer financial base, but its cyclical market risk and high stock volatility remain concerns. NXP faces elevated financial risk due to high debt and geopolitical exposure, despite more diversified end markets. Micron’s superior Altman Z-score (12.34 vs. 3.18) and Piotroski score (7 vs. 6) reflect a stronger financial health. However, NXP’s broader product portfolio offers some resilience. Overall, Micron presents a better risk-adjusted profile, though investors must monitor semiconductor cycle volatility carefully.
Final Verdict: Which stock to choose?
Micron Technology, Inc. boasts a superpower in rapid profitability growth combined with resilient liquidity. Its key vulnerability lies in a return on invested capital that trails its cost of capital, signaling caution on value creation. This profile suits investors targeting aggressive growth amid market volatility.
NXP Semiconductors N.V. commands a durable competitive moat through efficient capital use and high return on equity. Its heavier debt load compared to Micron introduces a moderate risk premium but supports steady cash flow generation. This makes it suitable for Growth at a Reasonable Price (GARP) portfolios seeking stability.
If you prioritize rapid earnings momentum and strong liquidity, Micron appears compelling due to accelerating profitability and a bullish price trend. However, if you seek durable value creation with a proven economic moat, NXP offers better stability despite recent revenue softness. Each stock fits distinct investor profiles with balanced risk considerations.
Disclaimer: Investment carries a risk of loss of initial capital. The past performance is not a reliable indicator of future results. Be sure to understand risks before making an investment decision.
Go Further
I encourage you to read the complete analyses of Micron Technology, Inc. and NXP Semiconductors N.V. to enhance your investment decisions: