In the rapidly evolving semiconductor industry, NVIDIA Corporation and Micron Technology, Inc. stand out as pivotal players shaping the future of technology. NVIDIA leads in graphics processing and AI-driven computing, while Micron specializes in advanced memory and storage solutions. Both companies drive innovation with overlapping market segments yet distinct strategies. This article will help you determine which stock aligns best with your investment goals in 2026.

Table of contents
Companies Overview
I will begin the comparison between NVIDIA Corporation and Micron Technology, Inc. by providing an overview of these two companies and their main differences.
NVIDIA Overview
NVIDIA Corporation focuses on providing graphics, compute, and networking solutions globally. Its products include GPUs for gaming and professional visualization, data center platforms for AI and HPC, automotive AI systems, and software for 3D design and virtual worlds. The company serves multiple markets such as gaming, datacenter, and automotive, targeting OEMs, system builders, cloud providers, and automotive manufacturers.
Micron Overview
Micron Technology, Inc. specializes in designing, manufacturing, and selling memory and storage products worldwide. Its offerings cover DRAM, NAND, and NOR memory technologies used in cloud servers, enterprise, client, graphics, and mobile device markets. Micron serves a wide range of sectors including automotive and industrial, distributing its products via direct sales, independent representatives, and distribution partners.
Key similarities and differences
Both companies operate in the semiconductor industry and serve technology markets with advanced hardware solutions. While NVIDIA emphasizes GPUs, AI platforms, and automotive AI, Micron focuses on memory and storage technologies like DRAM and NAND. NVIDIA’s product portfolio is broader in compute and graphics, whereas Micron is specialized in memory components, highlighting distinct but complementary roles in the semiconductor ecosystem.
Income Statement Comparison
Below is a side-by-side comparison of key income statement metrics for NVIDIA Corporation and Micron Technology, Inc. for their most recent fiscal year.

| Metric | NVIDIA Corporation | Micron Technology, Inc. |
|---|---|---|
| Market Cap | 4.46T | 373.2B |
| Revenue | 130.5B | 37.4B |
| EBITDA | 86.1B | 18.5B |
| EBIT | 84.3B | 10.1B |
| Net Income | 72.9B | 8.54B |
| EPS | 2.97 | 7.65 |
| Fiscal Year | 2025 | 2025 |
Income Statement Interpretations
NVIDIA Corporation
NVIDIA’s revenue and net income exhibited robust growth from 2021 to 2025, with revenue soaring from $16.7B to $130.5B and net income increasing from $4.3B to $72.9B. Margins consistently improved, highlighted by a gross margin near 75% and net margin above 55% in 2025. The latest year showed exceptional acceleration in revenue and profitability, reflecting strong operational leverage and efficient cost management.
Micron Technology, Inc.
Micron’s revenue and net income grew steadily over the 2021-2025 period, with revenue rising from $27.7B to $37.4B and net income from $5.9B to $8.5B. Its margins remained favorable but lower than NVIDIA’s, with a 39.8% gross margin and 22.8% net margin in 2025. The most recent year saw significant improvement in earnings and margins, driven by strong gross profit growth and better operating efficiency.
Which one has the stronger fundamentals?
Both companies show favorable income statement trends, but NVIDIA leads with substantially higher revenue and net income growth, alongside superior margins indicating greater profitability and operational efficiency. Micron demonstrates solid improvements, especially in earnings growth and margin expansion, but its fundamentals are less pronounced compared to NVIDIA’s dominant scale and profitability metrics.
Financial Ratios Comparison
The table below compares key financial ratios for NVIDIA Corporation and Micron Technology, Inc. based on their most recent fiscal year data, providing insight into profitability, liquidity, valuation, and leverage.
| Ratios | NVIDIA Corporation (2025) | Micron Technology, Inc. (2025) |
|---|---|---|
| ROE | 91.87% | 15.76% |
| ROIC | 75.28% | 12.12% |
| P/E | 39.90 | 15.94 |
| P/B | 36.66 | 2.51 |
| Current Ratio | 4.44 | 2.52 |
| Quick Ratio | 3.88 | 1.79 |
| D/E (Debt-to-Equity) | 0.13 | 0.28 |
| Debt-to-Assets | 9.20% | 18.45% |
| Interest Coverage | 330.0 | 20.69 |
| Asset Turnover | 1.17 | 0.45 |
| Fixed Asset Turnover | 16.16 | 0.79 |
| Payout Ratio | 1.14% | 6.11% |
| Dividend Yield | 0.029% | 0.38% |
Interpretation of the Ratios
NVIDIA Corporation
NVIDIA shows predominantly strong financial ratios with exceptionally high returns on equity (91.87%) and invested capital (75.28%). The company exhibits favorable asset turnover and interest coverage ratios, but its valuation multiples and current ratio are less attractive. Dividend yield is very low at 0.03%, with a modest dividend payout, indicating cautious shareholder return through dividends and a likely focus on growth and reinvestment.
Micron Technology, Inc.
Micron’s financial ratios are generally favorable, with solid net margin (22.84%) and return on equity (15.76%), though lower than NVIDIA’s. The company maintains a reasonable current ratio and manageable debt levels but shows weaker asset turnover metrics. Its dividend yield is higher than NVIDIA’s at 0.38%, suggesting a more shareholder-oriented return, though payout sustainability should be monitored given some mixed valuation signals.
Which one has the best ratios?
NVIDIA holds the advantage with higher profitability and efficiency ratios, despite some valuation and liquidity concerns. Micron presents a balanced profile with decent returns and moderate risk, though its operational efficiency lags. Overall, both companies have favorable ratios, but NVIDIA’s metrics reflect stronger financial performance and operational effectiveness.
Strategic Positioning
This section compares the strategic positioning of NVIDIA and Micron Technology across Market position, Key segments, and Exposure to technological disruption:
NVIDIA Corporation
- Dominant in semiconductors with strong market cap and high beta; faces intense tech competition.
- Diverse segments: Data Center ($115B), Gaming, Automotive, Professional Visualization drive growth.
- Invests heavily in AI, HPC, autonomous driving, and gaming platforms; adapts to evolving tech trends.
Micron Technology, Inc.
- Large semiconductor player with lower market cap and moderate beta; operates in competitive memory markets.
- Focused on memory and storage: DRAM and NAND products lead revenue; serves cloud, mobile, automotive sectors.
- Concentrated in memory tech; steady innovation needed to maintain relevance amid rapid memory advancements.
NVIDIA vs Micron Technology Positioning
NVIDIA pursues a diversified approach with broad end markets including AI and automotive, providing multiple growth drivers. Micron concentrates on memory and storage, benefiting from focused expertise but facing narrower market scope and greater cyclicality.
Which has the best competitive advantage?
NVIDIA exhibits a very favorable moat with strong, growing ROIC well above WACC, indicating durable competitive advantages. Micron shows a slightly favorable moat with modest ROIC growth but currently sheds value, suggesting less sustainable competitive positioning.
Stock Comparison
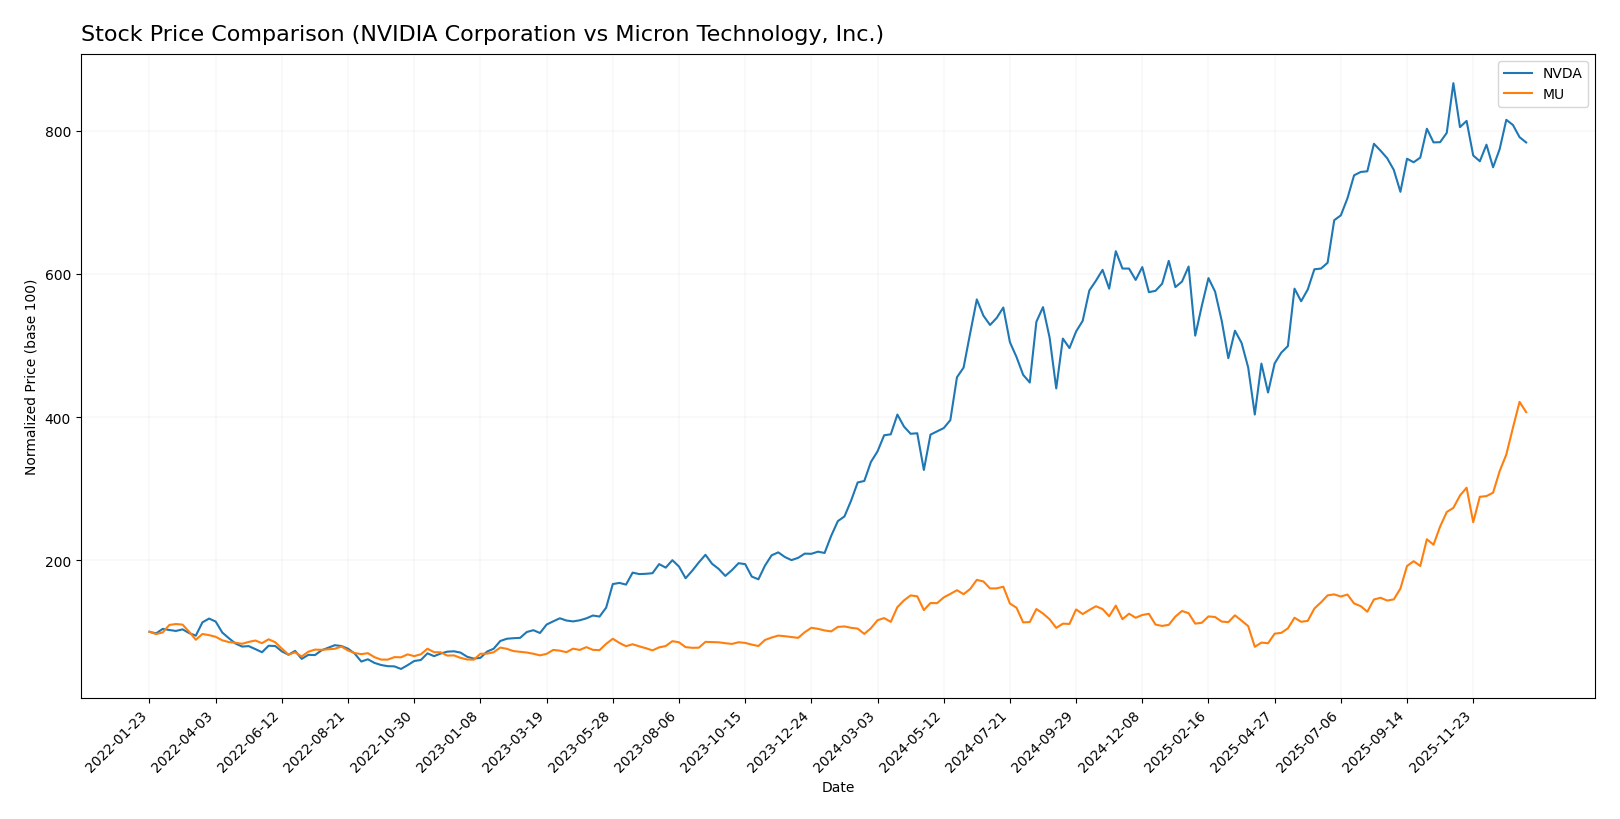
The past year has seen significant bullish momentum for both NVIDIA Corporation and Micron Technology, Inc., with notable price surges and contrasting recent trading dynamics reflecting shifts in investor sentiment.
Trend Analysis
NVIDIA Corporation’s stock price rose sharply by 132.35% over the past 12 months, indicating a bullish trend with decelerating momentum. It experienced a high volatility level with a 32.46 std deviation and traded between $76.2 and $202.49.
Micron Technology, Inc. posted an even stronger 287.62% price increase, confirming a bullish trend with accelerating momentum. This stock showed higher volatility (57.56 std deviation) and ranged from $64.72 to $345.09 during the year.
Comparing both, Micron Technology delivered the highest market performance with a 287.62% gain, outperforming NVIDIA’s 132.35% increase over the same period.
Target Prices
Analysts present a broad target price consensus for both NVIDIA Corporation and Micron Technology, Inc., reflecting varied but optimistic outlooks.
| Company | Target High | Target Low | Consensus |
|---|---|---|---|
| NVIDIA Corporation | 352 | 140 | 264.34 |
| Micron Technology, Inc. | 450 | 190 | 328.22 |
The consensus target prices for NVIDIA and Micron stand significantly above their current stock prices of $183.14 and $333.35, respectively, indicating potential upside as per analyst expectations.
Analyst Opinions Comparison
This section compares analysts’ ratings and grades for NVIDIA Corporation and Micron Technology, Inc.:
Rating Comparison
NVIDIA Rating
- Rating: B+, indicating a very favorable overall rating.
- Discounted Cash Flow Score: 3, a moderate valuation outlook.
- Return on Equity Score: 5, very favorable efficiency in profit generation.
- Return on Assets Score: 5, very favorable asset utilization.
- Debt To Equity Score: 3, showing moderate financial risk.
- Overall Score: 3, reflecting a moderate overall financial standing.
Micron Rating
- Rating: B, also indicating a very favorable overall rating.
- Discounted Cash Flow Score: 1, indicating a very unfavorable valuation.
- Return on Equity Score: 4, favorable profit generation efficiency.
- Return on Assets Score: 5, very favorable asset utilization.
- Debt To Equity Score: 3, showing moderate financial risk.
- Overall Score: 3, reflecting a moderate overall financial standing.
Which one is the best rated?
Based on the data, NVIDIA holds a slightly better rating (B+) than Micron (B), supported by stronger discounted cash flow and return on equity scores, despite both sharing similar overall and debt-to-equity scores.
Scores Comparison
Here is a comparison of the Altman Z-Score and Piotroski Score for NVIDIA and Micron Technology:
NVIDIA Scores
- Altman Z-Score: 68.04, placing NVIDIA well within safe zone.
- Piotroski Score: 6, reflecting average financial strength.
Micron Technology Scores
- Altman Z-Score: 10.50, indicating Micron is also in safe zone.
- Piotroski Score: 7, demonstrating strong financial health.
Which company has the best scores?
Micron Technology has a lower Altman Z-Score than NVIDIA but remains in the safe zone. Its Piotroski Score is higher, indicating stronger financial health compared to NVIDIA’s average score.
Grades Comparison
Here is the comparison of recent grades assigned to NVIDIA Corporation and Micron Technology, Inc.:
NVIDIA Corporation Grades
The following table summarizes the latest grades from reputable grading companies for NVIDIA Corporation:
| Grading Company | Action | New Grade | Date |
|---|---|---|---|
| Mizuho | Maintain | Outperform | 2026-01-09 |
| Truist Securities | Maintain | Buy | 2025-12-29 |
| Stifel | Maintain | Buy | 2025-12-29 |
| B of A Securities | Maintain | Buy | 2025-12-26 |
| Baird | Maintain | Outperform | 2025-12-26 |
| Bernstein | Maintain | Outperform | 2025-12-26 |
| Truist Securities | Maintain | Buy | 2025-12-19 |
| Tigress Financial | Maintain | Strong Buy | 2025-12-18 |
| Morgan Stanley | Maintain | Overweight | 2025-12-01 |
| Deutsche Bank | Maintain | Hold | 2025-11-20 |
NVIDIA’s grades predominantly reflect a positive outlook, with most ratings ranging from Buy to Outperform and a few Strong Buy and Overweight ratings.
Micron Technology, Inc. Grades
The following table shows recent grades for Micron Technology, Inc. from recognized grading firms:
| Grading Company | Action | New Grade | Date |
|---|---|---|---|
| Keybanc | Maintain | Overweight | 2026-01-13 |
| B of A Securities | Maintain | Buy | 2026-01-13 |
| Lynx Global | Maintain | Buy | 2026-01-12 |
| Mizuho | Maintain | Outperform | 2026-01-09 |
| UBS | Maintain | Buy | 2026-01-07 |
| Piper Sandler | Maintain | Overweight | 2026-01-07 |
| Piper Sandler | Maintain | Overweight | 2025-12-18 |
| Barclays | Maintain | Overweight | 2025-12-18 |
| Keybanc | Maintain | Overweight | 2025-12-18 |
| Wolfe Research | Maintain | Outperform | 2025-12-18 |
Micron’s ratings also show a generally favorable sentiment, with a majority of Overweight, Buy, and Outperform grades maintained.
Which company has the best grades?
Both NVIDIA and Micron share a strong consensus rating of “Buy.” However, NVIDIA features a wider range of positive grades including Strong Buy and Outperform, while Micron’s grades largely cluster around Overweight and Buy. This suggests NVIDIA may have a marginally stronger endorsement from analysts, potentially reflecting higher confidence among investors about its growth prospects.
Strengths and Weaknesses
Below is a comparative overview of key strengths and weaknesses for NVIDIA Corporation (NVDA) and Micron Technology, Inc. (MU) based on their latest financial and operational data.
| Criterion | NVIDIA Corporation (NVDA) | Micron Technology, Inc. (MU) |
|---|---|---|
| Diversification | Highly diversified with strong revenue streams from Data Center ($115B), Gaming ($11.35B), Automotive ($1.69B), and Professional Visualization segments. | Primarily focused on memory products: DRAM ($28.6B) and NAND ($8.5B), less diversified across sectors. |
| Profitability | Exceptional profitability with net margin at 55.85%, ROE 91.87%, ROIC 75.28%, reflecting strong value creation. | Good profitability but more modest: net margin 22.84%, ROE 15.76%, ROIC 12.12%, indicating solid but lower margins. |
| Innovation | Demonstrates durable competitive advantage with very favorable moat status; strong investment in AI and data center technologies. | Slightly favorable moat with growing ROIC, but less clear competitive moat; innovation focused on memory tech improvements. |
| Global presence | Strong global footprint with broad market reach in data centers, gaming, and automotive industries worldwide. | Global presence primarily in memory markets; less diversified geographically and by product line. |
| Market Share | Leading market share in GPUs and AI accelerators with rapidly growing data center segment. | Significant market share in DRAM and NAND markets but faces intense competition and cyclicality. |
Key takeaways: NVIDIA exhibits a robust competitive moat, exceptional profitability, and broad diversification, making it a strong value creator. Micron shows improving profitability and steady growth but remains more specialized with moderate competitive advantages and sensitivity to market cycles. Investors should weigh NVIDIA’s premium valuation against its strong fundamentals and consider Micron’s growth potential balanced with sector risks.
Risk Analysis
Below is a comparative table of key risks for NVIDIA Corporation (NVDA) and Micron Technology, Inc. (MU) based on the most recent 2025 data:
| Metric | NVIDIA Corporation (NVDA) | Micron Technology, Inc. (MU) |
|---|---|---|
| Market Risk | High beta 2.31, volatile with wide price range | Moderate beta 1.50, less volatile but sensitive to memory market cycles |
| Debt Level | Low debt-to-equity 0.13, low debt-to-assets 9.2% | Moderate debt-to-equity 0.28, debt-to-assets 18.45% |
| Regulatory Risk | Moderate, exposure to multiple jurisdictions including US, China, and Taiwan | Moderate, subject to US export controls and global supply chain restrictions |
| Operational Risk | High, dependency on advanced GPU and AI tech innovation | Moderate, reliant on DRAM and NAND tech cycles and manufacturing capacity |
| Environmental Risk | Moderate, semiconductor manufacturing environmental impact | Moderate, similar semiconductor production risks and sustainability challenges |
| Geopolitical Risk | High, significant exposure to US-China tensions affecting supply chain | High, strong exposure to geopolitical tensions impacting global memory supply |
The most likely and impactful risks are market volatility for NVIDIA due to its high beta and premium valuation, and geopolitical tensions for both companies given their exposure to global semiconductor supply chains. NVIDIA’s low debt level reduces financial risk, while Micron’s moderate leverage calls for caution in cyclical downturns. Recent US-China trade policies continue to pressure operational and regulatory environments.
Which Stock to Choose?
NVIDIA Corporation (NVDA) shows a strong income evolution with a 682.6% revenue growth over five years and a 55.85% net margin, supported by favorable profitability ratios including a 91.87% ROE and low debt levels. The company’s rating is very favorable (B+), reflecting a robust financial position and a very favorable economic moat with growing ROIC well above WACC.
Micron Technology, Inc. (MU) exhibits moderate income growth of 34.9% over five years, with a 22.84% net margin and generally favorable financial ratios such as a 15.76% ROE and manageable debt. Its rating is also very favorable (B), though its economic moat is slightly favorable, indicating improving but less dominant profitability compared to NVDA.
Investors with a preference for high growth and strong competitive advantage might find NVDA’s financial profile and very favorable rating indicative of greater value creation potential. Conversely, those favoring companies with moderate growth and solid fundamentals could interpret MU’s profile and slightly favorable moat as aligning with a more balanced investment approach.
Disclaimer: Investment carries a risk of loss of initial capital. The past performance is not a reliable indicator of future results. Be sure to understand risks before making an investment decision.
Go Further
I encourage you to read the complete analyses of NVIDIA Corporation and Micron Technology, Inc. to enhance your investment decisions: