Home > Comparison > Technology > MU vs NVEC
The competitive dynamic between Micron Technology, Inc. and NVE Corporation shapes the semiconductor industry’s innovation frontier. Micron operates as a capital-intensive memory and storage giant with a broad product portfolio across multiple markets. In contrast, NVE Corporation specializes as a niche spintronics innovator focused on sensors for industrial and medical applications. This analysis will assess which company offers a superior risk-adjusted investment profile amid evolving technology demands and market cycles.
Table of contents
Companies Overview
Micron Technology and NVE Corporation stand as notable players within the semiconductor industry, each carving distinct niches.
Micron Technology, Inc.: Semiconductor Memory Powerhouse
Micron dominates as a global leader in memory and storage products, generating revenue primarily from DRAM and NAND semiconductor devices. Its 2026 strategy centers on expanding product applications across cloud, mobile, automotive, and industrial sectors. This diversified approach leverages its scale and brand strength under Micron and Crucial for sustained competitive advantage.
NVE Corporation: Spintronics Innovator
NVE is a niche player specializing in spintronic sensors and couplers used in factory automation and medical devices. It focuses on R&D and licensing for magnetoresistive memory technology. In 2026, NVE emphasizes industrial IoT applications, aiming to capitalize on emerging demand despite its relatively small scale and workforce.
Strategic Collision: Similarities & Divergences
Micron pursues broad market penetration with a scale-driven, diversified portfolio, while NVE operates a focused, innovation-led model centered on spintronics. Their primary battleground lies in specialized semiconductor components for industrial and IoT markets. Investors face contrasting profiles: Micron’s vast market footprint versus NVE’s specialized technology with distinct risk-reward dynamics.
Income Statement Comparison
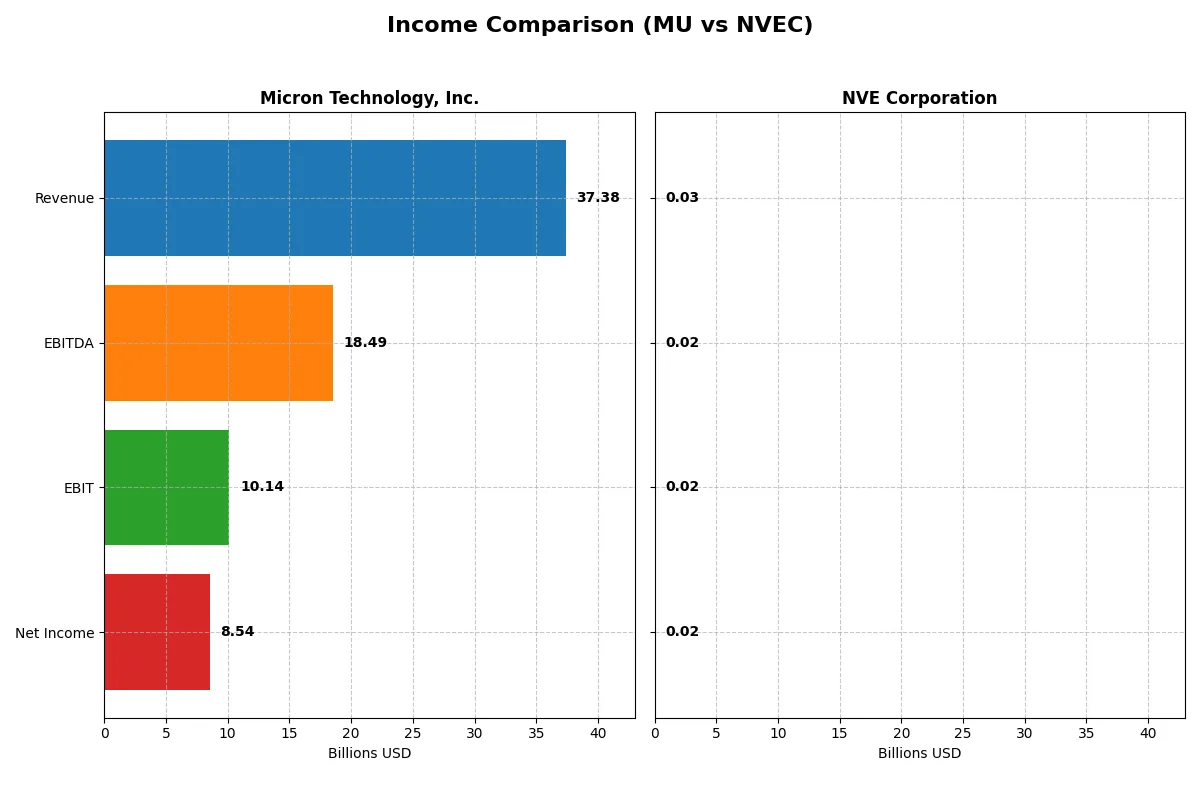
The following data dissects the core profitability and scalability of both corporate engines to reveal who dominates the bottom line:
| Metric | Micron Technology, Inc. (MU) | NVE Corporation (NVEC) |
|---|---|---|
| Revenue | 37.4B | 25.9M |
| Cost of Revenue | 22.5B | 4.2M |
| Operating Expenses | 5.0B | 5.6M |
| Gross Profit | 14.9B | 21.6M |
| EBITDA | 18.5B | 16.3M |
| EBIT | 10.1B | 16.0M |
| Interest Expense | 477M | 0 |
| Net Income | 8.5B | 15.1M |
| EPS | 7.65 | 3.12 |
| Fiscal Year | 2025 | 2025 |
Income Statement Analysis: The Bottom-Line Duel
The following income statement comparison uncovers which company drives superior operational efficiency and profitability in their respective industries.
Micron Technology, Inc. Analysis
Micron’s revenue surged from 15.5B in 2023 to 37.4B in 2025, reflecting robust growth. Net income soared from a loss of 5.8B in 2023 to 8.5B in 2025, signaling a remarkable turnaround. Its gross margin expanded to 39.8%, and net margin reached 22.8%, demonstrating strong margin recovery and operational leverage in the latest fiscal year.
NVE Corporation Analysis
NVE’s revenue declined 13.2% year-over-year to 25.9M in 2025 after peaking at 38.3M in 2023. Despite declining top line, net income remained resilient at 15.1M, supporting a high net margin of 58.2%. NVE sustains an impressive gross margin of 83.6%, though recent contraction in revenue and earnings signals pressure on growth momentum.
Margin Power vs. Revenue Scale
Micron excels with rapid revenue expansion and margin improvement, turning losses into strong profits. NVE maintains exceptional margins but faces top-line and earnings declines. For investors, Micron’s aggressive growth profile offers potential upside, while NVE provides a stable, high-margin but less dynamic earnings stream.
Financial Ratios Comparison
These vital ratios act as a diagnostic tool to expose the underlying fiscal health, valuation premiums, and capital efficiency of the companies compared below:
| Ratios | Micron Technology, Inc. (MU) | NVE Corporation (NVEC) |
|---|---|---|
| ROE | 15.8% | 24.2% |
| ROIC | 12.1% | 21.1% |
| P/E | 15.9 | 20.5 |
| P/B | 2.51 | 4.95 |
| Current Ratio | 2.52 | 28.40 |
| Quick Ratio | 1.79 | 22.03 |
| D/E | 0.28 | 0.01 |
| Debt-to-Assets | 18.5% | 1.43% |
| Interest Coverage | 20.7 | N/A |
| Asset Turnover | 0.45 | 0.40 |
| Fixed Asset Turnover | 0.79 | 8.91 |
| Payout ratio | 6.1% | 128.4% |
| Dividend yield | 0.38% | 6.28% |
| Fiscal Year | 2025 | 2025 |
Efficiency & Valuation Duel: The Vital Signs
Financial ratios act as a company’s DNA, exposing hidden risks and highlighting operational excellence critical for informed investment decisions.
Micron Technology, Inc.
Micron posts a robust 15.76% ROE and a healthy 22.84% net margin, signaling effective profitability. Its P/E of 15.94 and P/B of 2.51 suggest a fairly valued stock, neither cheap nor expensive. Shareholders receive a modest 0.38% dividend yield, while the firm reinvests heavily in R&D to drive growth, reflecting a balanced capital allocation.
NVE Corporation
NVE shines with a strong 24.19% ROE and an exceptional 58.22% net margin, indicating superior profitability. The P/E stands at 20.46, marking a neutral valuation, but a high P/B of 4.95 flags potential overvaluation. NVE offers a notable 6.28% dividend yield, combining income with reinvestment in innovation, supporting sustained shareholder returns.
Premium Profitability vs. Balanced Valuation
NVE delivers higher profitability and stronger dividend income but trades at a stretched price-to-book ratio, increasing valuation risk. Micron offers solid returns and a more moderate valuation profile, balancing risk and reward. Investors seeking growth with income may prefer NVE, while those favoring valuation discipline might lean toward Micron.
Which one offers the Superior Shareholder Reward?
I compare Micron Technology (MU) and NVE Corporation (NVEC) on dividends, payout ratios, and buybacks to identify superior shareholder reward. MU pays a modest 0.38% yield with a low 6.1% payout ratio, signaling ample free cash flow retention for growth. NVEC offers a hefty 6.28% yield but with payout ratios exceeding 100%, raising sustainability concerns. Buybacks appear limited for both, but MU’s conservative dividend payout and strong free cash flow coverage suggest a balanced capital allocation. NVEC’s aggressive dividend and payout ratios hint at riskier distributions. I conclude MU provides a more sustainable, attractive total return profile for 2026 investors.
Comparative Score Analysis: The Strategic Profile
The radar chart reveals the fundamental DNA and trade-offs of Micron Technology and NVE Corporation, highlighting their financial strengths and vulnerabilities:
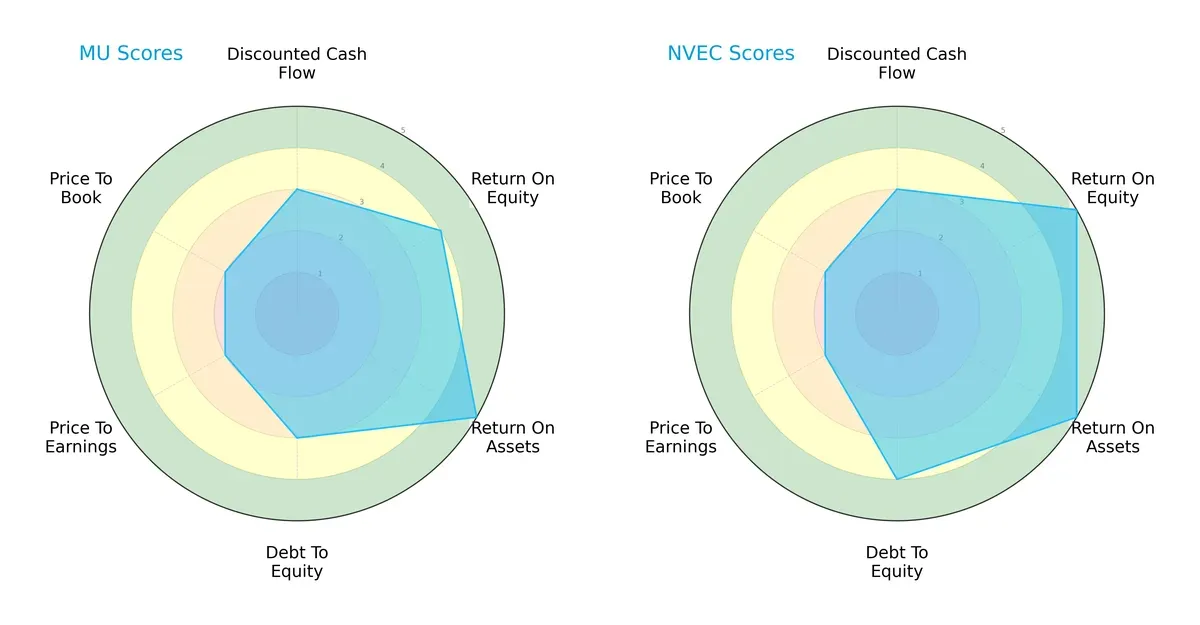
NVE Corporation presents a more balanced profile with superior overall (4 vs. 3), ROE (5 vs. 4), and debt-to-equity scores (4 vs. 3), reflecting efficient capital management and lower financial risk. Micron excels in return on assets (5 vs. 5 tied) but lags in valuation metrics (PE and PB at 2 vs. 2 tied). NVE leans on a stronger equity return and safer leverage, whereas Micron relies on operational efficiency.
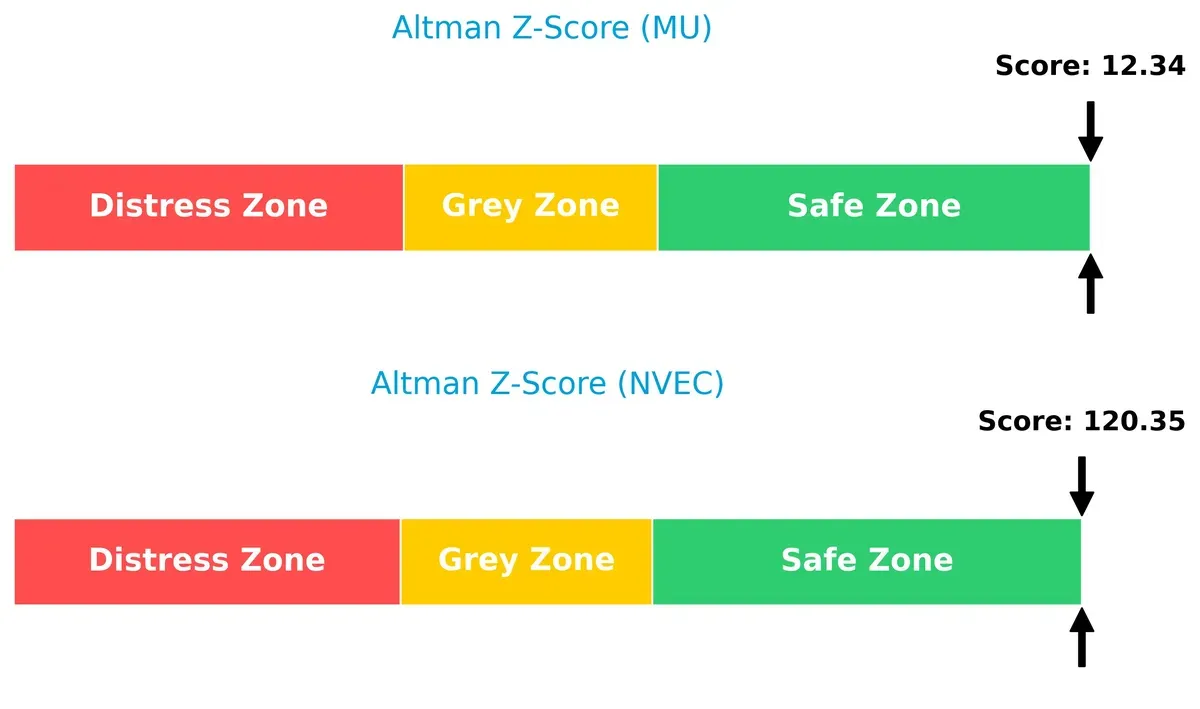
Bankruptcy Risk: Solvency Showdown
The Altman Z-Score gap shows both firms are in the safe zone, but NVE’s exceptionally high score (120.35 vs. 12.34) signals overwhelming financial stability and negligible bankruptcy risk in this cycle:
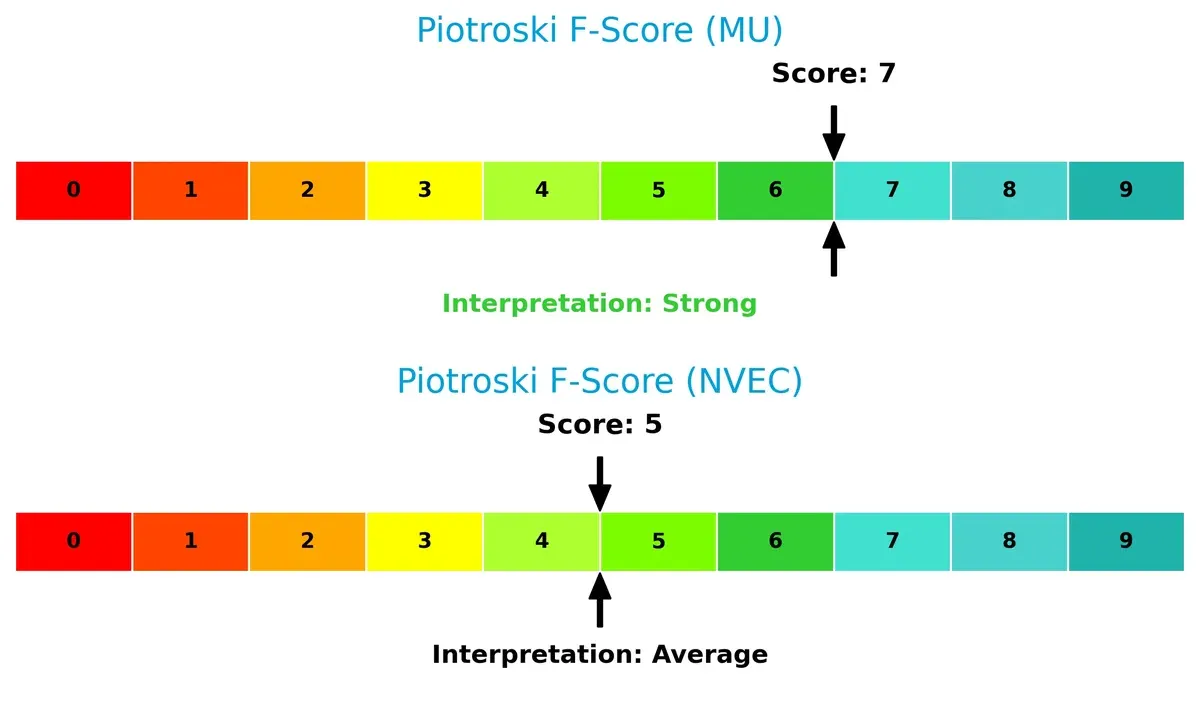
Financial Health: Quality of Operations
Micron’s Piotroski F-score (7) indicates stronger financial health compared to NVE’s average score (5), suggesting Micron maintains higher-quality operations and fewer internal red flags:
How are the two companies positioned?
This section dissects the operational DNA of Micron Technology and NVE Corporation by comparing their revenue distribution by segment and internal dynamics. The goal is to confront their economic moats to identify which model offers the most resilient competitive advantage today.
Revenue Segmentation: The Strategic Mix
The following visual comparison dissects how Micron Technology and NVE Corporation diversify their income streams and where their primary sector bets lie:
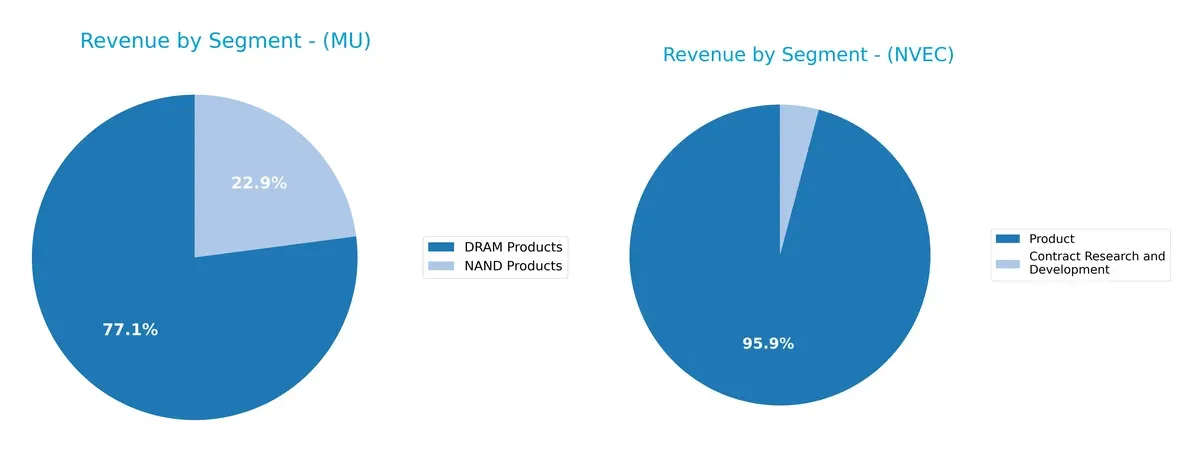
Micron Technology anchors its revenue in DRAM Products at $28.6B, dwarfing its NAND segment at $8.5B, signaling a heavy reliance on memory chips. NVE Corporation pivots on its Product segment with $25.9M, while Contract Research remains marginal at $1.1M. Micron’s concentration in DRAM exposes it to cycle volatility but leverages infrastructure dominance. NVE’s narrower focus reflects specialization risk yet benefits from targeted innovation in specialized components.
Strengths and Weaknesses Comparison
This table compares the Strengths and Weaknesses of Micron Technology, Inc. and NVE Corporation:
MU Strengths
- Diversified product segments including DRAM and NAND
- Favorable net margin at 22.8%
- Strong ROE at 15.8%
- Solid current and quick ratios indicating liquidity
- Low debt-to-assets at 18.5%
- Significant US and Taiwan revenue
NVEC Strengths
- High net margin at 58.2%
- Strong ROE at 24.2% and ROIC at 21.1%
- Excellent fixed asset turnover at 8.9
- Minimal debt levels
- Favorable interest coverage
- Global sales presence across US, Europe, Asia Pacific
MU Weaknesses
- ROIC below WACC indicating capital inefficiency
- Asset turnover ratios unfavorable
- Low dividend yield at 0.38%
- Market concentration in US and Taiwan
- Moderate price-to-book ratio
NVEC Weaknesses
- Unfavorable price-to-book ratio near 5
- Extremely high current ratio at 28.4 possibly reflecting inefficiency
- Asset turnover slightly low at 0.4
- Neutral dividend yield at 6.3%
- Limited product diversification
The comparison reveals Micron’s strength in diversified product categories and balanced financial health but shows capital allocation challenges. NVE excels in profitability and asset utilization yet faces risks from liquidity inefficiencies and valuation concerns. This dynamic highlights contrasting strategic focuses in profitability versus operational efficiency.
The Moat Duel: Analyzing Competitive Defensibility
A structural moat is the only reliable barrier protecting long-term profits from relentless competitive pressure and market erosion:
Micron Technology, Inc.: Cost Advantage Fortress
Micron’s moat stems from scale-driven cost advantages in semiconductor memory manufacturing. It shows stable margins near 40% gross and growing profitability despite ROIC lagging WACC. Expansion into cloud and automotive memory markets could deepen its competitive edge in 2026.
NVE Corporation: Specialized Intangible Asset Moat
NVE leverages proprietary spintronic technology, creating a unique intangible asset moat. It delivers exceptional margins above 80% gross and ROIC well above WACC, signaling strong value creation. Innovation in IoT and medical sensors positions it for selective market disruption.
Capital Efficiency vs. Technological Uniqueness: The Moat Face-Off
NVE holds a deeper moat evidenced by a ROIC exceeding WACC by over 11%, compared to Micron’s ROIC below WACC. NVE’s specialized tech and growing profitability better defend market share against competition than Micron’s cost advantage, which faces margin pressure despite scale.
Which stock offers better returns?
The past year shows divergent trajectories: Micron Technology’s stock soared sharply while NVE Corporation declined overall despite recent mild gains.
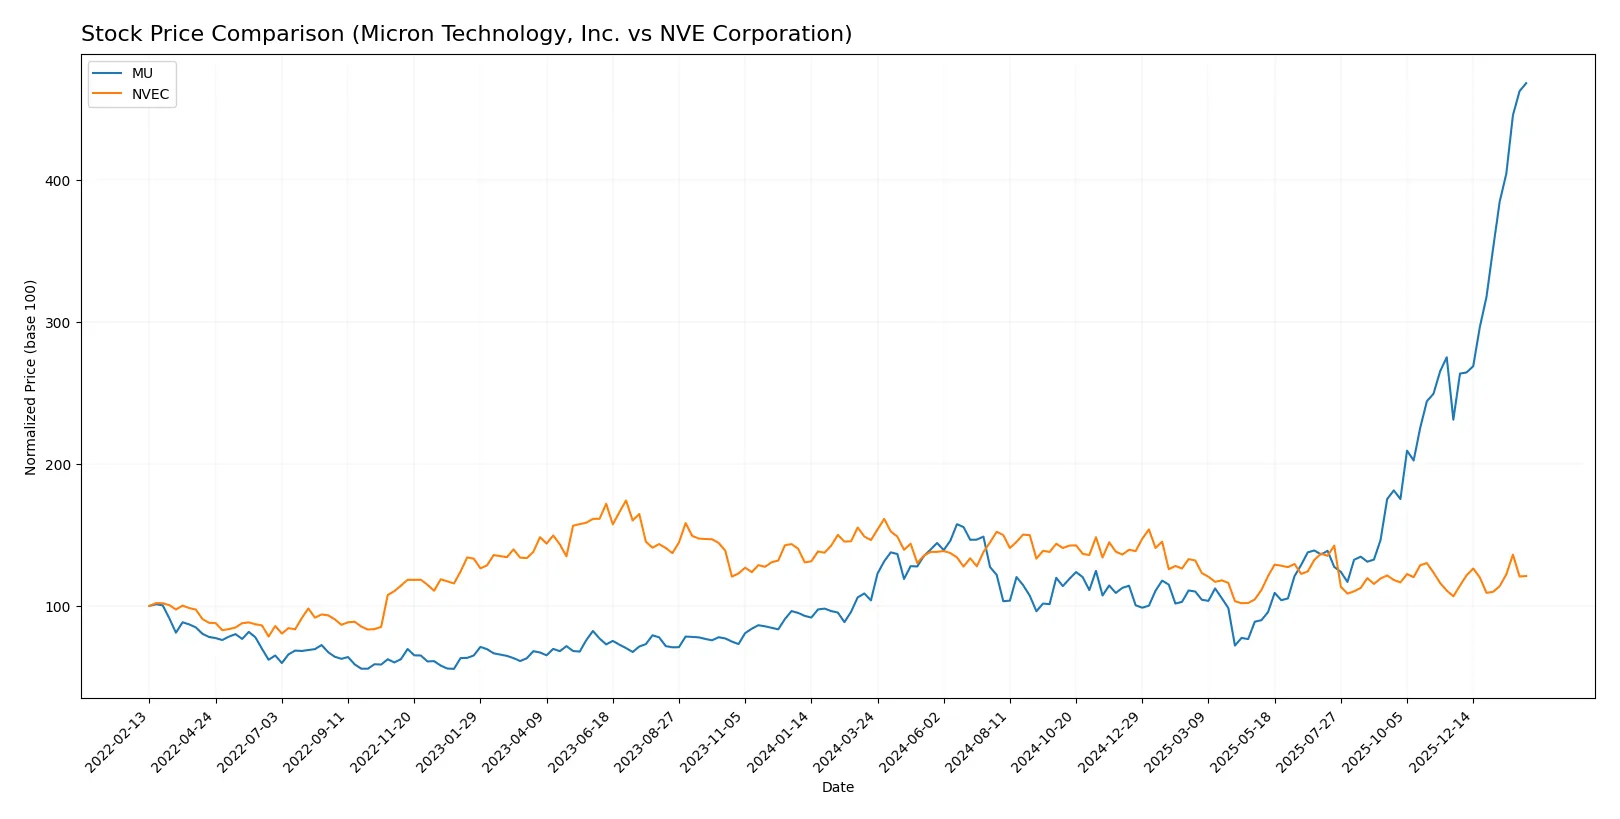
Trend Comparison
Micron Technology’s stock surged 350.32% over 12 months, marking a bullish trend with accelerating momentum and a high volatility of 75.39. It peaked at 419.93 and bottomed at 64.72.
NVE Corporation’s stock fell 17.27% over the same period, indicating a bearish trend despite accelerating decline. Volatility remained low at 7.54, with a high of 90.18 and low of 56.99.
Micron delivered a significantly stronger market performance compared to NVE, reversing trends with a sharp upward acceleration while NVE stayed bearish overall.
Target Prices
Analysts presenting verified targets see a wide valuation range for Micron Technology, Inc.
| Company | Target Low | Target High | Consensus |
|---|---|---|---|
| Micron Technology, Inc. | 190 | 480 | 345.61 |
The target consensus at $345.61 sits below the current price of $418.10, suggesting cautious optimism. No verified target price data is available from recognized analysts for NVE Corporation.

Don’t Let Luck Decide Your Entry Point
Optimize your entry points with our advanced ProRealTime indicators. You’ll get efficient buy signals with precise price targets for maximum performance. Start outperforming now!
How do institutions grade them?
The following summarizes the latest institutional grades for both companies:
Micron Technology, Inc. Grades
This table lists recent grades issued by reputable financial institutions for Micron Technology, Inc.:
| Grading Company | Action | New Grade | Date |
|---|---|---|---|
| Mizuho | Maintain | Outperform | 2026-01-27 |
| Stifel | Maintain | Buy | 2026-01-20 |
| Rosenblatt | Maintain | Buy | 2026-01-20 |
| TD Cowen | Maintain | Buy | 2026-01-20 |
| Citigroup | Maintain | Buy | 2026-01-15 |
| Wells Fargo | Maintain | Overweight | 2026-01-15 |
| Cantor Fitzgerald | Maintain | Overweight | 2026-01-14 |
| Keybanc | Maintain | Overweight | 2026-01-13 |
| B of A Securities | Maintain | Buy | 2026-01-13 |
| Lynx Global | Maintain | Buy | 2026-01-12 |
NVE Corporation Grades
No reliable institutional grades are available for NVE Corporation at this time.
Which company has the best grades?
Micron Technology, Inc. consistently receives positive grades ranging from Overweight to Outperform. In contrast, NVE Corporation lacks institutional grading data. Investors might view Micron’s broad analyst support as a sign of confidence and liquidity.
Risks specific to each company
The following categories identify the critical pressure points and systemic threats facing both firms in the 2026 market environment:
1. Market & Competition
Micron Technology, Inc.
- Faces fierce competition from large semiconductor players with aggressive pricing and innovation cycles.
NVE Corporation
- Operates in a niche spintronics segment but competes with emerging nanotech firms and substitutes in IoT sensors.
2. Capital Structure & Debt
Micron Technology, Inc.
- Maintains a conservative debt-to-equity ratio of 0.28, supporting financial flexibility and low leverage risk.
NVE Corporation
- Extremely low debt burden with 0.01 debt-to-equity, minimizing financial risk and interest obligations.
3. Stock Volatility
Micron Technology, Inc.
- Exhibits high beta of 1.505, indicating elevated sensitivity to market swings and sector cyclicality.
NVE Corporation
- Lower beta of 1.219 reflects relatively moderate stock volatility and less market sensitivity.
4. Regulatory & Legal
Micron Technology, Inc.
- Subject to stringent global semiconductor export controls and IP litigation risks amid geopolitical tensions.
NVE Corporation
- Faces regulatory scrutiny in specialized medical and industrial sensor markets but with fewer broad geopolitical impacts.
5. Supply Chain & Operations
Micron Technology, Inc.
- Vulnerable to supply chain disruptions due to complex global sourcing and capital-intensive manufacturing.
NVE Corporation
- Benefits from simpler manufacturing but depends on specialized suppliers for spintronic materials.
6. ESG & Climate Transition
Micron Technology, Inc.
- Increasing pressure to reduce carbon footprint in energy-intensive fabs and improve resource efficiency.
NVE Corporation
- Smaller footprint but must comply with ESG standards in medical and industrial markets; transition risk moderate.
7. Geopolitical Exposure
Micron Technology, Inc.
- High exposure to US-China tensions impacting semiconductor supply and trade policies.
NVE Corporation
- Limited direct geopolitical risks but potential indirect effects through global technology licensing.
Which company shows a better risk-adjusted profile?
Micron’s principal risk lies in market competition and supply chain complexity, amplified by geopolitical tensions. NVE’s critical risk is its niche market dependency and valuation volatility. I find NVE offers a superior risk-adjusted profile due to stronger profitability, lower leverage, and manageable operational risks, despite a less robust Piotroski score. Notably, NVE’s Altman Z-score vastly exceeds safe thresholds, underscoring its financial stability.
Final Verdict: Which stock to choose?
Micron Technology, Inc. impresses with its robust income growth and operational efficiency, making it a formidable cash generator in the semiconductor space. Its main point of vigilance lies in a slightly unfavorable ROIC versus WACC dynamic, signaling caution on capital efficiency. This stock suits aggressive growth portfolios willing to tolerate cyclical swings.
NVE Corporation’s strategic moat shines in its durable competitive advantage, reflected by a very favorable ROIC exceeding its cost of capital and exceptional profitability margins. It offers a safer financial profile than Micron, supported by a rock-solid balance sheet. NVE fits well in GARP portfolios seeking stability with growth potential.
If you prioritize aggressive growth and can weather semiconductor cyclicality, Micron Technology stands out due to its strong momentum and improving profitability. However, if you seek a company with a durable moat and better capital efficiency, NVE Corporation offers safer stability and superior long-term value creation, despite a more modest recent price trend.
Disclaimer: Investment carries a risk of loss of initial capital. The past performance is not a reliable indicator of future results. Be sure to understand risks before making an investment decision.
Go Further
I encourage you to read the complete analyses of Micron Technology, Inc. and NVE Corporation to enhance your investment decisions: