The semiconductor industry stands at the forefront of technological innovation, shaping the future of computing and electronics. Micron Technology, Inc. (MU) and Nova Ltd. (NVMI) are two key players in this dynamic sector, with Micron focusing on advanced memory and storage solutions, while Nova specializes in precision process control systems for semiconductor manufacturing. This comparison explores their market positions and innovation strategies to help investors identify the most promising opportunity.

Table of contents
Companies Overview
I will begin the comparison between Micron Technology, Inc. and Nova Ltd. by providing an overview of these two companies and their main differences.
Micron Technology, Inc. Overview
Micron Technology, Inc., headquartered in Boise, Idaho, is a leading player in the semiconductor industry specializing in the design, manufacture, and sale of memory and storage products globally. Its diverse product range includes DRAM, NAND, and NOR memory technologies used across cloud servers, enterprise, mobile devices, and automotive markets. Founded in 1978, Micron serves multiple sectors through direct sales and distribution channels.
Nova Ltd. Overview
Nova Ltd., based in Rehovot, Israel, focuses on designing, developing, and producing process control systems for semiconductor manufacturing. Its offerings include metrology platforms for various process steps such as lithography and etch, serving integrated circuit manufacturers worldwide. Founded in 1993, Nova supports logic, foundry, and memory sectors with advanced measurement technologies critical to semiconductor fabrication.
Key similarities and differences
Both companies operate in the semiconductor industry but focus on different segments: Micron concentrates on memory and storage products, while Nova specializes in process control systems for semiconductor manufacturing. Micron has a significantly larger workforce and market capitalization compared to Nova. Both are publicly traded on NASDAQ, but Micron targets broader end markets including consumer and automotive, whereas Nova primarily serves semiconductor manufacturers with specialized metrology solutions.
Income Statement Comparison
This table presents a side-by-side comparison of the key income statement metrics for Micron Technology, Inc. and Nova Ltd. based on their most recent fiscal year data.

| Metric | Micron Technology, Inc. (MU) | Nova Ltd. (NVMI) |
|---|---|---|
| Market Cap | 373B | 12.2B |
| Revenue | 37.4B | 672M |
| EBITDA | 18.5B | 205M |
| EBIT | 10.1B | 188M |
| Net Income | 8.54B | 185M |
| EPS | 7.65 | 6.31 |
| Fiscal Year | 2025 | 2024 |
Income Statement Interpretations
Micron Technology, Inc.
Micron Technology exhibited a strong upward trend from 2021 to 2025, with revenue growing from $27.7B to $37.4B and net income rising significantly from $5.9B to $8.5B. Margins improved notably, with a gross margin near 40% and net margin at 22.8%. The latest fiscal year showed robust revenue growth of 48.9% and a remarkable 637% net margin increase, highlighting sustained profitability improvement.
Nova Ltd.
Nova Ltd. demonstrated consistent revenue growth from $269M in 2020 to $672M in 2024, with net income expanding from $48M to $184.9M. Gross margin remained high at 57.6%, and net margin stayed strong at 27.3%. The most recent year reported a 29.8% revenue increase and a modest 3.8% net margin growth, reflecting steady operational efficiency amid expanding scale.
Which one has the stronger fundamentals?
Both companies display favorable income statement fundamentals with solid margin improvements and income growth. Micron excels in scale and recent rapid profitability gains, while Nova shows impressive margin stability and consistent growth over the period. Micron’s higher revenue base contrasts with Nova’s superior gross and net margins, indicating each has strengths suited to different investment focuses.
Financial Ratios Comparison
Below is a comparison table of key financial ratios for Micron Technology, Inc. (MU) and Nova Ltd. (NVMI) based on the most recent fiscal year data available.
| Ratios | Micron Technology, Inc. (2025) | Nova Ltd. (2024) |
|---|---|---|
| ROE | 15.8% | 19.8% |
| ROIC | 12.1% | 13.4% |
| P/E | 15.9 | 31.2 |
| P/B | 2.51 | 6.18 |
| Current Ratio | 2.52 | 2.32 |
| Quick Ratio | 1.79 | 1.92 |
| D/E (Debt-to-Equity) | 0.28 | 0.25 |
| Debt-to-Assets | 18.5% | 17.0% |
| Interest Coverage | 20.7 | 116.2 |
| Asset Turnover | 0.45 | 0.48 |
| Fixed Asset Turnover | 0.79 | 5.06 |
| Payout Ratio | 6.1% | 0% |
| Dividend Yield | 0.38% | 0% |
Interpretation of the Ratios
Micron Technology, Inc.
Micron shows a generally favorable financial profile with strong net margin (22.84%), ROE (15.76%), and ROIC (12.12%). The company maintains a solid liquidity position, evidenced by a current ratio of 2.52, and low leverage with debt-to-equity at 0.28. Concerns include a high WACC (10.52%) and weak asset turnover ratios. Micron pays dividends with a modest yield of 0.38%, indicating cautious shareholder returns.
Nova Ltd.
Nova Ltd. displays robust profitability with net margin at 27.33%, ROE at 19.81%, and ROIC at 13.39%, supported by excellent interest coverage (116.2) and fixed asset turnover (5.06). The company’s liquidity and leverage metrics are favorable, though elevated WACC (12.21%) and high valuation multiples (P/E 31.2, P/B 6.18) could raise concerns. Nova currently does not pay dividends, focusing on growth and reinvestment.
Which one has the best ratios?
Both companies show favorable overall ratios, but Nova Ltd. has a higher proportion of favorable metrics (64.29%) compared to Micron’s 57.14%. Nova’s superior profitability and asset efficiency contrast with Micron’s stronger balance sheet stability. However, Nova’s higher valuation and absence of dividends versus Micron’s cautious shareholder returns highlight different financial profiles for investors to consider.
Strategic Positioning
This section compares the strategic positioning of Micron Technology, Inc. and Nova Ltd., including Market position, Key segments, and Exposure to technological disruption:
Micron Technology, Inc.
- Leading global semiconductor manufacturer with significant scale and NASDAQ listing, facing high competitive pressure.
- Diverse product portfolio including DRAM, NAND, NOR memory, and multiple business units serving cloud, mobile, automotive, and industrial markets.
- Exposure to disruption through evolving semiconductor memory technologies and demand shifts across computing, mobile, and storage sectors.
Nova Ltd.
- Smaller semiconductor process control systems provider, niche market, NASDAQ listed, with competitive pressures in specialized segments.
- Focused on metrology platforms for semiconductor manufacturing process control, serving logic, foundries, memory manufacturers, and equipment makers.
- Exposure linked to advances in semiconductor manufacturing processes and evolving metrology technology requirements.
Micron Technology, Inc. vs Nova Ltd. Positioning
Micron pursues a diversified strategy across multiple memory and storage segments, providing broad market exposure but facing intense competition. Nova concentrates on process control metrology, offering specialized solutions within semiconductor manufacturing, which may limit scale but targets high-precision niches.
Which has the best competitive advantage?
Both companies show slightly favorable MOAT evaluations with growing ROIC trends but currently are shedding value relative to WACC. Neither demonstrates a clear competitive advantage yet, although improving profitability suggests potential strengthening of their positions.
Stock Comparison
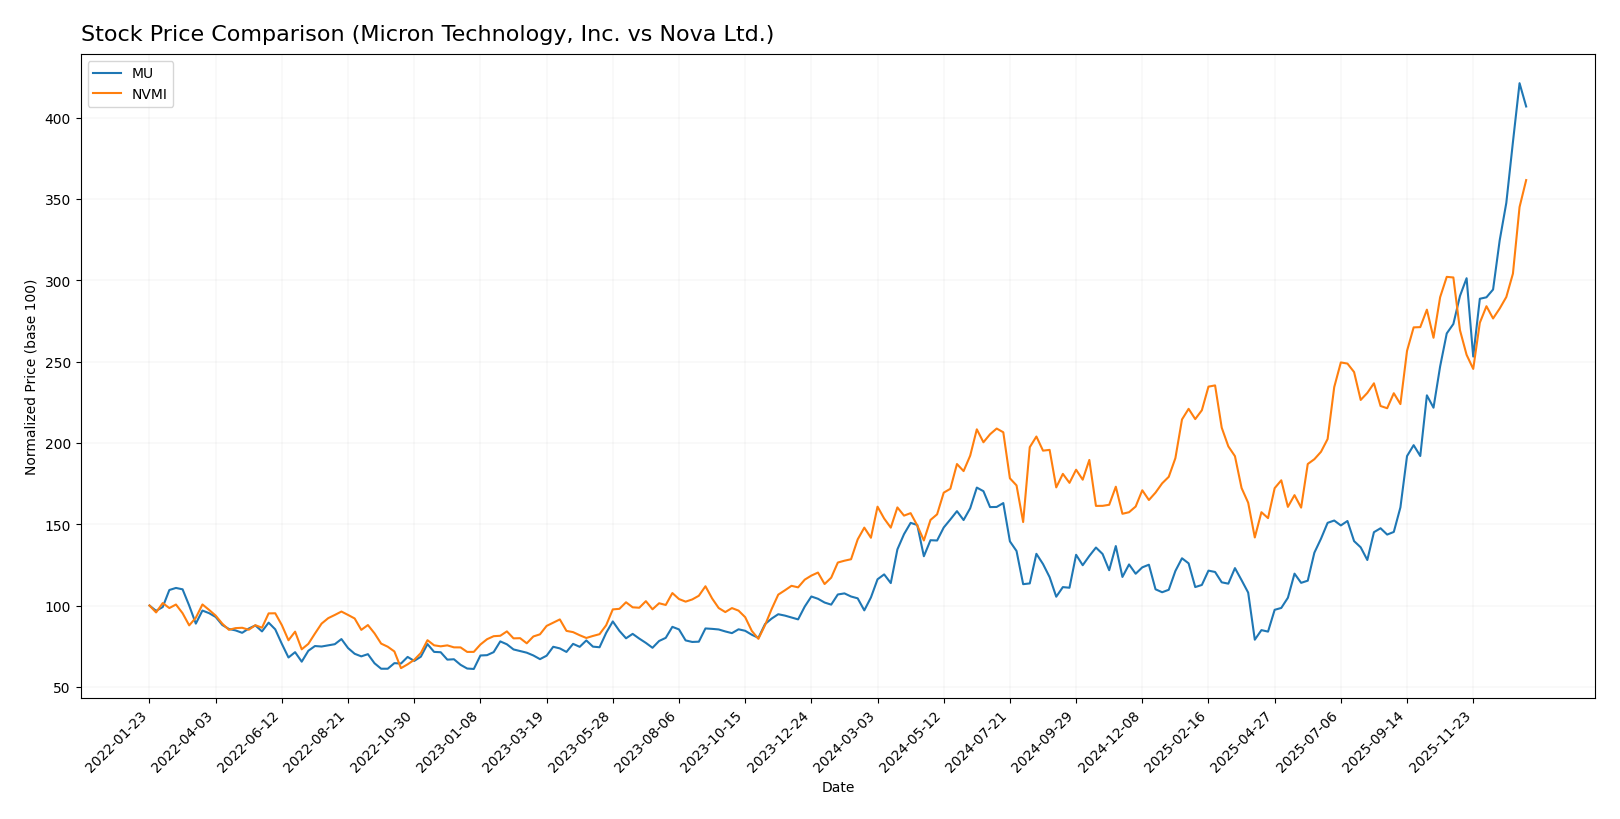
The stock price movements of Micron Technology, Inc. (MU) and Nova Ltd. (NVMI) over the past 12 months reveal significant bullish trends, with MU exhibiting stronger acceleration and higher volatility compared to NVMI.
Trend Analysis
Micron Technology, Inc. (MU) recorded a 287.62% price increase over the past year, indicating a strong bullish trend with accelerating momentum. The stock displayed notable volatility, with a standard deviation of 57.56, and ranged from a low of 64.72 to a high of 345.09.
Nova Ltd. (NVMI) showed a 155.25% price increase during the same period, also reflecting a bullish trend with acceleration. Its price volatility was slightly lower than MU’s, with a standard deviation of 55.12, fluctuating between 159.92 and 413.04.
Comparing both stocks, MU delivered the highest market performance with a significantly larger price increase and stronger recent buyer dominance, outperforming NVMI over the analyzed 12-month period.
Target Prices
Here is the consensus target price overview from verified analysts for the semiconductor sector.
| Company | Target High | Target Low | Consensus |
|---|---|---|---|
| Micron Technology, Inc. | 450 | 190 | 328.22 |
| Nova Ltd. | 390 | 335 | 362.5 |
Analysts expect Micron’s price to modestly exceed the current $333.35, while Nova’s target consensus at $362.5 is below its current $413.04, indicating mixed outlooks.
Analyst Opinions Comparison
This section compares analysts’ ratings and grades for Micron Technology, Inc. (MU) and Nova Ltd. (NVMI):
Rating Comparison
MU Rating
- Rated B, considered very favorable overall.
- Discounted Cash Flow Score is 1, indicating a very unfavorable valuation.
- Return on Equity Score is 4, showing favorable profit generation efficiency.
- Return on Assets Score is 5, reflecting very favorable asset utilization.
- Debt To Equity Score is 3, representing moderate financial risk.
- Overall Score is 3, reflecting a moderate overall financial standing.
NVMI Rating
- Rated B-, also considered very favorable overall.
- Discounted Cash Flow Score is 3, indicating a moderate valuation.
- Return on Equity Score is 4, similarly favorable in profit generation.
- Return on Assets Score is 5, equally very favorable in asset utilization.
- Debt To Equity Score is 1, indicating very unfavorable financial risk.
- Overall Score is 3, also reflecting a moderate overall financial standing.
Which one is the best rated?
Both MU and NVMI share a moderate overall score of 3, but MU holds a slightly better rating of B compared to B- for NVMI. MU scores lower on discounted cash flow but has a stronger debt-to-equity standing, whereas NVMI shows better discounted cash flow but higher financial risk.
Scores Comparison
Here is a comparison of the Altman Z-Score and Piotroski Score for Micron Technology and Nova Ltd.:
MU Scores
- Altman Z-Score: 10.50, indicating a safe zone.
- Piotroski Score: 7, representing strong financial health.
NVMI Scores
- Altman Z-Score: 7.76, indicating a safe zone.
- Piotroski Score: 7, representing strong financial health.
Which company has the best scores?
Both MU and NVMI have Altman Z-Scores in the safe zone, with MU scoring higher at 10.50 versus 7.76 for NVMI. Both have identical Piotroski Scores of 7, indicating strong financial health for both companies.
Grades Comparison
The following is a comparison of the latest grades assigned to Micron Technology, Inc. and Nova Ltd. by reputable grading companies:
Micron Technology, Inc. Grades
This table displays recent grades from established financial institutions for Micron Technology, Inc.:
| Grading Company | Action | New Grade | Date |
|---|---|---|---|
| Keybanc | Maintain | Overweight | 2026-01-13 |
| B of A Securities | Maintain | Buy | 2026-01-13 |
| Lynx Global | Maintain | Buy | 2026-01-12 |
| Mizuho | Maintain | Outperform | 2026-01-09 |
| UBS | Maintain | Buy | 2026-01-07 |
| Piper Sandler | Maintain | Overweight | 2026-01-07 |
| Piper Sandler | Maintain | Overweight | 2025-12-18 |
| Barclays | Maintain | Overweight | 2025-12-18 |
| Keybanc | Maintain | Overweight | 2025-12-18 |
| Wolfe Research | Maintain | Outperform | 2025-12-18 |
Micron Technology’s grades consistently show positive sentiment with multiple “Buy,” “Overweight,” and “Outperform” ratings, indicating strong analyst confidence.
Nova Ltd. Grades
This table shows recent grades given to Nova Ltd. by recognized grading firms:
| Grading Company | Action | New Grade | Date |
|---|---|---|---|
| B of A Securities | Maintain | Buy | 2026-01-13 |
| Jefferies | Maintain | Buy | 2025-12-15 |
| Evercore ISI Group | Maintain | Outperform | 2025-11-07 |
| Benchmark | Maintain | Buy | 2025-11-07 |
| Cantor Fitzgerald | Maintain | Overweight | 2025-06-24 |
| B of A Securities | Maintain | Buy | 2025-06-24 |
| Benchmark | Maintain | Buy | 2025-05-09 |
| Citigroup | Maintain | Buy | 2025-05-09 |
| B of A Securities | Maintain | Buy | 2025-04-16 |
| Cantor Fitzgerald | Maintain | Overweight | 2025-03-14 |
Nova Ltd. also enjoys a predominantly positive consensus with many “Buy,” “Overweight,” and “Outperform” ratings reflecting steady analyst support.
Which company has the best grades?
Both Micron Technology, Inc. and Nova Ltd. have received strong and consistent positive grades, primarily “Buy,” “Overweight,” and “Outperform.” Micron shows a higher volume of recent ratings, while Nova’s grades span a longer timeframe. This sustained confidence from analysts may influence investor sentiment and portfolio considerations.
Strengths and Weaknesses
Below is a comparison of the key strengths and weaknesses of Micron Technology, Inc. (MU) and Nova Ltd. (NVMI) based on their most recent financial and operational data:
| Criterion | Micron Technology, Inc. (MU) | Nova Ltd. (NVMI) |
|---|---|---|
| Diversification | High: Diverse memory products including DRAM and NAND segments generating $37B+ in revenue | Low: Single product line with revenue around $538M in 2024 |
| Profitability | Favorable net margin of 22.8%, ROE 15.8%, ROIC 12.1% | Higher profitability: net margin 27.3%, ROE 19.8%, ROIC 13.4% |
| Innovation | Moderate: Growing ROIC trend but no strong moat yet | Moderate: Strong ROIC growth but shedding value, no moat established |
| Global presence | Strong: Major player in global semiconductor market | Limited: Smaller scale, niche product focus |
| Market Share | Large market share in memory products | Small market share, emerging company |
Key takeaways: Both companies show growing profitability and ROIC trends, indicating improving operational efficiency. Micron benefits from strong diversification and global scale, while Nova has higher margins but limited product breadth. Neither currently demonstrates a strong economic moat, suggesting cautious optimism for investors.
Risk Analysis
Below is a risk comparison table for Micron Technology, Inc. (MU) and Nova Ltd. (NVMI) based on the most recent available data:
| Metric | Micron Technology, Inc. (MU) | Nova Ltd. (NVMI) |
|---|---|---|
| Market Risk | Beta 1.50, moderate volatility | Beta 1.83, higher volatility |
| Debt level | Debt/Equity 0.28, moderate and manageable | Debt/Equity 0.25, low but with weaker rating |
| Regulatory Risk | US tech sector regulatory scrutiny | Exposure to multiple jurisdictions including Israel and US |
| Operational Risk | Large scale manufacturing complexity, 48K employees | Smaller scale, niche semiconductor metrology focus, 1.2K employees |
| Environmental Risk | Semiconductor manufacturing environmental impact | Similar industry risks, but smaller footprint |
| Geopolitical Risk | US-China trade tensions impact supply chain | Exposure to geopolitical tensions in Middle East and Asia |
The most likely and impactful risks are market volatility and geopolitical tensions. MU faces moderate market risk with a beta of 1.5 and operational complexity due to its size, while NVMI’s higher beta of 1.83 indicates greater stock price volatility. NVMI’s geopolitical risk is heightened by its base in Israel and operations in Asia, which could affect supply chains. Both companies maintain manageable debt levels, but NVMI’s stronger interest coverage contrasts with a weaker debt-to-equity rating signaling caution. Investors should weigh these risks carefully in portfolio decisions.
Which Stock to Choose?
Micron Technology, Inc. (MU) shows a strongly favorable income evolution with 48.85% revenue growth in 2025, robust profitability metrics, a moderate debt level with a net debt to EBITDA of 0.30, and a very favorable overall rating of B. Its financial ratios indicate strength in profitability and liquidity, though some asset turnover measures appear less favorable.
Nova Ltd. (NVMI) exhibits favorable income growth of 29.83% in 2024, high profitability with a net margin of 27.33%, and a low debt-to-equity ratio despite some unfavorable valuation ratios. The company holds a very favorable rating of B- and demonstrates improving financial strength and liquidity.
Investors focused on growth might find Nova Ltd. appealing due to its higher return on equity and strong income growth trajectory, whereas those prioritizing stability and solid profitability could view Micron Technology’s consistent favorable financial ratios and safer debt profile as more suitable. Both companies show slightly favorable moats with growing ROIC, indicating increasing profitability.
Disclaimer: Investment carries a risk of loss of initial capital. The past performance is not a reliable indicator of future results. Be sure to understand risks before making an investment decision.
Go Further
I encourage you to read the complete analyses of Micron Technology, Inc. and Nova Ltd. to enhance your investment decisions: