Micron Technology, Inc. (MU) and Monolithic Power Systems, Inc. (MPWR) are two influential players in the semiconductor industry, each driving innovation in memory storage and power electronics, respectively. Their overlapping markets in technology and strategic focus on cutting-edge solutions make them compelling candidates for comparison. In this article, I will analyze both companies to help you identify which presents the most promising investment opportunity in 2026.

Table of contents
Companies Overview
I will begin the comparison between Micron Technology, Inc. and Monolithic Power Systems, Inc. by providing an overview of these two companies and their main differences.
Micron Technology, Inc. Overview
Micron Technology, Inc. designs, manufactures, and sells memory and storage products globally. The company operates through multiple segments including Compute and Networking, Mobile, Storage, and Embedded Business Units. Its product portfolio features DRAM, NAND, and NOR memory technologies serving cloud, enterprise, client, graphics, networking, automotive, industrial, and consumer markets. Founded in 1978, Micron is a major player in the semiconductor industry with a market cap of $373B.
Monolithic Power Systems, Inc. Overview
Monolithic Power Systems, Inc. focuses on semiconductor-based power electronics solutions, particularly DC-to-DC integrated circuits. Its products serve computing, storage, automotive, industrial, communications, and consumer sectors. The company also offers lighting control ICs for LCD backlighting and general illumination. Founded in 1997, Monolithic Power has a market cap of $47B and sells internationally through distributors and direct channels.
Key similarities and differences
Both companies operate within the semiconductor industry and serve diverse technology markets including automotive and consumer electronics. Micron specializes in memory and storage products, while Monolithic Power Systems focuses on power management ICs and lighting control solutions. Micron’s scale is significantly larger with a broader product range, whereas Monolithic Power emphasizes voltage conversion and control technologies with a comparatively smaller workforce.
Income Statement Comparison
This table presents a side-by-side comparison of key income statement metrics for Micron Technology, Inc. and Monolithic Power Systems, Inc. for their most recent fiscal years.

| Metric | Micron Technology, Inc. | Monolithic Power Systems, Inc. |
|---|---|---|
| Market Cap | 373B | 47.1B |
| Revenue | 37.4B | 2.2B |
| EBITDA | 18.5B | 576M |
| EBIT | 10.1B | 539M |
| Net Income | 8.54B | 1.79B |
| EPS | 7.65 | 36.76 |
| Fiscal Year | 2025 | 2024 |
Income Statement Interpretations
Micron Technology, Inc.
Micron Technology’s revenue increased from $27.7B in 2021 to $37.4B in 2025, with net income recovering from a $5.8B loss in 2023 to $8.5B in 2025. Margins improved notably, with a gross margin near 40% and net margin at 22.8% in 2025. The latest year showed strong growth in revenue and profitability, reflecting a favorable turnaround.
Monolithic Power Systems, Inc.
Monolithic Power Systems saw revenue rise steadily from $845M in 2020 to $2.2B in 2024, with net income surging from $164M to $1.79B. Margins remained robust, with a 55.3% gross margin and an exceptionally high net margin of 81% in 2024. Despite a slight unfavorable trend in operating expenses growth, the company maintained strong profitability and margin expansion.
Which one has the stronger fundamentals?
Both companies exhibit favorable income statements with strong revenue and net income growth. Micron shows a powerful recovery and solid margin improvement, while Monolithic Power boasts higher margins and exceptional net income growth. The slight operating expense concern for Monolithic contrasts with Micron’s consistent margin enhancements. Overall, both display strong fundamentals with different strengths in scale and profitability.
Financial Ratios Comparison
Below is a comparison of key financial ratios for Micron Technology, Inc. (MU) and Monolithic Power Systems, Inc. (MPWR) based on their most recent fiscal year data.
| Ratios | Micron Technology, Inc. (2025) | Monolithic Power Systems, Inc. (2024) |
|---|---|---|
| ROE | 15.76% | 56.80% |
| ROIC | 12.12% | 16.22% |
| P/E | 15.94 | 16.09 |
| P/B | 2.51 | 9.14 |
| Current Ratio | 2.52 | 5.31 |
| Quick Ratio | 1.79 | 3.89 |
| D/E (Debt-to-Equity) | 0.28 | 0.005 |
| Debt-to-Assets | 18.45% | 0.44% |
| Interest Coverage | 20.69 | 0 (not available) |
| Asset Turnover | 0.45 | 0.61 |
| Fixed Asset Turnover | 0.79 | 4.17 |
| Payout ratio | 6.11% | 13.47% |
| Dividend yield | 0.38% | 0.84% |
Interpretation of the Ratios
Micron Technology, Inc.
Micron Technology exhibits a majority of favorable financial ratios, including strong net margin (22.84%) and return on equity (15.76%), supported by a solid current ratio of 2.52 and low debt levels. However, asset turnover ratios are relatively weak, and the weighted average cost of capital (WACC) is unfavorable. Dividend yield at 0.38% is low, reflecting modest shareholder returns with stable dividend payouts but limited yield appeal.
Monolithic Power Systems, Inc.
Monolithic Power shows excellent profitability metrics with a very high net margin of 80.95% and return on equity at 56.8%, alongside favorable debt and interest coverage ratios. Its price-to-book ratio is elevated, indicating high market valuation, and the current ratio is less favorable. The dividend yield of 0.84% is modest but supported by steady dividend payments, complementing its strong free cash flow and shareholder returns.
Which one has the best ratios?
Both companies present a favorable overall ratio profile with 57.14% favorable metrics, yet Monolithic Power Systems demonstrates superior profitability and return ratios. Micron has stronger liquidity and leverage metrics but shows weaknesses in asset efficiency. Neither company’s dividend yield is particularly high, reflecting moderate direct shareholder returns in both cases.
Strategic Positioning
This section compares the strategic positioning of Micron Technology, Inc. and Monolithic Power Systems, Inc. regarding market position, key segments, and exposure to technological disruption:
Micron Technology, Inc.
- Leading semiconductor firm with strong market cap facing high competition
- Diverse segments: DRAM, NAND, embedded, mobile, storage products driving revenue
- Operates in mature memory and storage markets, moderate disruption risk
Monolithic Power Systems, Inc.
- Smaller market cap semiconductor company in power electronics sector
- Focused on DC to DC integrated circuits and lighting control ICs
- Exposure to evolving power electronics technologies and applications
Micron Technology, Inc. vs Monolithic Power Systems, Inc. Positioning
Micron’s diversified semiconductor product base contrasts with Monolithic’s concentrated focus on power electronics. Micron benefits from scale and broad market presence, while Monolithic relies on specialized innovation in niche segments, impacting competitive dynamics differently.
Which has the best competitive advantage?
Monolithic Power Systems shows a very favorable moat with higher ROIC above WACC and strong growth, indicating a durable competitive advantage. Micron’s slightly favorable moat reflects improving profitability but no clear enduring advantage yet.
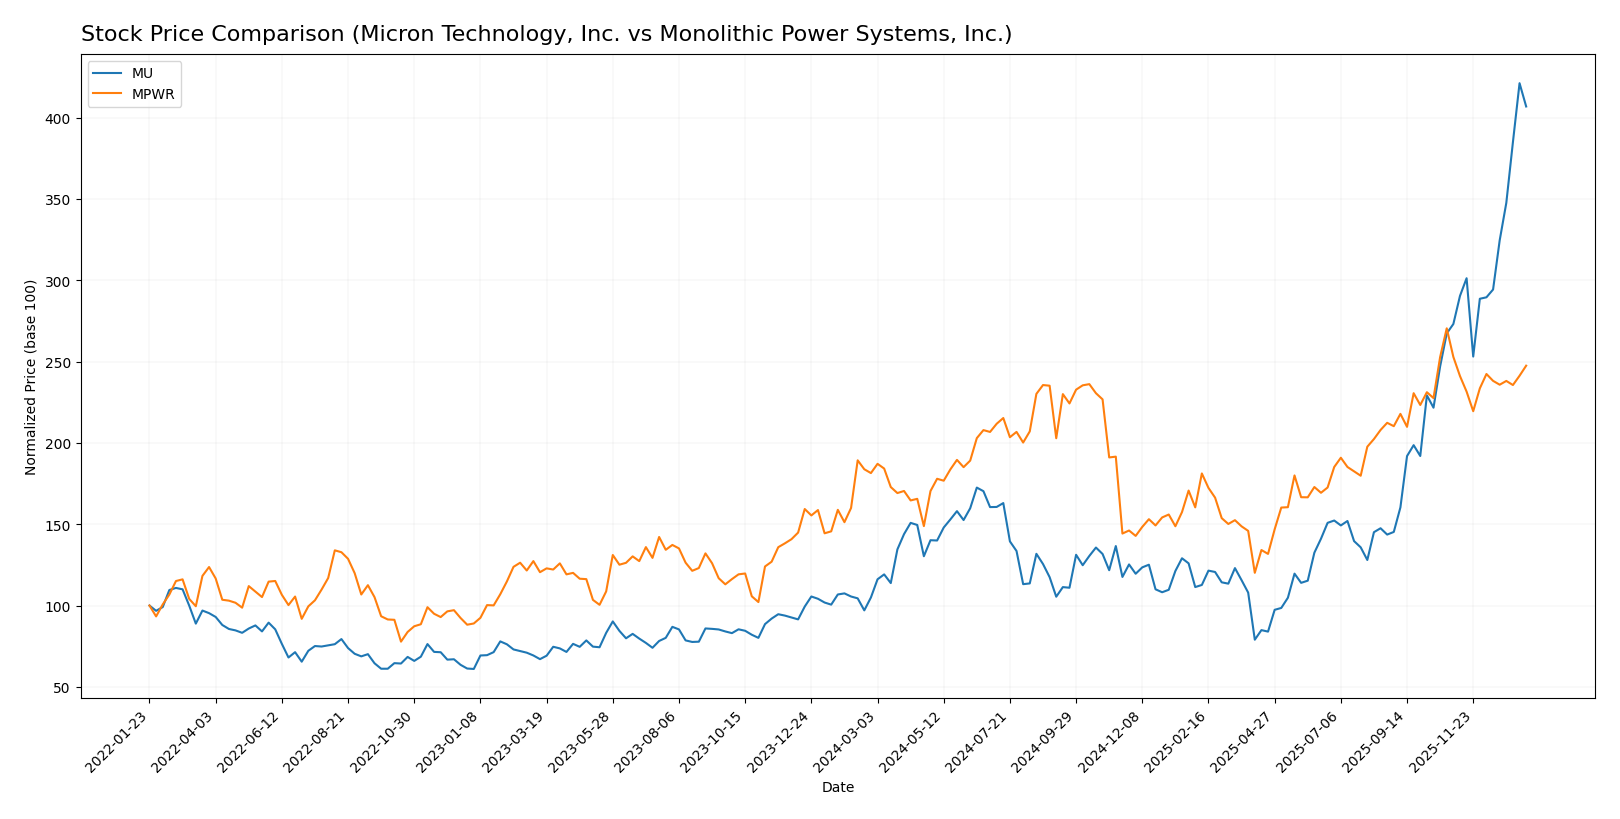
Stock Comparison
The stock price movements over the past year reveal significant bullish momentum for Micron Technology, Inc. (MU) with notable acceleration, while Monolithic Power Systems, Inc. (MPWR) shows a more moderate, decelerating upward trend.
Trend Analysis
Micron Technology, Inc. (MU) experienced a strong bullish trend over the past 12 months, with a 287.62% price increase and accelerating momentum. The stock ranged between 64.72 and 345.09, showing high volatility with a standard deviation of 57.56.
Monolithic Power Systems, Inc. (MPWR) also recorded a bullish trend over the same period, rising 36.4%, but with deceleration. Its price fluctuated from 477.39 to 1074.91 and showed higher volatility, with a 135.37 standard deviation.
Comparing both, MU delivered substantially higher market performance, outperforming MPWR by a wide margin in price appreciation during the last year.
Target Prices
The current analyst consensus reflects optimistic price targets for both Micron Technology, Inc. and Monolithic Power Systems, Inc.
| Company | Target High | Target Low | Consensus |
|---|---|---|---|
| Micron Technology, Inc. | 450 | 190 | 328.22 |
| Monolithic Power Systems, Inc. | 1375 | 970 | 1161.67 |
Analysts expect Micron’s price to stay near its current level of 333.35 USD, indicating moderate upside potential. Monolithic Power Systems shows a strong upside with consensus significantly above its current price of 983.60 USD.
Analyst Opinions Comparison
This section compares analysts’ ratings and grades for Micron Technology, Inc. (MU) and Monolithic Power Systems, Inc. (MPWR):
Rating Comparison
MU Rating
- Rating: B, classified as Very Favorable by analysts.
- Discounted Cash Flow Score: 1, indicating a Very Unfavorable valuation.
- ROE Score: 4, considered Favorable for shareholder profit generation.
- ROA Score: 5, showing Very Favorable asset utilization efficiency.
- Debt To Equity Score: 3, indicating Moderate financial risk.
- Overall Score: 3, reflecting a Moderate overall financial standing.
MPWR Rating
- Rating: A-, classified as Very Favorable by analysts.
- Discounted Cash Flow Score: 3, indicating a Moderate valuation.
- ROE Score: 5, considered Very Favorable for shareholder profit generation.
- ROA Score: 5, showing Very Favorable asset utilization efficiency.
- Debt To Equity Score: 5, indicating Very Favorable financial stability.
- Overall Score: 4, reflecting a Favorable overall financial standing.
Which one is the best rated?
Based strictly on the provided data, MPWR holds a superior rating overall, with higher scores in discounted cash flow, ROE, debt to equity, and a better overall score compared to MU. MU’s strengths lie in ROA but lag in valuation metrics.
Scores Comparison
Here is a comparison of the Altman Z-Score and Piotroski Score for each company:
MU Scores
- Altman Z-Score: 10.5, indicating a safe zone with low bankruptcy risk.
- Piotroski Score: 7, classified as strong financial health.
MPWR Scores
- Altman Z-Score: 46.8, indicating a safe zone with very low bankruptcy risk.
- Piotroski Score: 4, indicating average financial health.
Which company has the best scores?
MPWR has a much higher Altman Z-Score, suggesting stronger bankruptcy safety, while MU has a higher Piotroski Score, indicating better overall financial strength. Both scores favor different aspects of financial health.
Grades Comparison
The following presents the latest available grades from recognized grading companies for both Micron Technology, Inc. and Monolithic Power Systems, Inc.:
Micron Technology, Inc. Grades
This table summarizes recent grades and rating actions from established financial institutions for Micron Technology, Inc.:
| Grading Company | Action | New Grade | Date |
|---|---|---|---|
| Keybanc | Maintain | Overweight | 2026-01-13 |
| B of A Securities | Maintain | Buy | 2026-01-13 |
| Lynx Global | Maintain | Buy | 2026-01-12 |
| Mizuho | Maintain | Outperform | 2026-01-09 |
| UBS | Maintain | Buy | 2026-01-07 |
| Piper Sandler | Maintain | Overweight | 2026-01-07 |
| Piper Sandler | Maintain | Overweight | 2025-12-18 |
| Barclays | Maintain | Overweight | 2025-12-18 |
| Keybanc | Maintain | Overweight | 2025-12-18 |
| Wolfe Research | Maintain | Outperform | 2025-12-18 |
Overall, Micron Technology, Inc. shows consistent “Buy” and “Overweight” ratings with multiple “Outperform” grades, indicating a stable positive outlook from analysts.
Monolithic Power Systems, Inc. Grades
Below is a summary of recent grades and rating actions from verified grading firms for Monolithic Power Systems, Inc.:
| Grading Company | Action | New Grade | Date |
|---|---|---|---|
| Truist Securities | Maintain | Buy | 2025-12-19 |
| Citigroup | Maintain | Buy | 2025-11-03 |
| TD Cowen | Maintain | Buy | 2025-10-31 |
| Keybanc | Maintain | Overweight | 2025-10-31 |
| Rosenblatt | Maintain | Neutral | 2025-10-31 |
| Keybanc | Maintain | Overweight | 2025-10-23 |
| Wells Fargo | Maintain | Equal Weight | 2025-10-20 |
| Stifel | Maintain | Buy | 2025-10-17 |
| Wolfe Research | Upgrade | Outperform | 2025-10-14 |
| Citigroup | Maintain | Buy | 2025-10-03 |
Monolithic Power Systems, Inc. displays mostly “Buy” and “Overweight” ratings, with a recent upgrade to “Outperform” from Wolfe Research, but also includes some “Neutral” and “Equal Weight” grades signaling mixed sentiment.
Which company has the best grades?
Both companies have a consensus “Buy” rating, but Micron Technology, Inc. has a higher volume of consistent “Buy,” “Overweight,” and “Outperform” grades from multiple firms, suggesting stronger analyst conviction. This may translate into greater investor confidence, whereas Monolithic Power Systems, Inc.’s more varied ratings could indicate moderate caution among analysts.
Strengths and Weaknesses
Below is a comparison table outlining the key strengths and weaknesses of Micron Technology, Inc. (MU) and Monolithic Power Systems, Inc. (MPWR) based on the most recent financial and operational data.
| Criterion | Micron Technology, Inc. (MU) | Monolithic Power Systems, Inc. (MPWR) |
|---|---|---|
| Diversification | Moderate diversification across DRAM and NAND products; some segment variation in recent years | Focused product line mainly on DC to DC and Lighting Control products; less diversified |
| Profitability | Favorable net margin of 22.84%, ROIC of 12.12%, positive and growing profitability but ROIC near WACC | Very high net margin of 80.95%, ROIC of 16.22%, strong value creation and growing profitability |
| Innovation | Steady growth in ROIC indicating improving capital efficiency; moderate asset turnover | High fixed asset turnover (4.17) and innovation-driven product expansion |
| Global presence | Established global semiconductor footprint with strong memory market presence | Growing global presence in power management with increasing revenues |
| Market Share | Large market share in DRAM and NAND markets; competitive but facing industry cyclicality | Smaller but growing niche market share with durable competitive advantage |
Key takeaways: MPWR shows a stronger economic moat with very favorable ROIC and profitability, supported by focused innovation and efficient asset use. MU has a broader product base with improving profitability but still faces margin pressures and less diversification. Investors should weigh MU’s growth potential against MPWR’s stable value creation.
Risk Analysis
Below is a comparative overview of key risks associated with Micron Technology, Inc. (MU) and Monolithic Power Systems, Inc. (MPWR) based on the most recent data from 2025 and 2024.
| Metric | Micron Technology, Inc. (MU) | Monolithic Power Systems, Inc. (MPWR) |
|---|---|---|
| Market Risk | High beta of 1.503 indicates elevated volatility | High beta of 1.456, also indicating notable market sensitivity |
| Debt level | Moderate debt-to-equity at 0.28 and debt-to-assets 18.45% (favorable) | Very low debt-to-equity at 0.01 and debt-to-assets 0.44% (favorable) |
| Regulatory Risk | Exposure to global semiconductor regulations and trade policies | Similar semiconductor sector regulatory exposure, with some risk in international markets |
| Operational Risk | Large scale operations with 48K employees, moderate asset turnover | Smaller company with 4K employees, higher fixed asset turnover, potentially more agile |
| Environmental Risk | Standard industry environmental concerns; no major red flags | Same industry risks; emphasis on energy-efficient power solutions could mitigate risks |
| Geopolitical Risk | Significant exposure due to global supply chains and U.S.-China tensions | Similar exposure but less extensive supply chain footprint |
Micron’s market and geopolitical risks are heightened by its size and global footprint, especially amid ongoing semiconductor trade tensions. Monolithic Power Systems, while smaller and with lower debt, faces market volatility and regulatory uncertainties but benefits from a conservative debt profile and operational efficiency. Investors should weigh Micron’s scale and geopolitical exposure against Monolithic’s agility and financial conservatism.
Which Stock to Choose?
Micron Technology, Inc. (MU) has shown strong income growth with a 48.85% revenue increase in the past year and favorable profitability metrics, including a 22.84% net margin. Its financial ratios are mostly positive, featuring a low debt-to-equity ratio of 0.28 and a solid current ratio of 2.52. The company carries a “B” rating indicating very favorable financial health, supported by growing ROIC but still slightly below WACC, suggesting slight value shedding.
Monolithic Power Systems, Inc. (MPWR) demonstrates robust income growth with a 21.2% revenue rise last year and an impressive 80.95% net margin. Its financial ratios also appear favorable overall, including an extremely low debt-to-equity ratio of 0.01 and strong return on equity of 56.8%. MPWR holds an “A-” rating with a very favorable moat status due to ROIC well exceeding WACC, signaling durable value creation and improving profitability.
Investors focused on growth and high profitability might find Monolithic Power Systems appealing given its very favorable rating and strong moat, while those prioritizing stability with improving income and solid financial ratios could view Micron Technology as a slightly more cautious choice due to its slightly favorable moat and moderate rating.
Disclaimer: Investment carries a risk of loss of initial capital. The past performance is not a reliable indicator of future results. Be sure to understand risks before making an investment decision.
Go Further
I encourage you to read the complete analyses of Micron Technology, Inc. and Monolithic Power Systems, Inc. to enhance your investment decisions: