In the fast-evolving semiconductor industry, Micron Technology, Inc. (MU) and indie Semiconductor, Inc. (INDI) stand out as key players with distinct market focuses. Micron leads with memory and storage innovations, while indie targets automotive semiconductor solutions. Their shared industry yet diverse strategies make them worthy of comparison. In this article, I will help you identify which company holds the most promise for your investment portfolio.
Table of contents
Companies Overview
I will begin the comparison between Micron Technology, Inc. and indie Semiconductor, Inc. by providing an overview of these two companies and their main differences.
Micron Technology, Inc. Overview
Micron Technology, Inc. specializes in designing, manufacturing, and selling memory and storage products worldwide. Established in 1978 and headquartered in Boise, Idaho, Micron operates through multiple segments including Compute, Mobile, Storage, and Embedded Business Units. Its product portfolio features DRAM, NAND, and NOR memory technologies serving cloud, enterprise, mobile, automotive, industrial, and consumer markets.
indie Semiconductor, Inc. Overview
indie Semiconductor, Inc. focuses on automotive semiconductors and software solutions aimed at advanced driver assistance, connected car, electrification, and user experience applications. Founded in 2007 and based in Aliso Viejo, California, the company offers devices for parking assistance, wireless charging, infotainment, telematics, and photonic components for optical communication markets, targeting emerging automotive technologies.
Key similarities and differences
Both companies operate in the semiconductor industry, yet their business models diverge significantly. Micron concentrates on memory and storage solutions with a broad market scope including consumer and enterprise sectors. In contrast, indie Semiconductor targets niche automotive applications and software, emphasizing advanced driver assistance and connectivity. Micron has a considerably larger market cap and workforce, reflecting its established global presence versus indie’s specialized focus and smaller scale.
Income Statement Comparison
This table presents a side-by-side comparison of key income statement metrics for Micron Technology, Inc. and indie Semiconductor, Inc. for their most recent fiscal years.

| Metric | Micron Technology, Inc. (MU) | indie Semiconductor, Inc. (INDI) |
|---|---|---|
| Market Cap | 373.2B | 861.1M |
| Revenue | 37.38B | 217M |
| EBITDA | 18.49B | -94M |
| EBIT | 10.14B | -137M |
| Net Income | 8.54B | -133M |
| EPS | 7.65 | -0.76 |
| Fiscal Year | 2025 | 2024 |
Income Statement Interpretations
Micron Technology, Inc.
Micron Technology experienced strong revenue growth from 2021 to 2025, rising from $27.7B to $37.4B, with net income recovering from a loss of -$5.8B in 2023 to $8.5B in 2025. Margins improved significantly, with the net margin reaching 22.8% in 2025. The latest year showed robust earnings growth and margin expansion, reflecting favorable operational leverage and cost control.
indie Semiconductor, Inc.
indie Semiconductor saw revenue growth overall from $48.4M in 2021 to $217M in 2024 but experienced a slight revenue decline of -2.9% in the last year. The company remained unprofitable, with net losses of -$133M in 2024 despite a gross margin of 41.7%. Margins deteriorated with an unfavorable EBIT margin of -63.2%, signaling ongoing operational challenges despite improving EPS.
Which one has the stronger fundamentals?
Micron Technology demonstrates stronger fundamentals with consistent revenue and net income growth, favorable margin expansions, and positive earnings momentum. In contrast, indie Semiconductor’s mixed signals include strong revenue gains over the period but persistent losses and unfavorable profitability ratios. Overall, Micron’s income statement shows a more stable and improving financial position.
Financial Ratios Comparison
This table presents the most recent key financial ratios for Micron Technology, Inc. (MU) and indie Semiconductor, Inc. (INDI) for fiscal year 2025 and 2024 respectively, facilitating a straightforward comparison.
| Ratios | Micron Technology, Inc. (2025) | indie Semiconductor, Inc. (2024) |
|---|---|---|
| ROE | 15.76% | -31.73% |
| ROIC | 12.12% | -19.25% |
| P/E | 15.94 | -5.35 |
| P/B | 2.51 | 1.70 |
| Current Ratio | 2.52 | 4.82 |
| Quick Ratio | 1.79 | 4.23 |
| D/E (Debt to Equity) | 0.28 | 0.95 |
| Debt-to-Assets | 18.45% | 42.34% |
| Interest Coverage | 20.69 | -18.37 |
| Asset Turnover | 0.45 | 0.23 |
| Fixed Asset Turnover | 0.79 | 4.30 |
| Payout ratio | 6.11% | 0% |
| Dividend yield | 0.38% | 0% |
Interpretation of the Ratios
Micron Technology, Inc.
Micron Technology displays mostly favorable ratios, including a strong net margin of 22.84%, ROE at 15.76%, and ROIC at 12.12%, indicating efficient profitability and capital use. However, its WACC and asset turnover ratios are less favorable, suggesting some cost of capital pressure and lower asset efficiency. The company pays dividends with a modest yield of 0.38%, reflecting a cautious payout amid moderate share buyback activity.
indie Semiconductor, Inc.
indie Semiconductor’s ratios are predominantly unfavorable, with a negative net margin of -61.2% and ROE at -31.73%, reflecting significant losses and weak profitability. Its WACC is high at 11.35%, and interest coverage is deeply negative, signaling financial strain. The company does not pay dividends, consistent with its reinvestment focus during a high-growth phase, prioritizing R&D and acquisitions over shareholder returns.
Which one has the best ratios?
Based on the evaluations, Micron Technology holds the stronger financial profile with majority favorable ratios, stable profitability, and positive returns on equity and capital. In contrast, indie Semiconductor struggles with losses, negative returns, and financial instability, resulting in an overall unfavorable ratio assessment.
Strategic Positioning
This section compares the strategic positioning of Micron Technology, Inc. and indie Semiconductor, Inc., including their market position, key segments, and exposure to technological disruption:
Micron Technology, Inc.
- Large market cap of 373B, faces competitive pressure in global semiconductor industry.
- Diversified segments: DRAM, NAND, Compute, Mobile, Storage, Embedded driving revenues.
- Exposed to rapid tech changes in memory and storage semiconductors requiring innovation.
indie Semiconductor, Inc.
- Small market cap of 861M, operates in competitive automotive semiconductor niche.
- Focused on automotive semiconductors and software for driver assistance and connectivity.
- Faces disruption in automotive tech with photonic and wireless semiconductor innovations.
Micron Technology, Inc. vs indie Semiconductor, Inc. Positioning
Micron has a diversified business with multiple memory and storage segments, providing broad market exposure. indie Semiconductor focuses narrowly on automotive semiconductor solutions, which concentrates risk but targets growing automotive technology applications.
Which has the best competitive advantage?
Micron’s slightly favorable moat status reflects growing profitability and better capital efficiency. indie Semiconductor’s very unfavorable moat indicates declining profitability and value destruction, suggesting a weaker competitive advantage.
Stock Comparison
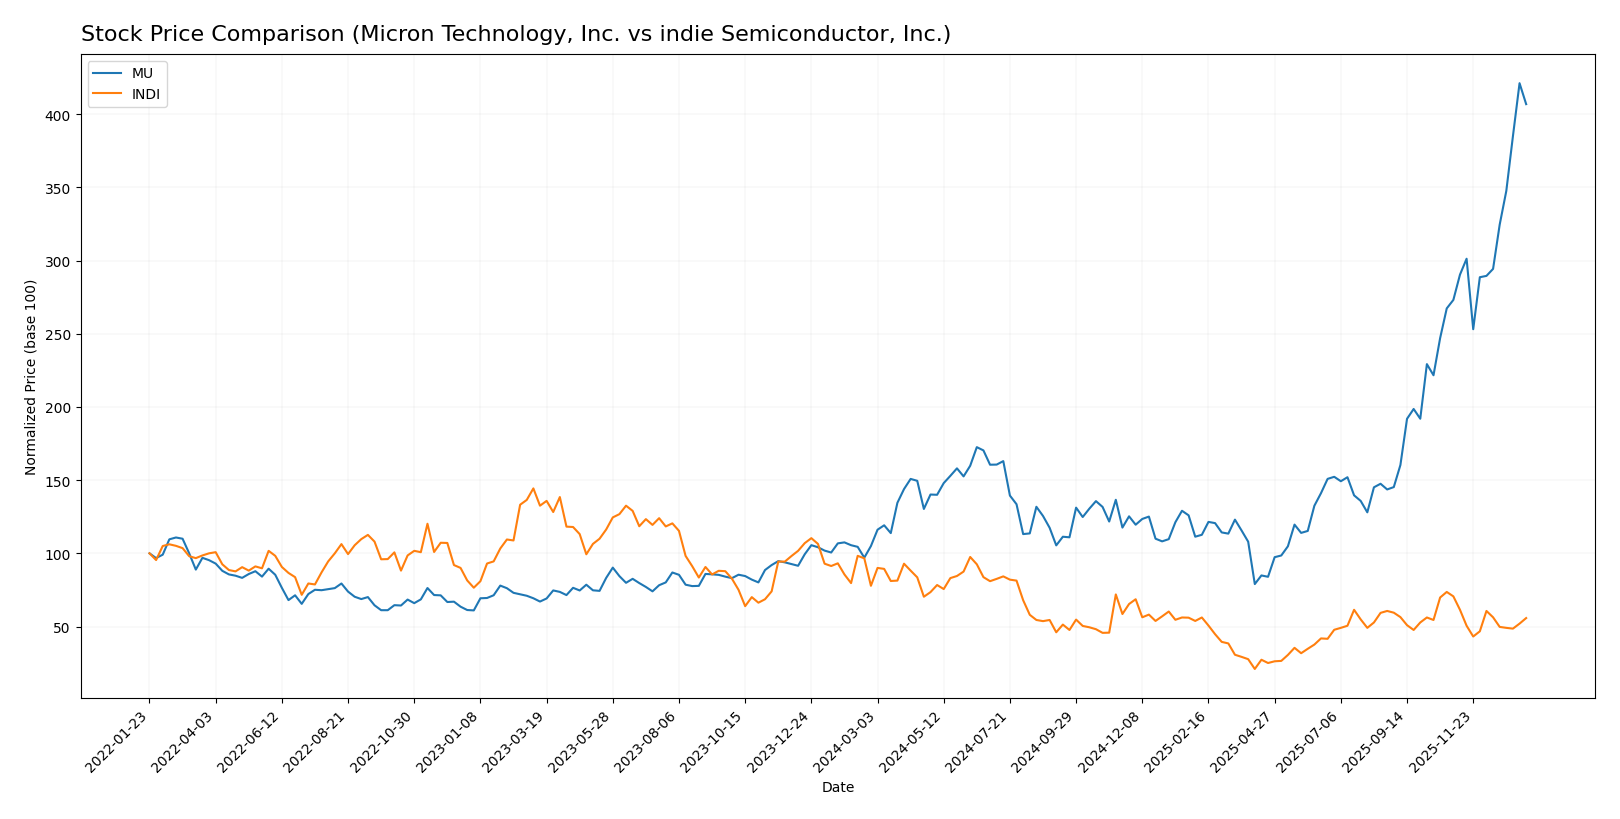
The stock price movements of Micron Technology, Inc. (MU) and indie Semiconductor, Inc. (INDI) over the past year reflect contrasting dynamics, with MU showing strong gains and buyer dominance, while INDI experiences a notable decline and seller dominance.
Trend Analysis
Micron Technology, Inc. (MU) displays a bullish trend over the past 12 months with a 287.62% price increase and accelerating momentum. Volatility is significant, shown by a 57.56 standard deviation and a price range from 64.72 to 345.09.
indie Semiconductor, Inc. (INDI) shows a bearish trend with a 28.33% decline over the same period and decelerating downward momentum. Volatility remains low, with a 1.35 standard deviation and prices fluctuating between 1.6 and 7.43.
Comparing both, MU has delivered the highest market performance with substantial gains and strong buyer activity, while INDI’s stock has weakened amid seller dominance and declining prices.
Target Prices
The current target price consensus for selected semiconductor stocks reflects varied analyst expectations.
| Company | Target High | Target Low | Consensus |
|---|---|---|---|
| Micron Technology, Inc. | 450 | 190 | 328.22 |
| indie Semiconductor, Inc. | 8 | 8 | 8 |
Analysts anticipate Micron Technology’s price to range broadly, with consensus close to its current price of 333.35 USD. indie Semiconductor shows a fixed target at 8 USD, suggesting potential upside from its current 4.25 USD.
Analyst Opinions Comparison
This section compares analysts’ ratings and grades for Micron Technology, Inc. and indie Semiconductor, Inc.:
Rating Comparison
MU Rating
- Rating: B, assessed as Very Favorable
- Discounted Cash Flow Score: 1, Very Unfavorable, indicates low valuation appeal
- ROE Score: 4, Favorable, showing efficient profit generation from equity
- ROA Score: 5, Very Favorable, effective asset utilization
- Debt To Equity Score: 3, Moderate, moderate financial risk
- Overall Score: 3, Moderate financial standing
INDI Rating
- Rating: C-, assessed as Very Unfavorable
- Discounted Cash Flow Score: 1, Very Unfavorable, indicates low valuation appeal
- ROE Score: 1, Very Unfavorable, indicating poor equity profit generation
- ROA Score: 1, Very Unfavorable, ineffective asset use
- Debt To Equity Score: 1, Very Unfavorable, high financial risk
- Overall Score: 1, Very Unfavorable financial standing
Which one is the best rated?
Based strictly on the provided data, Micron Technology, Inc. is better rated with a B rating and moderate overall score, while indie Semiconductor, Inc. holds a lower C- rating and very unfavorable scores across key financial metrics.
Scores Comparison
The scores comparison between Micron Technology and indie Semiconductor is as follows:
MU Scores
- Altman Z-Score: 10.5, indicating a safe zone with very low bankruptcy risk.
- Piotroski Score: 7, classified as strong financial health.
INDI Scores
- Altman Z-Score: 0.12, indicating distress zone with high bankruptcy risk.
- Piotroski Score: 2, classified as very weak financial health.
Which company has the best scores?
Micron Technology clearly outperforms indie Semiconductor in both Altman Z-Score and Piotroski Score, showing stronger financial stability and health based on the data provided.
Grades Comparison
The grades comparison for Micron Technology, Inc. and indie Semiconductor, Inc. are as follows:
Micron Technology, Inc. Grades
The table below summarizes recent grades issued by reputable firms for Micron Technology, Inc.:
| Grading Company | Action | New Grade | Date |
|---|---|---|---|
| Keybanc | Maintain | Overweight | 2026-01-13 |
| B of A Securities | Maintain | Buy | 2026-01-13 |
| Lynx Global | Maintain | Buy | 2026-01-12 |
| Mizuho | Maintain | Outperform | 2026-01-09 |
| UBS | Maintain | Buy | 2026-01-07 |
| Piper Sandler | Maintain | Overweight | 2026-01-07 |
| Piper Sandler | Maintain | Overweight | 2025-12-18 |
| Barclays | Maintain | Overweight | 2025-12-18 |
| Keybanc | Maintain | Overweight | 2025-12-18 |
| Wolfe Research | Maintain | Outperform | 2025-12-18 |
Overall, Micron Technology displays a strong and consistent positive grading trend with multiple buy and overweight recommendations across top-tier grading companies.
indie Semiconductor, Inc. Grades
The table below summarizes recent grades issued by reputable firms for indie Semiconductor, Inc.:
| Grading Company | Action | New Grade | Date |
|---|---|---|---|
| UBS | Maintain | Neutral | 2025-11-10 |
| Benchmark | Maintain | Buy | 2025-06-25 |
| Benchmark | Maintain | Buy | 2025-06-11 |
| Benchmark | Maintain | Buy | 2025-05-21 |
| Benchmark | Maintain | Buy | 2025-05-13 |
| Craig-Hallum | Maintain | Buy | 2025-05-13 |
| Keybanc | Maintain | Overweight | 2025-05-13 |
| Benchmark | Maintain | Buy | 2025-04-09 |
| Benchmark | Maintain | Buy | 2025-02-21 |
| Keybanc | Maintain | Overweight | 2025-02-21 |
indie Semiconductor shows predominantly buy ratings with occasional overweight grades, but also includes a neutral rating by UBS, indicating somewhat mixed sentiment.
Which company has the best grades?
Micron Technology, Inc. has received a more consistent and stronger set of grades, predominantly buy and overweight, compared to indie Semiconductor, Inc., which shows some neutral ratings alongside buy recommendations. This difference may reflect greater confidence from analysts in Micron’s prospects, potentially impacting investor sentiment and portfolio decisions.
Strengths and Weaknesses
Below is a comparative overview of the strengths and weaknesses of Micron Technology, Inc. (MU) and indie Semiconductor, Inc. (INDI) based on their latest financial and operational data.
| Criterion | Micron Technology, Inc. (MU) | indie Semiconductor, Inc. (INDI) |
|---|---|---|
| Diversification | High product diversification with strong DRAM and NAND segments, plus multiple business units generating revenue. | Limited diversification, mainly focused on semiconductor products and services with smaller revenue base. |
| Profitability | Favorable profitability metrics: net margin 22.8%, ROE 15.8%, ROIC 12.1%. | Unfavorable profitability: net margin -61.2%, ROE -31.7%, ROIC -19.3%. |
| Innovation | Moderate innovation; maintains steady ROIC growth but no strong economic moat yet. | Weak innovation impact; declining ROIC and value destruction trend. |
| Global presence | Strong global presence evidenced by large-scale semiconductor production and diverse product lines. | Smaller global footprint, less established market presence. |
| Market Share | Significant market share in memory products, with DRAM revenue at $28.6B and NAND at $8.5B (2025). | Small market share with total product revenue around $203M (2024). |
Key takeaways: Micron Technology exhibits solid profitability, broad diversification, and a growing competitive position, making it a relatively safer investment. Indie Semiconductor struggles with profitability and scale, indicating higher risk and value destruction. Caution and risk management favor MU over INDI for portfolio inclusion.
Risk Analysis
Below is a comparison table outlining key risk factors for Micron Technology, Inc. (MU) and indie Semiconductor, Inc. (INDI) based on the most recent data available.
| Metric | Micron Technology, Inc. (MU) | indie Semiconductor, Inc. (INDI) |
|---|---|---|
| Market Risk | Moderate (Beta 1.50) | High (Beta 2.54) |
| Debt level | Low (D/E 0.28, Debt to assets 18.5%) | Moderate-High (D/E 0.95, Debt to assets 42.3%) |
| Regulatory Risk | Moderate (Global semiconductor regulations) | Moderate (Automotive semiconductor compliance) |
| Operational Risk | Moderate (Large-scale manufacturing complexity) | High (Smaller scale, emerging tech risks) |
| Environmental Risk | Moderate (Manufacturing emissions and resource use) | Low to Moderate (Smaller footprint, automotive focus) |
| Geopolitical Risk | High (Global supply chain, trade tensions) | High (Automotive supply chain exposure) |
The most impactful risks are geopolitical and market volatility for both companies due to global supply chain dependencies and high beta values indicating stock price sensitivity. indie Semiconductor faces higher operational and financial distress risks, including low profitability and a weak Altman Z-score, signaling potential bankruptcy concerns. Micron’s solid balance sheet and strong financial health mitigate these risks comparatively.
Which Stock to Choose?
Micron Technology, Inc. (MU) shows a strong income evolution with a 48.85% revenue growth in 2025, favorable profitability ratios including a 22.84% net margin, and manageable debt levels (net debt to EBITDA at 0.30). Its financial ratios are largely favorable, supported by a very favorable rating and solid scores indicating financial strength.
Indie Semiconductor, Inc. (INDI) presents mixed income results with a negative net margin of -61.2% and declining revenue growth of -2.91% in 2024. Financial ratios are mostly unfavorable, reflecting high debt and weak profitability. Despite a very favorable rating label, its scores indicate distress and weak financial health, accompanied by a bearish stock trend.
For investors prioritizing quality and financial stability, MU’s favorable income growth, robust profitability, and stronger financial ratios might appear more suitable. Meanwhile, risk-tolerant investors seeking growth potential in early-stage companies might find INDI’s profile indicative of higher volatility and risk, given its weaker financials and value destruction signals.
Disclaimer: Investment carries a risk of loss of initial capital. The past performance is not a reliable indicator of future results. Be sure to understand risks before making an investment decision.
Go Further
I encourage you to read the complete analyses of Micron Technology, Inc. and indie Semiconductor, Inc. to enhance your investment decisions: