Home > Comparison > Technology > MCHP vs TER
The strategic rivalry between Microchip Technology Incorporated and Teradyne, Inc. shapes the semiconductor sector’s evolution. Microchip operates as a broad-based embedded control solutions provider, while Teradyne specializes in sophisticated automated test equipment and industrial automation. This head-to-head contrasts a product-diverse manufacturer against a precision test and automation leader. This analysis aims to determine which company offers the superior risk-adjusted return potential for a well-diversified portfolio in the dynamic tech landscape.
Table of contents
Companies Overview
Microchip Technology and Teradyne are key players shaping the semiconductor landscape in 2026.
Microchip Technology Incorporated: Embedded Control Innovator
Microchip Technology dominates the embedded control solutions market with a diverse product suite including microcontrollers, microprocessors, and analog components. Its core revenue stems from supplying smart, connected devices across automotive, industrial, and communication sectors. In 2026, it deepened its strategic focus on secure, low-power embedded solutions to capture growing IoT and automotive demand.
Teradyne, Inc.: Automated Test Equipment Leader
Teradyne leads in automatic test equipment for semiconductor and wireless device markets. It generates revenue by selling sophisticated test platforms for wafer, system, industrial automation, and wireless segments. The company’s 2026 strategy emphasizes expanding industrial automation and 5G wireless testing capabilities to meet rising complexity in manufacturing and connectivity.
Strategic Collision: Similarities & Divergences
Both firms operate in semiconductors but diverge sharply: Microchip invests in embedded system integration, while Teradyne excels in test automation infrastructure. Their primary battleground is the semiconductor value chain—Microchip upstream in device creation, Teradyne downstream in quality assurance. This split defines their distinct investment profiles: Microchip offers broad product exposure; Teradyne delivers niche technological specialization.
Income Statement Comparison
This data dissects the core profitability and scalability of both corporate engines to reveal who dominates the bottom line:
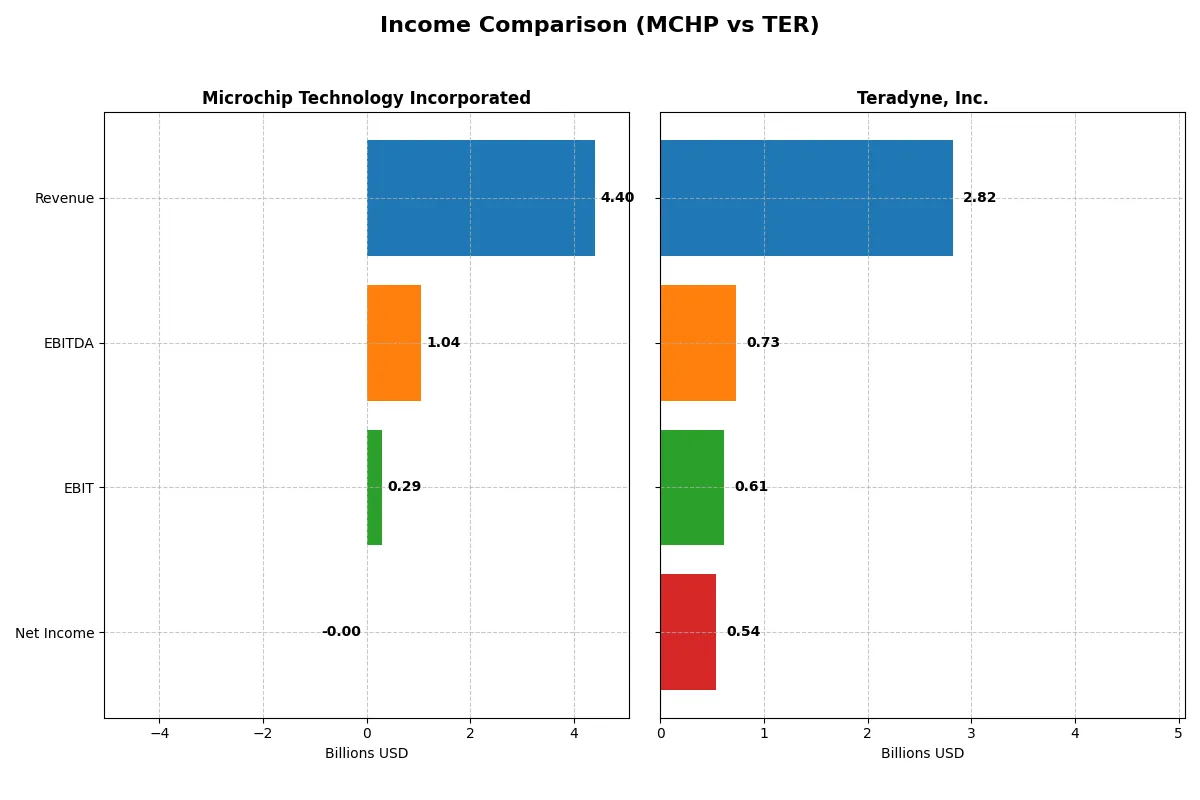
| Metric | Microchip Technology Incorporated (MCHP) | Teradyne, Inc. (TER) |
|---|---|---|
| Revenue | 4.40B | 2.82B |
| Cost of Revenue | 1.93B | 1.17B |
| Operating Expenses | 2.17B | 1.06B |
| Gross Profit | 2.47B | 1.65B |
| EBITDA | 1.04B | 732M |
| EBIT | 290M | 613M |
| Interest Expense | 251M | 3.59M |
| Net Income | -0.5M | 542M |
| EPS | -0.005 | 3.41 |
| Fiscal Year | 2025 | 2024 |
Income Statement Analysis: The Bottom-Line Duel
This income statement comparison uncovers which company operates with superior efficiency and sustainable profitability amid market challenges.
Microchip Technology Incorporated Analysis
Microchip’s revenue plunges 42% in 2025 to $4.4B, dragging net income into a slight loss of -$2.7M. Gross margin remains robust at 56%, yet net margin collapses to nearly zero, signaling severe bottom-line pressure. The sharp decline in EBIT by 89% highlights deteriorating operational efficiency and weakened momentum.
Teradyne, Inc. Analysis
Teradyne’s revenue grows modestly by 5% to $2.8B in 2024, lifting net income 21% to $542M. It sustains a strong gross margin of 58% and an impressive EBIT margin of 22%. The consistent margin expansion underpins improved profitability and operational leverage, reflecting solid execution and growth resilience.
Margin Resilience vs. Revenue Contraction
Teradyne clearly outperforms Microchip on profitability, delivering superior margins and positive net income growth. Microchip’s steep revenue and earnings declines undermine its financial health. For investors prioritizing margin stability and earnings momentum, Teradyne’s profile offers a more attractive and dependable investment foundation.
Financial Ratios Comparison
These vital ratios act as a diagnostic tool to expose the underlying fiscal health, valuation premiums, and capital efficiency of the companies compared below:
| Ratios | Microchip Technology Incorporated (MCHP) | Teradyne, Inc. (TER) |
|---|---|---|
| ROE | -0.0071 | 0.1924 |
| ROIC | -0.0003 | 0.1725 |
| P/E | -52021 (2025 est.) | 36.93 (2024) |
| P/B | 3.67 (2025 est.) | 7.11 (2024) |
| Current Ratio | 2.59 (2025 est.) | 2.91 (2024) |
| Quick Ratio | 1.47 (2025 est.) | 1.84 (2024) |
| D/E | 0.80 (2025 est.) | 0.03 (2024) |
| Debt-to-Assets | 0.37 (2025 est.) | 0.02 (2024) |
| Interest Coverage | 1.18 (2025 est.) | 165.54 (2024) |
| Asset Turnover | 0.29 (2025 est.) | 0.76 (2024) |
| Fixed Asset Turnover | 3.72 (2025 est.) | 4.88 (2024) |
| Payout ratio | -1951.4% (2025 est.) | 14.1% (2024) |
| Dividend yield | 3.75% (2025 est.) | 0.38% (2024) |
| Fiscal Year | 2025 | 2024 |
Efficiency & Valuation Duel: The Vital Signs
Financial ratios act as a company’s DNA, revealing hidden risks and operational excellence critical to investment decisions.
Microchip Technology Incorporated
Microchip’s profitability metrics disappoint with negative ROE and margins, signaling operational challenges. Its valuation appears unusually favorable on P/E, yet a high P/B ratio and weak asset turnover caution against overenthusiasm. The company offers a 3.75% dividend yield, supporting shareholder returns despite reinvestment in R&D, reflecting a mixed capital allocation approach.
Teradyne, Inc.
Teradyne shows strong profitability with ROE and net margin near 19%, indicating efficient operations. However, its P/E at 36.9 signals an expensive stock relative to earnings. Low debt levels and excellent interest coverage bolster financial safety. Dividend yield is modest at 0.38%, suggesting a focus on growth and reinvestment rather than income distribution.
Balanced Profitability vs. Valuation Stretch
Teradyne delivers better operational efficiency and financial health, though at a premium valuation. Microchip’s cheaper valuation masks underlying profitability issues and weaker asset efficiency. Investors prioritizing growth and stability may lean toward Teradyne, while value seekers face notable risks with Microchip’s profile.
Which one offers the Superior Shareholder Reward?
Microchip Technology (MCHP) delivers a 3.75% dividend yield, supported by strong free cash flow coverage near 90%. It pairs this with aggressive buybacks, albeit with recent net losses raising sustainability concerns. Teradyne (TER) pays a lower 0.38% dividend with a conservative 14% payout ratio but maintains robust margins and a pristine balance sheet, fueling consistent buybacks and reinvestment. Historically, I’ve observed that Teradyne’s lean debt and steady cash generation enable sustainable shareholder returns through buybacks and modest dividends. Conversely, Microchip’s higher yield and buybacks offer attractive near-term income but carry risk from volatile profits. For 2026, I favor Teradyne’s balanced approach, which promises more durable total returns over time.
Comparative Score Analysis: The Strategic Profile
The radar chart reveals the fundamental DNA and trade-offs of Microchip Technology and Teradyne, highlighting their financial strengths and weaknesses:
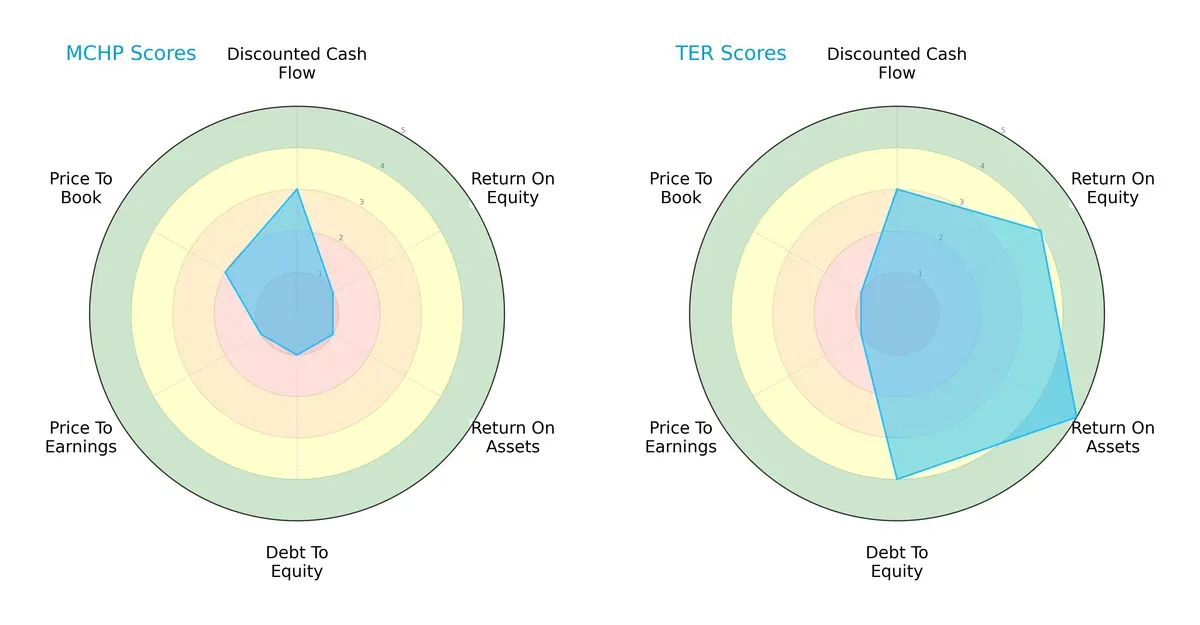
Teradyne dominates in profitability and asset utilization with ROE and ROA scores of 4 and 5, respectively, compared to Microchip’s very weak 1s. Teradyne also manages leverage better, scoring 4 on debt-to-equity, while Microchip scores 1, signaling higher financial risk. Both share moderate discounted cash flow scores of 3, but Microchip fares worse in valuation metrics (P/E and P/B). Overall, Teradyne presents a more balanced and robust profile, relying less on a single advantage.
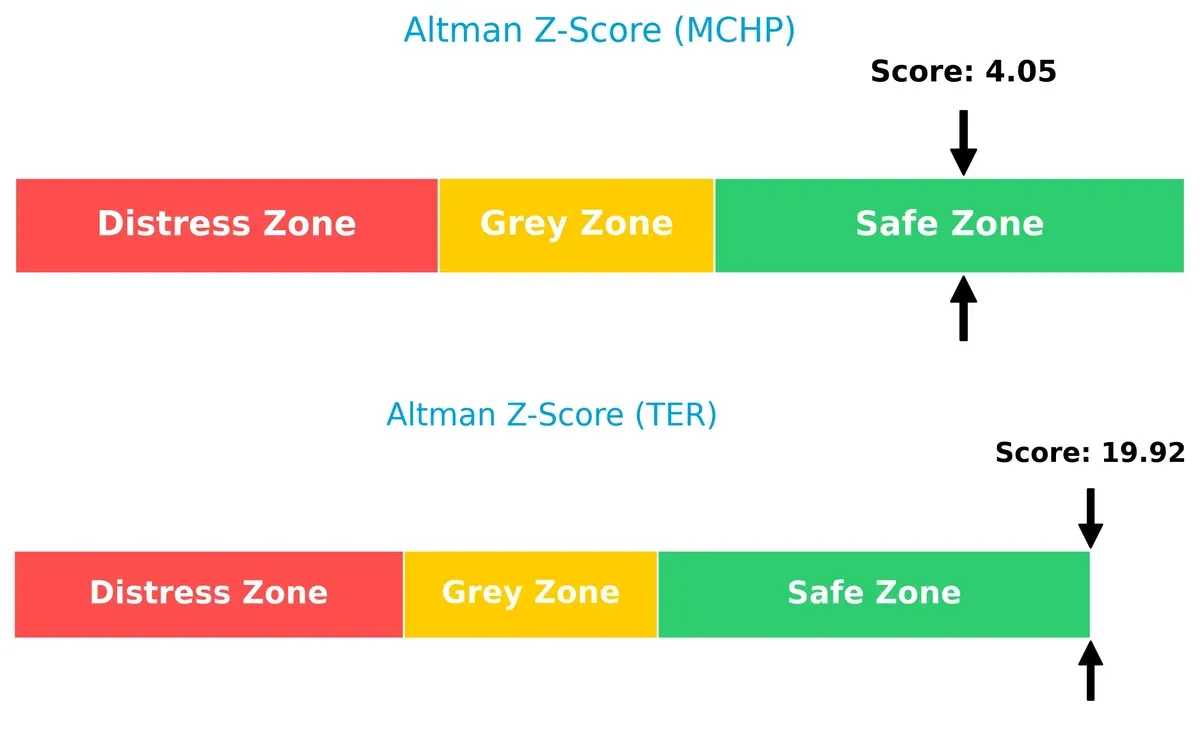
Bankruptcy Risk: Solvency Showdown
Teradyne’s Altman Z-Score of 19.9 vastly exceeds Microchip’s 4.1, placing both in the safe zone but signaling Teradyne’s far superior solvency and resilience in this cycle:
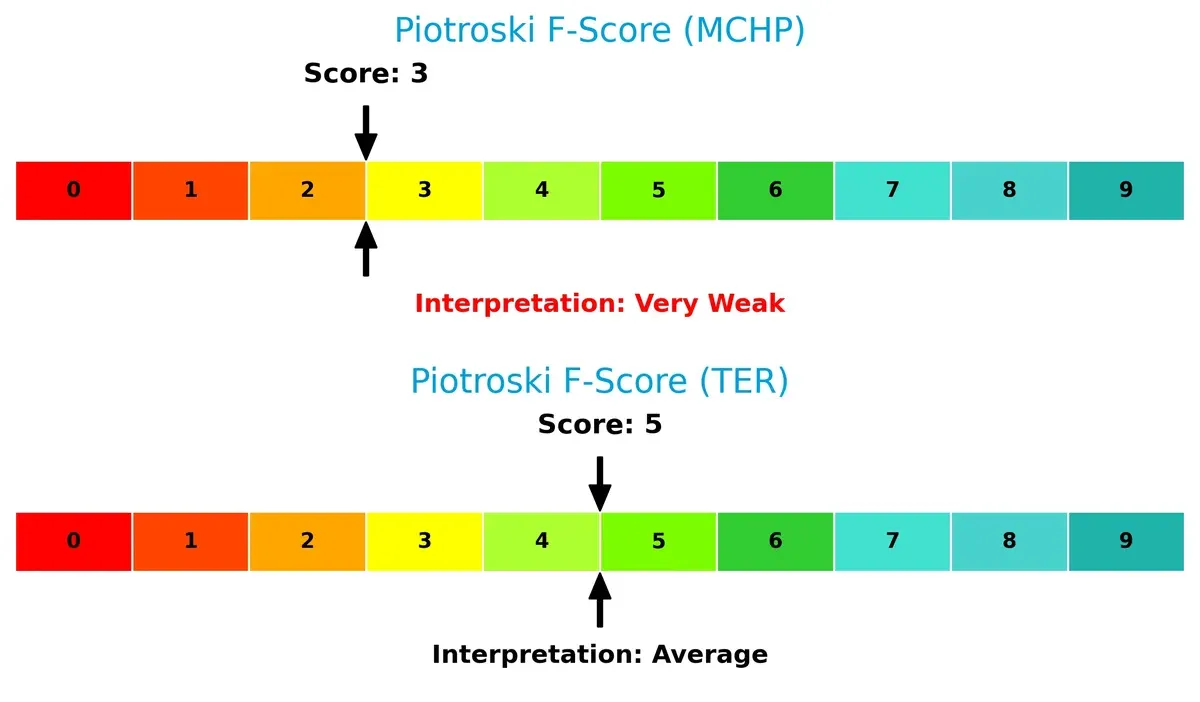
Financial Health: Quality of Operations
Teradyne’s Piotroski F-Score of 5 surpasses Microchip’s weak 3, indicating stronger internal financial health and fewer red flags in operational quality:
How are the two companies positioned?
This section dissects the operational DNA of Microchip Technology and Teradyne by comparing their revenue distribution and internal dynamics. The goal is to confront their economic moats and identify which model offers the most resilient competitive advantage today.
Revenue Segmentation: The Strategic Mix
This comparison dissects how Microchip Technology and Teradyne diversify income streams and reveals their primary sector bets:
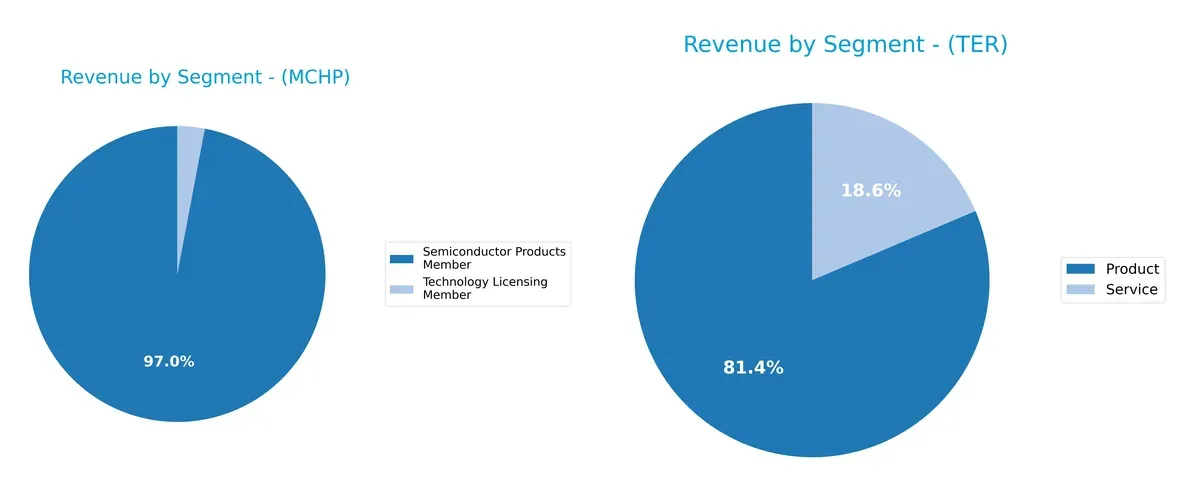
Microchip Technology anchors revenue with $4.27B in Semiconductor Products, dwarfing its $131M Technology Licensing segment. Teradyne shows a more balanced split, with $2.29B from Product and $525M from Service in 2024. Microchip’s focus signals concentration risk but strong ecosystem lock-in. Teradyne’s diversified revenue mix implies resilience, leveraging both product sales and service infrastructure dominance in automation and test solutions.
Strengths and Weaknesses Comparison
This table compares the strengths and weaknesses of Microchip Technology Incorporated (MCHP) and Teradyne, Inc. (TER):
MCHP Strengths
- Strong current and quick ratios indicate solid short-term liquidity
- Favorable dividend yield supports shareholder returns
- Good fixed asset turnover shows efficient use of fixed assets
TER Strengths
- High net margin, ROE, and ROIC indicate strong profitability and capital efficiency
- Very low debt-to-equity ratio reduces financial risk
- High interest coverage demonstrates strong ability to service debt
MCHP Weaknesses
- Negative net margin, ROE, and ROIC signal profitability challenges
- Low interest coverage ratio suggests risk in debt servicing
- Unfavorable asset turnover and price-to-book ratios indicate operational and valuation concerns
TER Weaknesses
- Unfavorable WACC and valuation multiples (PE, PB) may pressure returns
- Low dividend yield may deter income-focused investors
- Asset turnover is only neutral, limiting operational efficiency
Microchip Technology shows liquidity strengths but struggles with profitability and asset efficiency. Teradyne excels in profitability and financial stability but faces valuation and return on capital cost pressures. These contrasts suggest differing strategic priorities and risk profiles.
The Moat Duel: Analyzing Competitive Defensibility
A structural moat protects long-term profits from competition’s relentless erosion. Without it, gains quickly vanish in commoditized markets:
Microchip Technology Incorporated: Intangible Assets and Embedded Systems Moat
Microchip’s moat stems from its specialized embedded control solutions and proprietary non-volatile memory technology. However, declining ROIC and shrinking margins in 2025 signal weakening defensibility. New product innovation is critical to restore value creation.
Teradyne, Inc.: High-Tech Testing Systems and Automation Moat
Teradyne leverages cutting-edge automated test equipment and industrial robotics, driving superior margin stability and consistent value creation. Despite a declining ROIC trend, robust revenue growth and expanding automation markets suggest moat deepening opportunities ahead.
Economic Moats in Semiconductor Tech: Embedded Control vs. Automated Testing
Teradyne holds the wider moat, creating value with 4.8% ROIC above WACC and strong margin gains. Microchip’s negative ROIC reveals value destruction and eroding competitive advantage. Teradyne is better equipped to sustain and grow market share amid industry cycles.
Which stock offers better returns?
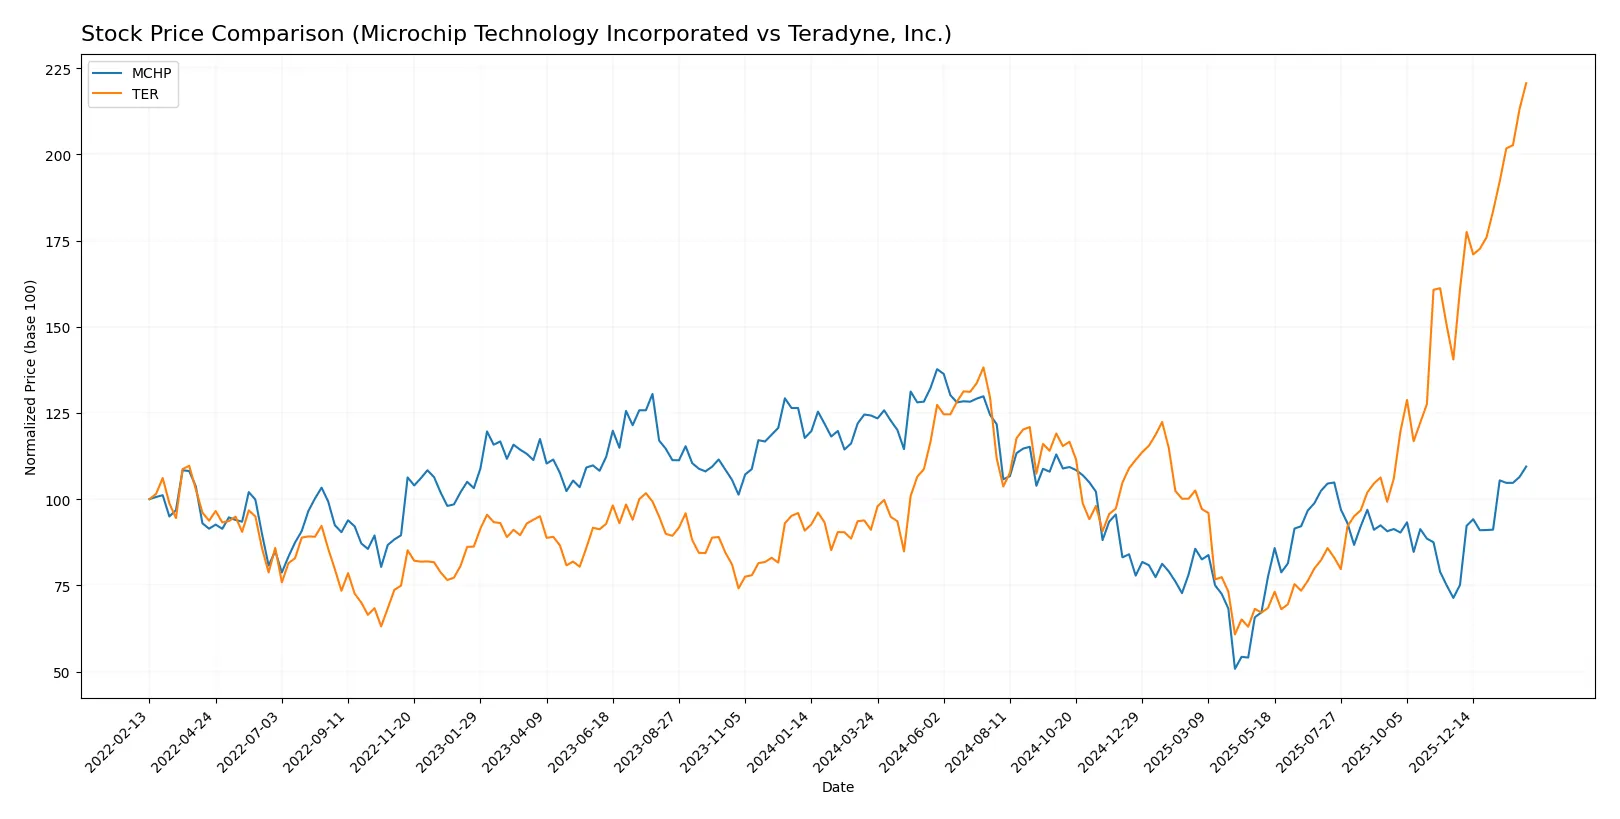
The past year reveals contrasting trajectories for Microchip Technology and Teradyne, highlighting distinct price shifts and buyer dynamics in their trading activity.
Trend Comparison
Microchip Technology’s stock shows a bearish trend over the past 12 months with a -11.91% price drop and accelerating decline, despite a recent 53.4% rebound since November 2025. Volatility remains moderate with a 14.14 std deviation.
Teradyne’s stock exhibits a strong bullish trend over the past year, surging 142.12% with accelerating gains and higher volatility at a 38.54 std deviation. It also posted a robust 57.03% increase in the recent quarter.
Teradyne outperformed Microchip significantly, delivering the highest market returns over the last 12 months with sustained upward momentum and stronger buyer dominance.
Target Prices
Analysts present a bullish consensus for both Microchip Technology Incorporated and Teradyne, Inc., reflecting strong sector interest.
| Company | Target Low | Target High | Consensus |
|---|---|---|---|
| Microchip Technology Incorporated | 60 | 100 | 82.46 |
| Teradyne, Inc. | 136 | 280 | 230.17 |
Microchip’s target consensus exceeds its current price of 78.08, indicating upside potential. Teradyne’s consensus of 230.17 remains slightly below its 249.53 price, suggesting near-term valuation pressure.

Don’t Let Luck Decide Your Entry Point
Optimize your entry points with our advanced ProRealTime indicators. You’ll get efficient buy signals with precise price targets for maximum performance. Start outperforming now!
How do institutions grade them?
The institutional grades for Microchip Technology Incorporated and Teradyne, Inc. are summarized below:
Microchip Technology Incorporated Grades
The following table lists recent grades from reputable grading companies for Microchip Technology Incorporated.
| Grading Company | Action | New Grade | Date |
|---|---|---|---|
| Cantor Fitzgerald | Maintain | Overweight | 2026-02-02 |
| UBS | Maintain | Buy | 2026-01-26 |
| Susquehanna | Maintain | Positive | 2026-01-22 |
| B of A Securities | Maintain | Neutral | 2026-01-21 |
| Citigroup | Maintain | Buy | 2026-01-15 |
| Piper Sandler | Maintain | Overweight | 2026-01-15 |
| B. Riley Securities | Maintain | Buy | 2026-01-12 |
| Mizuho | Maintain | Outperform | 2026-01-09 |
| Wells Fargo | Maintain | Equal Weight | 2026-01-07 |
| JP Morgan | Maintain | Overweight | 2026-01-06 |
Teradyne, Inc. Grades
Below are recent grades from well-known grading firms for Teradyne, Inc.
| Grading Company | Action | New Grade | Date |
|---|---|---|---|
| Cantor Fitzgerald | Maintain | Overweight | 2026-02-02 |
| Stifel | Maintain | Buy | 2026-01-30 |
| UBS | Maintain | Buy | 2026-01-26 |
| B of A Securities | Maintain | Buy | 2026-01-22 |
| Stifel | Maintain | Buy | 2026-01-14 |
| B of A Securities | Maintain | Buy | 2026-01-13 |
| Goldman Sachs | Upgrade | Buy | 2025-12-16 |
| Stifel | Upgrade | Buy | 2025-12-02 |
| Citigroup | Maintain | Buy | 2025-11-12 |
| JP Morgan | Maintain | Neutral | 2025-10-30 |
Which company has the best grades?
Both companies command strong institutional support with multiple “Buy” and “Overweight” ratings. Teradyne benefits from recent upgrades by Goldman Sachs and Stifel, suggesting improving sentiment. Microchip’s spectrum includes “Outperform” and consistent “Buy” ratings. Investors can view both as favorably graded, though Teradyne’s upgrades may signal stronger near-term momentum.
Risks specific to each company
In the challenging 2026 market environment, the following categories identify critical pressure points and systemic threats facing both Microchip Technology Incorporated and Teradyne, Inc.:
1. Market & Competition
Microchip Technology Incorporated
- Faces intense competition in semiconductors with slower asset turnover signaling efficiency challenges.
Teradyne, Inc.
- Operates in diverse segments with higher asset turnover, but faces competitive pricing pressure.
2. Capital Structure & Debt
Microchip Technology Incorporated
- Moderate leverage with debt-to-assets at 37%, interest coverage low at 1.15x, raising refinancing concerns.
Teradyne, Inc.
- Very low leverage, debt-to-assets at 2%, strong interest coverage of 171x, indicating robust balance sheet.
3. Stock Volatility
Microchip Technology Incorporated
- Beta at 1.44 suggests above-market volatility, increasing risk in turbulent markets.
Teradyne, Inc.
- Higher beta of 1.82 implies greater stock price swings and sensitivity to market shocks.
4. Regulatory & Legal
Microchip Technology Incorporated
- Subject to semiconductor export controls and intellectual property litigation risks.
Teradyne, Inc.
- Exposure to export regulations and compliance costs across multiple test equipment segments.
5. Supply Chain & Operations
Microchip Technology Incorporated
- Complex supply chain for microcontrollers and analog products vulnerable to geopolitical tensions.
Teradyne, Inc.
- Relies on manufacturing partners and global logistics, with some diversification in industrial automation.
6. ESG & Climate Transition
Microchip Technology Incorporated
- Faces pressure to improve energy efficiency and reduce emissions in manufacturing processes.
Teradyne, Inc.
- Growing investments in automation could reduce carbon footprint, but scalability risks remain.
7. Geopolitical Exposure
Microchip Technology Incorporated
- Significant exposure to Asia-Pacific markets, sensitive to US-China trade tensions.
Teradyne, Inc.
- Also exposed globally but with diversified end markets, somewhat mitigating geopolitical risk.
Which company shows a better risk-adjusted profile?
Microchip’s most impactful risk is its weak profitability and strained interest coverage amid moderate leverage. Teradyne’s top risk lies in its high stock volatility and unfavorable valuation multiples. Overall, Teradyne shows a stronger risk-adjusted profile, supported by superior profitability, balance sheet strength, and a safer Altman Z-Score. Teradyne’s exceptional interest coverage ratio (170.8x) versus Microchip’s precarious 1.15x underscores this advantage.
Final Verdict: Which stock to choose?
Microchip Technology Incorporated’s superpower lies in its resilient balance sheet and strong liquidity metrics. It maintains a solid current ratio, signaling short-term financial health. However, its declining profitability and troubling ROIC trend remain points of vigilance. It might suit investors with a high tolerance for cyclical risk seeking turnaround opportunities.
Teradyne, Inc. boasts a strategic moat in its efficient capital allocation and consistent value creation, reflected in its solid ROIC exceeding WACC. It offers a safer profile with robust profitability and low leverage, providing steadier cash flow generation. This makes it a fit for portfolios focused on growth at a reasonable price and risk-averse growth investors.
If you prioritize stability and value creation, Teradyne outshines as the compelling choice due to its strong economic moat and safer financial footing. However, if you seek contrarian opportunities with potential for recovery, Microchip could offer upside despite current profitability challenges. Each stock appeals to distinct investor avatars balancing growth potential against risk.
Disclaimer: Investment carries a risk of loss of initial capital. The past performance is not a reliable indicator of future results. Be sure to understand risks before making an investment decision.
Go Further
I encourage you to read the complete analyses of Microchip Technology Incorporated and Teradyne, Inc. to enhance your investment decisions: