In the fast-evolving semiconductor industry, Microchip Technology Incorporated (MCHP) and Silicon Laboratories Inc. (SLAB) stand out as key players with overlapping market focuses. Both firms innovate in embedded control solutions and mixed-signal technologies, targeting applications from IoT to industrial automation. This comparison explores their strengths and strategies to help you identify the most promising investment opportunity in this dynamic sector. Let’s uncover which company deserves a place in your portfolio.
Table of contents
Companies Overview
I will begin the comparison between Microchip Technology Incorporated and Silicon Laboratories Inc. by providing an overview of these two companies and their main differences.
Microchip Technology Incorporated Overview
Microchip Technology Incorporated develops and sells embedded control solutions globally, focusing on microcontrollers, microprocessors, and analog products. Its offerings serve diverse industries including automotive, industrial, and communications. Headquartered in Chandler, Arizona, Microchip is a major player in the semiconductors sector with a broad product portfolio spanning memory, security, and timing products.
Silicon Laboratories Inc. Overview
Silicon Laboratories Inc. is a fabless semiconductor company specializing in analog-intensive mixed-signal solutions. Its product range includes wireless microcontrollers and sensors primarily targeting IoT applications such as smart homes, industrial automation, and medical instrumentation. Based in Austin, Texas, Silicon Labs operates internationally and emphasizes connectivity and automation markets.
Key similarities and differences
Both companies operate in the semiconductor industry and develop microcontroller-based technologies. Microchip offers a wider product portfolio with manufacturing services and memory products, while Silicon Labs focuses on fabless design and analog mixed-signal solutions for IoT applications. Microchip is substantially larger with over 22,000 employees compared to Silicon Labs’ 1,889, reflecting different scales and market approaches.
Income Statement Comparison
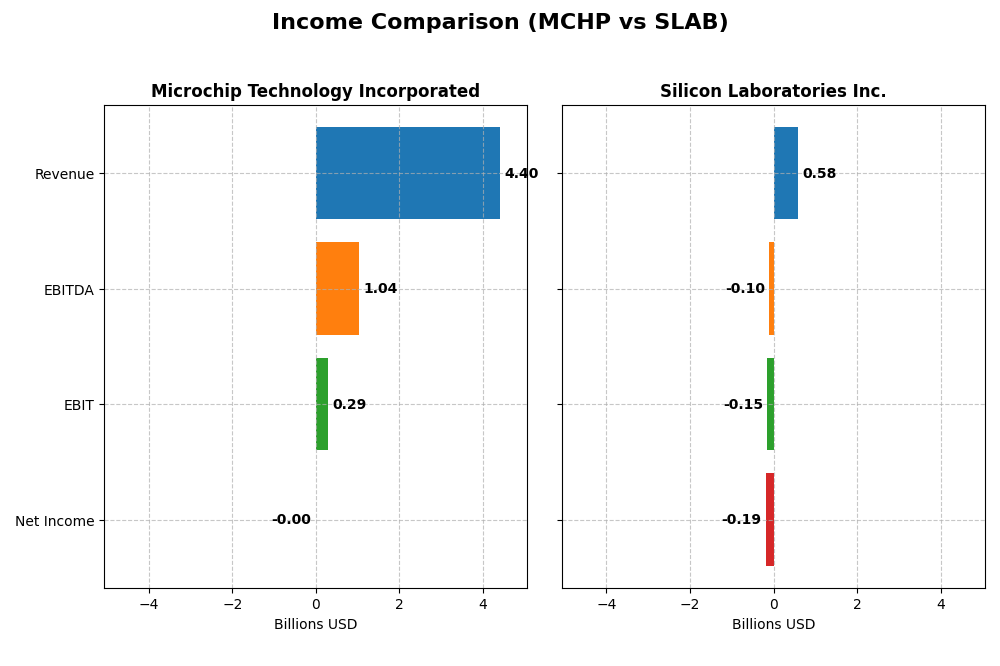
Below is a comparison of key income statement metrics for Microchip Technology Incorporated and Silicon Laboratories Inc. for their most recent fiscal years.
| Metric | Microchip Technology Incorporated | Silicon Laboratories Inc. |
|---|---|---|
| Market Cap | 35B | 4.3B |
| Revenue | 4.4B | 584M |
| EBITDA | 1.04B | -105M |
| EBIT | 290M | -154M |
| Net Income | -0.5M | -191M |
| EPS | -0.005 | -5.93 |
| Fiscal Year | 2025 | 2024 |
Income Statement Interpretations
Microchip Technology Incorporated
Microchip Technology saw overall declining revenue and net income from 2021 to 2025, with revenue dropping by about 19% over the period. Gross margins remained favorable at 56.07%, but net margin turned slightly negative at -0.01% in 2025. The most recent year reflected a sharp decline in growth and profitability, with net income falling into a small loss and EBIT margin neutral.
Silicon Laboratories Inc.
Silicon Laboratories experienced revenue growth of 14.38% over the 2020-2024 period but faced a steep net income decline, with net margin turning deeply negative at -32.69% in the latest year. Gross margin was favorable at 53.42%, yet EBIT margin was significantly negative at -26.27%. The latest year showed continued revenue contraction and worsening earnings, highlighting ongoing profitability challenges.
Which one has the stronger fundamentals?
Both companies have unfavorable overall income statement evaluations with significant declines in net income and margins. Microchip maintains a stronger gross margin and neutral EBIT margin but suffered a net loss in 2025. Silicon Laboratories shows revenue growth but deep losses and negative margins. Neither exhibits strong fundamentals currently, with Microchip’s scale contrasting Silicon Laboratories’ sharper profitability issues.
Financial Ratios Comparison
This table presents a side-by-side comparison of key financial ratios for Microchip Technology Incorporated (MCHP) and Silicon Laboratories Inc. (SLAB) based on their most recent fiscal year data.
| Ratios | Microchip Technology Incorporated (MCHP) | Silicon Laboratories Inc. (SLAB) |
|---|---|---|
| ROE | -0.01% | -17.69% |
| ROIC | -0.03% | -18.15% |
| P/E | -52021 | -21.53 |
| P/B | 3.67 | 3.81 |
| Current Ratio | 2.59 | 6.15 |
| Quick Ratio | 1.47 | 5.07 |
| D/E | 0.80 | 0.01 |
| Debt-to-Assets | 36.85% | 1.27% |
| Interest Coverage | 1.18 | -126.33 |
| Asset Turnover | 0.29 | 0.48 |
| Fixed Asset Turnover | 3.72 | 4.42 |
| Payout ratio | -1951.4% | 0% |
| Dividend yield | 3.75% | 0% |
Interpretation of the Ratios
Microchip Technology Incorporated
Microchip Technology shows mixed financial strength with favorable liquidity ratios but unfavorable profitability metrics such as negative net margin and return on equity. Its dividend yield stands at a healthy 3.75%, supported by a consistent dividend payout, though some risks exist due to weak income quality and interest coverage. Shareholder returns appear stable but warrant cautious monitoring.
Silicon Laboratories Inc.
Silicon Laboratories exhibits overall unfavorable financial ratios, notably a deep negative net margin and return on equity, indicating profitability challenges. The company does not pay dividends, reflecting its high investment in R&D and growth initiatives. Its strong liquidity and low debt ratios emphasize financial prudence, despite operational inefficiencies and negative free cash flow yield.
Which one has the best ratios?
Comparing both, Microchip Technology holds a slightly unfavorable rating but presents better profitability and dividend returns. Silicon Laboratories faces more pronounced unfavorable conditions with a lack of dividend payments and greater profitability concerns. Microchip’s balanced liquidity and shareholder return metrics edge it ahead in ratio quality.
Strategic Positioning
This section compares the strategic positioning of Microchip Technology Incorporated and Silicon Laboratories Inc. based on Market position, Key segments, and Exposure to technological disruption:
Microchip Technology Incorporated
- Large market cap of 35B with broad semiconductor industry reach; faces competitive pressure in embedded control solutions.
- Key segments include general-purpose microcontrollers, analog, memory products, and technology licensing driving semiconductor revenues.
- Exposure to technological disruption includes embedded control and analog advancements; licenses embedded flash technology.
Silicon Laboratories Inc.
- Smaller market cap of 4.3B, fabless semiconductor model focused on mixed-signal solutions, facing competition in IoT markets.
- Focused on industrial, commercial, and IoT applications with products like wireless microcontrollers and sensors.
- Faces disruption through innovation in analog-intensive mixed-signal and wireless IoT sectors.
Microchip Technology Incorporated vs Silicon Laboratories Inc. Positioning
Microchip’s approach is diversified across multiple semiconductor product lines and licensing, supporting various applications. Silicon Labs is more concentrated on IoT and mixed-signal solutions, targeting specific industrial and commercial markets. Diversification offers broader exposure, while concentration allows focused innovation.
Which has the best competitive advantage?
Both companies show a very unfavorable MOAT evaluation with declining ROIC below WACC, indicating value destruction and decreasing profitability; neither currently demonstrates a sustainable competitive advantage based on provided data.
Stock Comparison
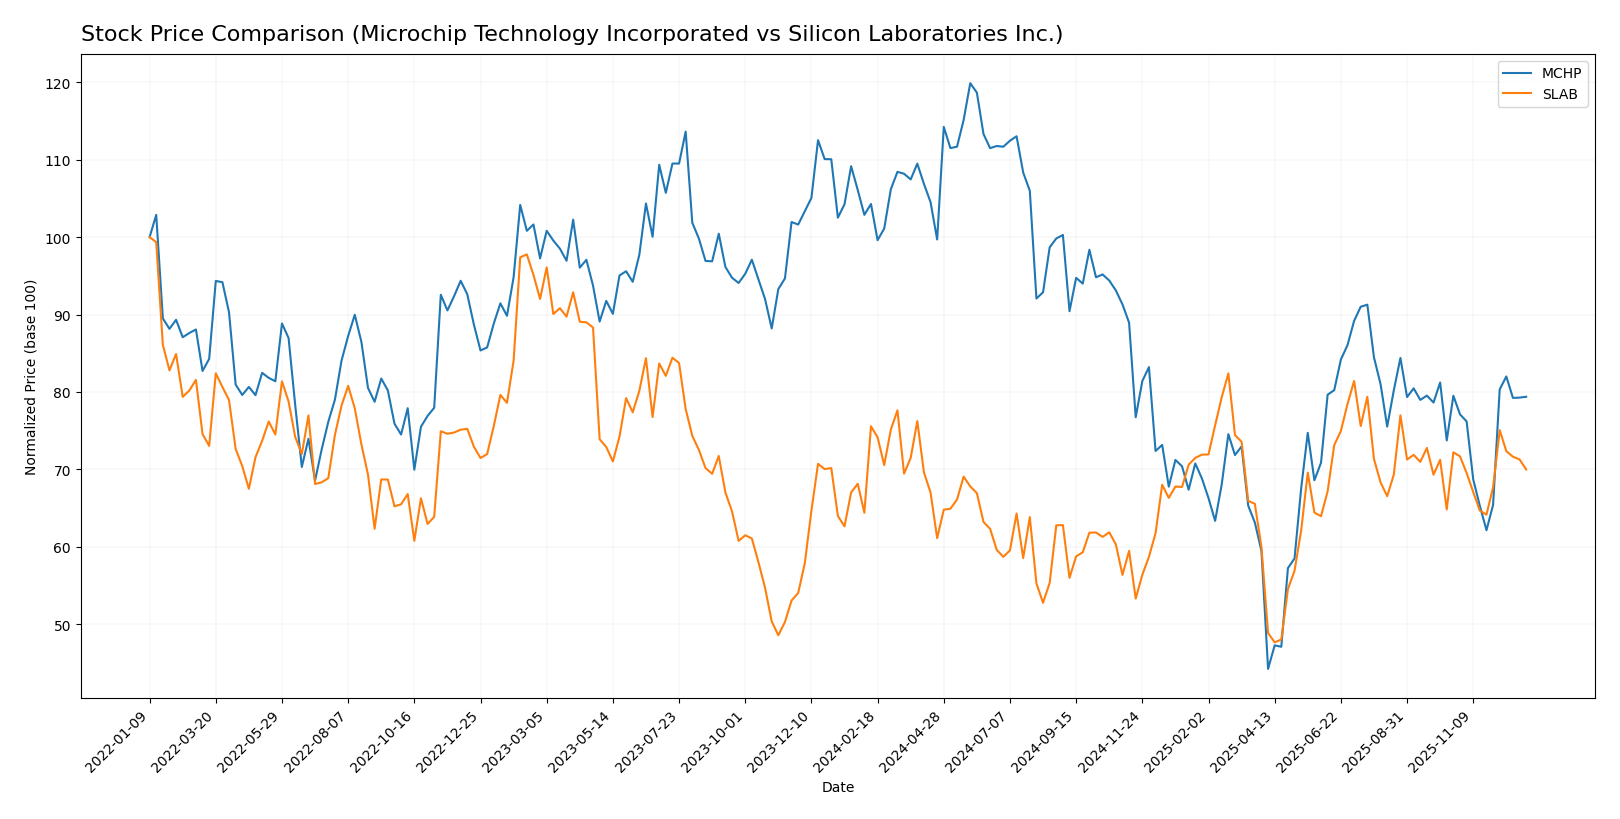
The stock price movements of Microchip Technology Incorporated (MCHP) and Silicon Laboratories Inc. (SLAB) over the past 12 months reveal distinct bearish trends with accelerating declines and notable volatility differences.
Trend Analysis
Microchip Technology Incorporated (MCHP) experienced a bearish trend over the past year with a price decline of 23.89%. The trend shows acceleration, a high volatility with a 14.5 standard deviation, and price ranges between 36.22 and 98.23.
Silicon Laboratories Inc. (SLAB) also displayed a bearish trend over the last 12 months with a 7.39% price decrease. The trend accelerated, volatility was slightly lower at 13.91 standard deviation, with prices fluctuating between 89.82 and 155.33.
Comparing both stocks, MCHP recorded a larger percentage decline, indicating SLAB delivered the higher market performance over the analyzed period despite both showing bearish momentum.
Target Prices
The analyst consensus indicates moderate upside potential for these semiconductor companies.
| Company | Target High | Target Low | Consensus |
|---|---|---|---|
| Microchip Technology Incorporated | 85 | 60 | 73.83 |
| Silicon Laboratories Inc. | 165 | 130 | 147.5 |
Analysts expect Microchip Technology’s stock to appreciate from the current $65.03 to around $73.83 on average, while Silicon Laboratories’ price consensus is significantly above its current $131.93, signaling bullish sentiment.
Analyst Opinions Comparison
This section compares analysts’ ratings and grades for Microchip Technology Incorporated and Silicon Laboratories Inc.:
Rating Comparison
MCHP Rating
- Rating: C-, classified as Very Favorable by analysts.
- Discounted Cash Flow Score: Moderate, with a score of 3.
- ROE Score: Very Unfavorable, scoring 1.
- ROA Score: Very Unfavorable, scoring 1.
- Debt To Equity Score: Very Unfavorable, scoring 1.
- Overall Score: Very Unfavorable, with a score of 1.
SLAB Rating
- Rating: C-, also classified as Very Favorable by analysts.
- Discounted Cash Flow Score: Moderate, with a score of 2.
- ROE Score: Very Unfavorable, scoring 1.
- ROA Score: Very Unfavorable, scoring 1.
- Debt To Equity Score: Very Unfavorable, scoring 1.
- Overall Score: Very Unfavorable, with a score of 1.
Which one is the best rated?
Both Microchip Technology Incorporated and Silicon Laboratories Inc. share the same overall rating of C- and identical scores in ROE, ROA, debt to equity, and overall score. MCHP has a slightly higher discounted cash flow score than SLAB, making its valuation metric moderately stronger.
Scores Comparison
Here is a comparison of the Altman Z-Score and Piotroski Score for the two companies:
MCHP Scores
- Altman Z-Score: 3.60, indicating a safe zone financial stability.
- Piotroski Score: 3, classified as very weak financial strength.
SLAB Scores
- Altman Z-Score: 15.59, indicating a safe zone financial stability.
- Piotroski Score: 4, classified as average financial strength.
Which company has the best scores?
SLAB has higher scores on both metrics, with a much stronger Altman Z-Score and a better Piotroski Score than MCHP, indicating comparatively better financial health based on the provided data.
Grades Comparison
Here is the comparison of recent grades for Microchip Technology Incorporated and Silicon Laboratories Inc.:
Microchip Technology Incorporated Grades
This table summarizes recent grades assigned by reputable grading companies for Microchip Technology Incorporated.
| Grading Company | Action | New Grade | Date |
|---|---|---|---|
| Cantor Fitzgerald | Upgrade | Overweight | 2025-12-16 |
| B of A Securities | Maintain | Neutral | 2025-12-05 |
| Needham | Maintain | Buy | 2025-12-04 |
| Rosenblatt | Maintain | Buy | 2025-12-03 |
| Wells Fargo | Maintain | Equal Weight | 2025-11-07 |
| Citigroup | Maintain | Buy | 2025-11-07 |
| Cantor Fitzgerald | Maintain | Neutral | 2025-11-07 |
| Stifel | Maintain | Buy | 2025-11-07 |
| Truist Securities | Maintain | Hold | 2025-11-07 |
| Needham | Maintain | Buy | 2025-11-07 |
The overall trend for Microchip Technology shows a majority of Buy and Neutral grades, with a recent upgrade to Overweight by Cantor Fitzgerald.
Silicon Laboratories Inc. Grades
This table presents recent grades from recognized grading companies for Silicon Laboratories Inc.
| Grading Company | Action | New Grade | Date |
|---|---|---|---|
| Morgan Stanley | Maintain | Equal Weight | 2025-08-06 |
| Susquehanna | Maintain | Neutral | 2025-08-06 |
| Barclays | Maintain | Equal Weight | 2025-08-05 |
| Susquehanna | Maintain | Neutral | 2025-07-22 |
| Stifel | Maintain | Buy | 2025-07-18 |
| Keybanc | Maintain | Overweight | 2025-07-08 |
| Benchmark | Maintain | Buy | 2025-05-27 |
| Needham | Maintain | Buy | 2025-05-14 |
| Susquehanna | Maintain | Neutral | 2025-05-14 |
| Benchmark | Maintain | Buy | 2025-05-14 |
Silicon Laboratories shows a stable pattern with mostly Buy, Neutral, and Overweight ratings maintained over recent months.
Which company has the best grades?
Microchip Technology Incorporated has received a higher concentration of Buy ratings with a recent upgrade to Overweight, while Silicon Laboratories maintains a balanced mix of Buy, Neutral, and Equal Weight grades. Investors may interpret Microchip’s more consistent Buy grades as a stronger endorsement from analysts compared to Silicon Laboratories’ more cautious outlook.
Strengths and Weaknesses
Below is a comparative table highlighting key strengths and weaknesses of Microchip Technology Incorporated (MCHP) and Silicon Laboratories Inc. (SLAB) based on their latest financial and operational data.
| Criterion | Microchip Technology Incorporated (MCHP) | Silicon Laboratories Inc. (SLAB) |
|---|---|---|
| Diversification | Strong focus on semiconductor products with technology licensing contributing marginally; stable product mix. | Narrower focus on Industrial & Commercial segment recently; less diversified product base. |
| Profitability | Negative net margin (-0.01%), declining ROIC, but maintains dividend yield of 3.75%. | Significant losses with net margin at -32.69%, severely negative ROIC, no dividend yield. |
| Innovation | Moderate innovation reflected in stable licensing revenue; fixed asset turnover favorable. | Innovation impact unclear; fixed asset turnover favorable but profitability and ROIC are poor. |
| Global presence | Global semiconductor market participation with diversified customer base. | Industrial & Commercial focus suggests more specialized, possibly regional market presence. |
| Market Share | Large revenue base in semiconductor products (4.27B in 2025) but declining profitability. | Smaller revenue scale (338M in 2024) with heavy losses and deteriorating profitability. |
Key takeaways: Both companies face significant profitability challenges with negative ROIC trends, indicating value destruction. Microchip has a larger, more diversified portfolio and pays dividends, while Silicon Labs shows deeper losses and narrower focus, posing higher risk for investors.
Risk Analysis
Below is a comparison of key risks for Microchip Technology Incorporated (MCHP) and Silicon Laboratories Inc. (SLAB) based on the most recent data available for 2025 and 2024 respectively.
| Metric | Microchip Technology Incorporated (MCHP) | Silicon Laboratories Inc. (SLAB) |
|---|---|---|
| Market Risk | Beta 1.46 indicating higher volatility; semiconductor industry cyclicality | Beta 1.56, slightly more volatile; exposed to IoT market fluctuations |
| Debt level | Moderate debt-to-equity 0.8; debt-to-assets 36.85% (neutral) | Very low debt-to-equity 0.01; debt-to-assets 1.27% (favorable) |
| Regulatory Risk | Exposure to global trade regulations, tech export controls | Similar regulatory exposure, with additional risks in China market |
| Operational Risk | Large scale with 22.3K employees, supply chain complexity | Smaller scale (1.9K employees); fabless model reduces manufacturing risks |
| Environmental Risk | Moderate, given manufacturing and semiconductor waste | Lower impact due to fabless model, but still exposed to electronic waste regulations |
| Geopolitical Risk | Operations in Americas, Europe, Asia; supply chain sensitive to geopolitical tensions | Global presence including China; IoT components vulnerable to trade disputes |
The most impactful risks for these companies are market volatility and operational challenges. Microchip’s moderate leverage and large manufacturing base expose it to supply chain disruptions and interest coverage concerns. Silicon Labs’ minimal debt reduces financial risk but its significant net losses and geopolitical exposure in China raise concerns. Both face regulatory and environmental pressures typical in semiconductors. Caution is advised given Microchip’s slightly unfavorable financial ratios and Silicon Labs’ unfavorable profitability metrics.
Which Stock to Choose?
Microchip Technology Incorporated (MCHP) shows a declining income trend with unfavorable net margin and profitability ratios. Its debt levels are moderate, with a current ratio of 2.59, but overall its financial ratios and income statement evaluations are slightly unfavorable. The company’s rating stands at C- with a very unfavorable overall score, despite a safe zone Altman Z-Score.
Silicon Laboratories Inc. (SLAB) also suffers from negative profitability and net margin, with unfavorable income growth and financial ratios. Its debt burden is low, with a strong current ratio, but it faces a generally unfavorable financial outlook. SLAB holds a C- rating with a very unfavorable overall score, though it boasts a safe zone Altman Z-Score and an average Piotroski score.
For risk-tolerant investors focusing on turnaround potential, both companies might appear challenging given their unfavorable financial and income statement trends. Those prioritizing financial stability may note SLAB’s lower debt and stronger liquidity, while cautious investors might view MCHP’s rating and score profile as slightly less unfavorable. The interpretation depends on the investor’s tolerance for volatility and preference for value versus quality metrics.
Disclaimer: Investment carries a risk of loss of initial capital. The past performance is not a reliable indicator of future results. Be sure to understand risks before making an investment decision.
Go Further
I encourage you to read the complete analyses of Microchip Technology Incorporated and Silicon Laboratories Inc. to enhance your investment decisions: