In the rapidly evolving semiconductor industry, Microchip Technology Incorporated and Qnity Electronics, Inc. stand out as key players driving innovation. Microchip offers a broad range of embedded control solutions, while Qnity specializes in advanced electronic materials for chip manufacturing. Their market overlap and differing strategies make them compelling rivals. Join me as we analyze both companies to identify the most promising investment opportunity for your portfolio.
Table of contents
Companies Overview
I will begin the comparison between Microchip Technology Incorporated and Qnity Electronics, Inc. by providing an overview of these two companies and their main differences.
Microchip Technology Incorporated Overview
Microchip Technology Incorporated develops, manufactures, and sells embedded control solutions worldwide. It offers microcontrollers, microprocessors, FPGAs, analog and mixed-signal products, memory products, and engineering services. The company serves diverse markets including automotive, industrial, communications, and aerospace. Headquartered in Chandler, Arizona, Microchip has a strong market presence with a $40.2B market cap and employs 22,300 people.
Qnity Electronics, Inc. Overview
Qnity Electronics, Inc. specializes in electronic solutions and materials for semiconductor chip manufacturing and advanced electronic materials. Formerly Novus SpinCo 1, the company rebranded in April 2025 and is based in Wilmington, Delaware. Qnity is a younger, smaller player with a market cap of $19.5B and is listed on the NYSE. Its workforce size is not disclosed, reflecting its recent market entry in late 2025.
Key similarities and differences
Both Microchip and Qnity operate in the semiconductor industry within the technology sector in the US. Microchip focuses on embedded control systems and broad semiconductor components for multiple applications, while Qnity concentrates on materials and solutions for semiconductor manufacturing. Microchip is more established with a larger market cap and employee base, whereas Qnity is a newer company still expanding its footprint.
Income Statement Comparison
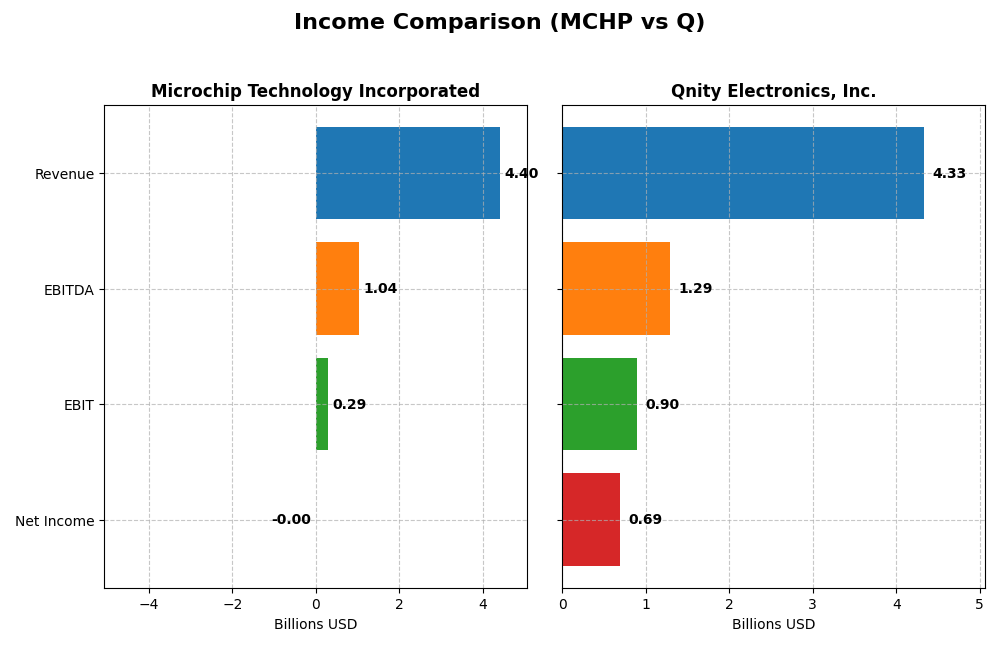
The table below compares key income statement metrics for Microchip Technology Incorporated and Qnity Electronics, Inc. for their most recent fiscal years.
| Metric | Microchip Technology Incorporated | Qnity Electronics, Inc. |
|---|---|---|
| Market Cap | 40.2B | 19.5B |
| Revenue | 4.40B (2025) | 4.34B (2024) |
| EBITDA | 1.04B (2025) | 1.29B (2024) |
| EBIT | 290M (2025) | 898M (2024) |
| Net Income | -0.5M (2025) | 693M (2024) |
| EPS | -0.005 (2025) | 3.31 (2024) |
| Fiscal Year | 2025 | 2024 |
Income Statement Interpretations
Microchip Technology Incorporated
From 2021 to 2025, Microchip Technology experienced a declining revenue trend, falling from $5.44B to $4.40B in 2025, with net income turning negative in the latest fiscal year. Gross margin remained relatively high at 56.07%, but net margin dropped to -0.01%, indicating profitability challenges. The most recent year showed significant revenue and earnings deterioration, with net income at -$0.5M.
Qnity Electronics, Inc.
Qnity’s revenue showed slight fluctuations from $4.76B in 2022 to $4.34B in 2024, with net income reaching $693M in 2024. Margins improved, with a gross margin of 46.11% and a strong net margin of 15.99%. The latest year marked moderate revenue growth and improved profitability, supported by a 27.23% rise in net margin and a 36.69% increase in EPS.
Which one has the stronger fundamentals?
Qnity Electronics demonstrates stronger fundamentals with favorable margins and year-over-year improvements in profitability metrics, despite a slight overall revenue decline. Microchip Technology’s declining revenue and negative net income in the latest year contrast with its previously robust margins, leading to an overall unfavorable income statement evaluation. Qnity’s positive growth in earnings and margins positions it more favorably in this comparison.
Financial Ratios Comparison
Below is a comparison of key financial ratios for Microchip Technology Incorporated (MCHP) and Qnity Electronics, Inc. (Q) based on their most recent fiscal year data.
| Ratios | Microchip Technology Incorporated (MCHP) | Qnity Electronics, Inc. (Q) |
|---|---|---|
| ROE | -0.007% | 6.51% |
| ROIC | -0.027% | 5.92% |
| P/E | -52021.4 (negative earnings) | 28.8 |
| P/B | 3.67 | 1.88 |
| Current Ratio | 2.59 | 1.77 |
| Quick Ratio | 1.47 | 1.06 |
| D/E (Debt-to-Equity) | 0.80 | 0.018 |
| Debt-to-Assets | 36.9% | 1.56% |
| Interest Coverage | 1.18 | 3.03 |
| Asset Turnover | 0.29 | 0.35 |
| Fixed Asset Turnover | 3.72 | 2.59 |
| Payout ratio | -1951.4% (negative earnings) | 0% |
| Dividend yield | 3.75% | 0% |
Interpretation of the Ratios
Microchip Technology Incorporated
Microchip’s ratios show a mixed picture with 35.7% favorable and 42.9% unfavorable, leading to a slightly unfavorable overall assessment. Concerns include negative net margin, return on equity, and return on invested capital, along with weak interest coverage and asset turnover. The company maintains a strong current and quick ratio and a solid dividend yield of 3.75%, indicating consistent shareholder returns supported by dividend payouts.
Qnity Electronics, Inc.
Qnity presents a slightly favorable ratio profile with 42.9% favorable and 28.6% unfavorable metrics. Strong points include a favorable net margin of 15.99%, low debt levels, and good liquidity ratios, while weaker aspects include a high P/E ratio and an unfavorable asset turnover. The company does not pay dividends, likely prioritizing reinvestment and growth strategies at this stage.
Which one has the best ratios?
Qnity Electronics holds a slight edge with a higher proportion of favorable ratios and lower debt burden, suggesting better operational efficiency and financial stability. Microchip Technology, despite its strong liquidity and dividend yield, faces challenges with profitability and leverage metrics, rendering its ratio profile more mixed and slightly unfavorable in comparison.
Strategic Positioning
This section compares the strategic positioning of Microchip Technology Incorporated and Qnity Electronics, Inc. focusing on Market position, Key segments, and Exposure to technological disruption:
Microchip Technology Incorporated
- Market position and competitive pressure
- Key segments and business drivers
- Exposure to technological disruption
Qnity Electronics, Inc.
- Larger market cap at 40B, more established in semiconductors
- Diverse microcontrollers, analog, memory products, licensing
- Embedded, wireless, and security tech across industries
Microchip Technology Incorporated vs Qnity Electronics, Inc. Positioning
Microchip shows a diversified product portfolio across multiple semiconductor segments, enabling broad market reach. Qnity Electronics has a more concentrated focus on electronic materials, limiting diversification but specializing in chip manufacturing inputs.
Which has the best competitive advantage?
Microchip’s declining ROIC relative to WACC indicates value destruction and a very unfavorable moat, whereas Qnity maintains stable profitability with a neutral moat, showing neither strong advantage nor significant disadvantage.
Stock Comparison
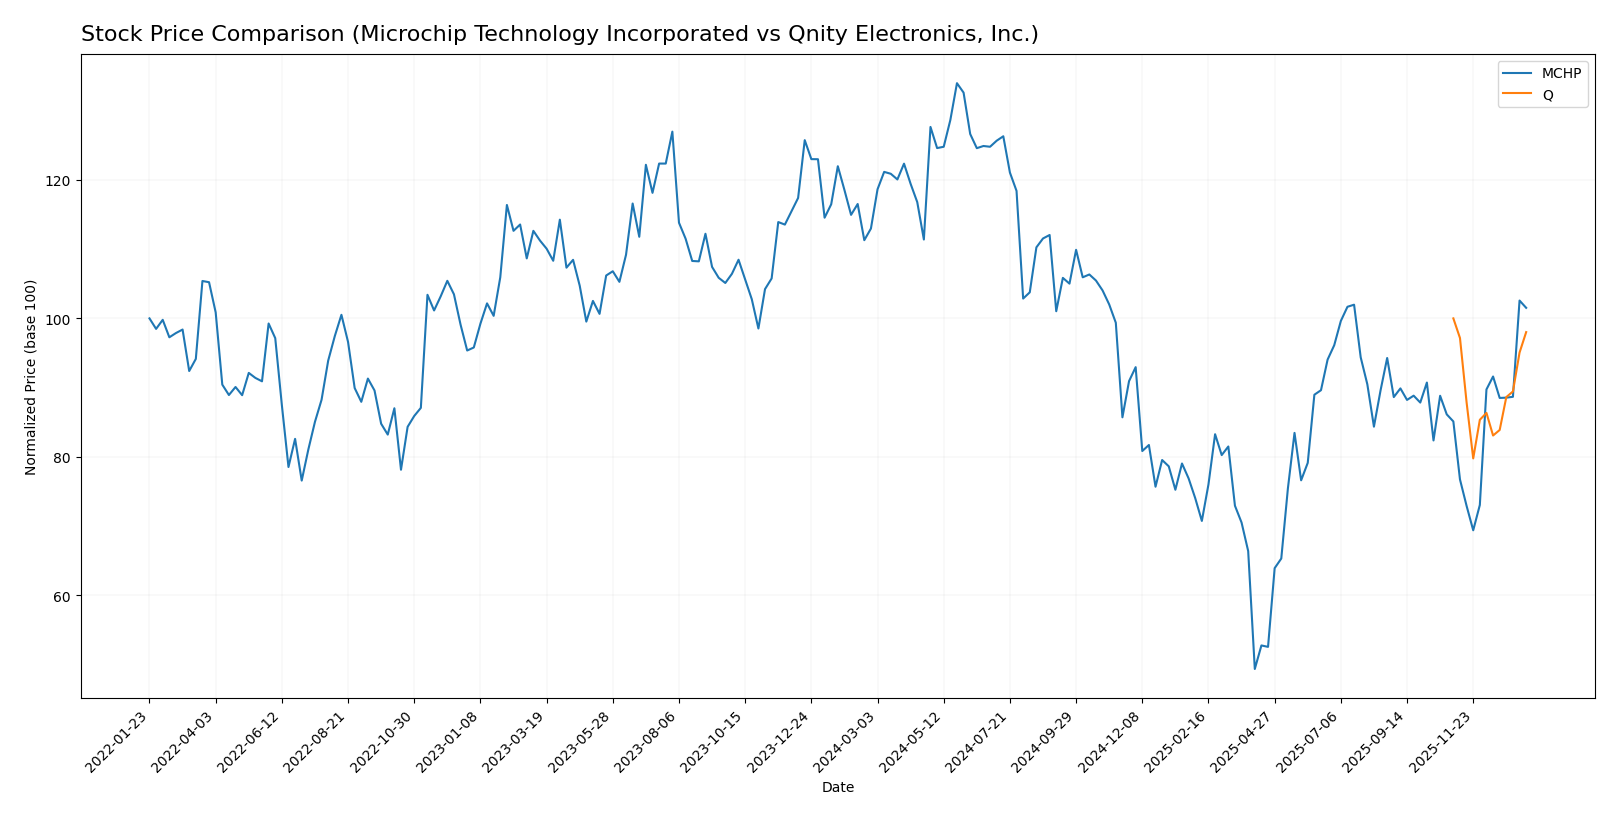
The stock prices of Microchip Technology Incorporated and Qnity Electronics, Inc. have exhibited contrasting dynamics over the past year, with Microchip showing a significant overall decline but recent recovery, while Qnity’s price remained relatively stable with minor fluctuations.
Trend Analysis
Microchip Technology Incorporated’s stock displayed a bearish trend over the past 12 months, with a 10.13% decline and accelerating downward momentum. The price ranged from a high of 98.23 to a low of 36.22, indicating significant volatility (std deviation 14.38).
Qnity Electronics, Inc. showed a near-neutral but technically bearish trend with a 1.98% price decrease over the same period. Its price fluctuated less widely between 75.8 and 95.0, with stable acceleration and lower volatility (std deviation 5.94).
Comparing the two, Microchip experienced a more pronounced decline but stronger recent recovery, while Qnity maintained a more stable price. Microchip’s stock delivered lower overall market performance over the past year.
Target Prices
Here is the current analyst target price consensus for the selected semiconductor companies:
| Company | Target High | Target Low | Consensus |
|---|---|---|---|
| Microchip Technology Incorporated | 85 | 60 | 77.44 |
| Qnity Electronics, Inc. | 117 | 92 | 105.89 |
Analysts expect Microchip Technology’s stock to appreciate moderately, with a consensus target above its current price of $74.45. Qnity Electronics has a higher upside potential relative to its present price of $93.12, reflecting optimism about its recent market entry.
Analyst Opinions Comparison
This section compares analysts’ ratings and grades for Microchip Technology Incorporated and Qnity Electronics, Inc.:
Rating Comparison
Microchip Technology Incorporated Rating
- Rating: C- indicating a very favorable view
- Discounted Cash Flow Score: 3, moderate value
- ROE Score: 1, very unfavorable efficiency
- ROA Score: 1, very unfavorable asset use
- Debt To Equity Score: 1, very unfavorable risk
- Overall Score: 1, very unfavorable overall
Qnity Electronics, Inc. Rating
- Rating: B+ reflecting a very favorable stance
- Discounted Cash Flow Score: 4, favorable level
- ROE Score: 3, moderate profitability
- ROA Score: 4, favorable asset utilization
- Debt To Equity Score: 3, moderate financial risk
- Overall Score: 3, moderate overall performance
Which one is the best rated?
Based strictly on the provided data, Qnity Electronics, Inc. is better rated with higher scores across discounted cash flow, ROE, ROA, debt to equity, and overall metrics compared to Microchip Technology Incorporated.
Scores Comparison
Here is a comparison of the company scores based on Altman Z-Score and Piotroski Score:
MCHP Scores
- Altman Z-Score: 3.999, indicating a safe zone from bankruptcy risk.
- Piotroski Score: 3, classified as very weak financial strength.
Q Scores
- No data available
- No data available
Which company has the best scores?
Based on the provided data, MCHP has a clear Altman Z-Score advantage, indicating financial safety, but a very weak Piotroski Score. Q has no score data available for comparison.
Grades Comparison
Here is a comparison of the recent grades for Microchip Technology Incorporated and Qnity Electronics, Inc.:
Microchip Technology Incorporated Grades
This table shows recent grades from reputable grading companies for Microchip Technology Incorporated:
| Grading Company | Action | New Grade | Date |
|---|---|---|---|
| Piper Sandler | Maintain | Overweight | 2026-01-15 |
| B. Riley Securities | Maintain | Buy | 2026-01-12 |
| Mizuho | Maintain | Outperform | 2026-01-09 |
| Wells Fargo | Maintain | Equal Weight | 2026-01-07 |
| JP Morgan | Maintain | Overweight | 2026-01-06 |
| Morgan Stanley | Maintain | Equal Weight | 2026-01-06 |
| Stifel | Maintain | Buy | 2026-01-06 |
| Rosenblatt | Maintain | Buy | 2026-01-06 |
| Needham | Maintain | Buy | 2026-01-06 |
| Cantor Fitzgerald | Upgrade | Overweight | 2025-12-16 |
Overall, the grades for Microchip Technology show a strong buy and overweight trend from leading analysts, with no recent downgrades.
Qnity Electronics, Inc. Grades
This table summarizes the recent grades from reliable grading firms for Qnity Electronics, Inc.:
| Grading Company | Action | New Grade | Date |
|---|---|---|---|
| RBC Capital | Maintain | Outperform | 2025-11-25 |
| Mizuho | Maintain | Outperform | 2025-11-20 |
The grades for Qnity Electronics remain consistently positive, with outperform ratings maintained by two key analysts.
Which company has the best grades?
Microchip Technology Incorporated has received a larger number of buy and overweight ratings compared to Qnity Electronics, which has fewer but solid outperform grades. This breadth of positive ratings for Microchip may suggest stronger analyst conviction, potentially affecting investor confidence and portfolio decisions.
Strengths and Weaknesses
Below is a comparison table highlighting the key strengths and weaknesses of Microchip Technology Incorporated (MCHP) and Qnity Electronics, Inc. (Q) based on the most recent financial and operational data.
| Criterion | Microchip Technology Incorporated (MCHP) | Qnity Electronics, Inc. (Q) |
|---|---|---|
| Diversification | Moderate: Primarily semiconductor products with a small technology licensing segment | Limited data available; likely focused on core electronics products |
| Profitability | Weak: Negative net margin (-0.01%) and declining ROIC indicate value destruction | Moderate: Positive net margin (15.99%) but ROIC is neutral; profitability stable |
| Innovation | Moderate: Technology licensing revenues present but declining | Insufficient data; no clear innovation metrics available |
| Global presence | Strong: Large semiconductor revenue ($4.27B in 2025) suggests broad market reach | Unknown; limited financial data to assess global presence |
| Market Share | Facing challenges: declining profitability and unfavorable asset turnover | Stable: Slightly favorable financial ratios but lower asset turnover than ideal |
Key takeaways: Microchip Technology shows a strong product base but struggles with value destruction and declining profitability, implying risks for investors. Qnity Electronics maintains stable profitability with a neutral moat, presenting a more cautious but potentially steadier investment option. Risk management is advised when considering MCHP due to its unfavorable financial trends.
Risk Analysis
Below is a comparison table of key risks for Microchip Technology Incorporated (MCHP) and Qnity Electronics, Inc. (Q) based on the latest available data for 2025 and 2024 respectively:
| Metric | Microchip Technology Incorporated (MCHP) | Qnity Electronics, Inc. (Q) |
|---|---|---|
| Market Risk | High beta at 1.445 indicates higher volatility vs. market | Beta unavailable, but recent IPO suggests volatility risk |
| Debt level | Moderate debt-to-assets at 36.85%, debt/equity 0.8 (neutral) | Very low debt-to-assets at 1.56%, debt/equity 0.02 (favorable) |
| Regulatory Risk | Semiconductor industry sensitive to trade policies and export controls | Similar industry exposure; newly public, regulatory compliance evolving |
| Operational Risk | Large employee base (22,300) with complex supply chain | Smaller, less established operational footprint |
| Environmental Risk | Industry involves hazardous materials; compliance required | Same industry risks, but less disclosed data due to recent IPO |
| Geopolitical Risk | Global supply chain exposure with operations in Americas, Europe, Asia | US-based but semiconductor supply chains globally impacted by geopolitical tensions |
Microchip’s higher market volatility and moderate leverage pose notable risks, while Q benefits from a cleaner balance sheet but faces uncertainties typical for recent IPOs. Geopolitical tensions and regulatory changes remain critical for both, given their semiconductor industry exposure.
Which Stock to Choose?
Microchip Technology Incorporated (MCHP) shows a declining income trend with a -42% revenue drop in 2025 and mostly unfavorable financial ratios. Profitability and returns on equity and assets are negative, debt levels are moderate, and the overall rating is very unfavorable.
Qnity Electronics, Inc. (Q) presents a more stable income evolution with modest revenue growth and mostly favorable income margins in 2024. Financial ratios are slightly favorable overall, with low debt and a moderate overall rating, reflecting stable operational efficiency.
For risk-averse investors seeking stability and moderately favorable financial health, Q may appear more suitable, while those with a higher risk tolerance considering value destruction signs at MCHP might interpret its situation differently. The choice could depend on individual investment profiles and risk appetite.
Disclaimer: Investment carries a risk of loss of initial capital. The past performance is not a reliable indicator of future results. Be sure to understand risks before making an investment decision.
Go Further
I encourage you to read the complete analyses of Microchip Technology Incorporated and Qnity Electronics, Inc. to enhance your investment decisions: