Home > Comparison > Technology > MCHP vs NVEC
The strategic rivalry between Microchip Technology Incorporated and NVE Corporation shapes key trends in the semiconductor sector. Microchip operates as a capital-intensive giant, offering diverse embedded control solutions globally. In contrast, NVE focuses on niche spintronic sensors with a lean operational model. This head-to-head reflects a battle between scale-driven breadth and specialized innovation. This analysis will identify which company delivers superior risk-adjusted returns for a diversified portfolio in 2026.
Table of contents
Companies Overview
Microchip Technology Incorporated and NVE Corporation both hold distinctive roles in the semiconductor sector, shaping critical technology niches.
Microchip Technology Incorporated: Embedded Control Solutions Leader
Microchip Technology Incorporated dominates the embedded control market with a broad portfolio of microcontrollers and analog products. It generates revenue by supplying automotive, industrial, and communication sectors with secure, connected solutions. In 2026, the company emphasizes expanding its footprint in embedded security and power management technologies, reinforcing its competitive edge across multiple global markets.
NVE Corporation: Spintronics Innovator
NVE Corporation specializes in spintronic sensors and couplers, exploiting nanotechnology to serve factory automation and medical device markets. Its revenue stems from niche products detecting magnetic fields and enabling industrial IoT applications. The company’s 2026 strategy centers on advancing spintronic memory licensing and custom sensor development, maintaining leadership in its highly specialized domain with a compact but focused workforce.
Strategic Collision: Similarities & Divergences
Both companies innovate within semiconductors but diverge sharply in scale and scope—Microchip pursues a broad embedded systems approach, while NVE focuses on spintronic nanotech. Their competition lies largely in specialized industrial and IoT segments where sensor and control technologies overlap. Microchip’s diversified portfolio contrasts with NVE’s niche specialization, defining distinct risk and growth profiles for investors in this evolving technology landscape.
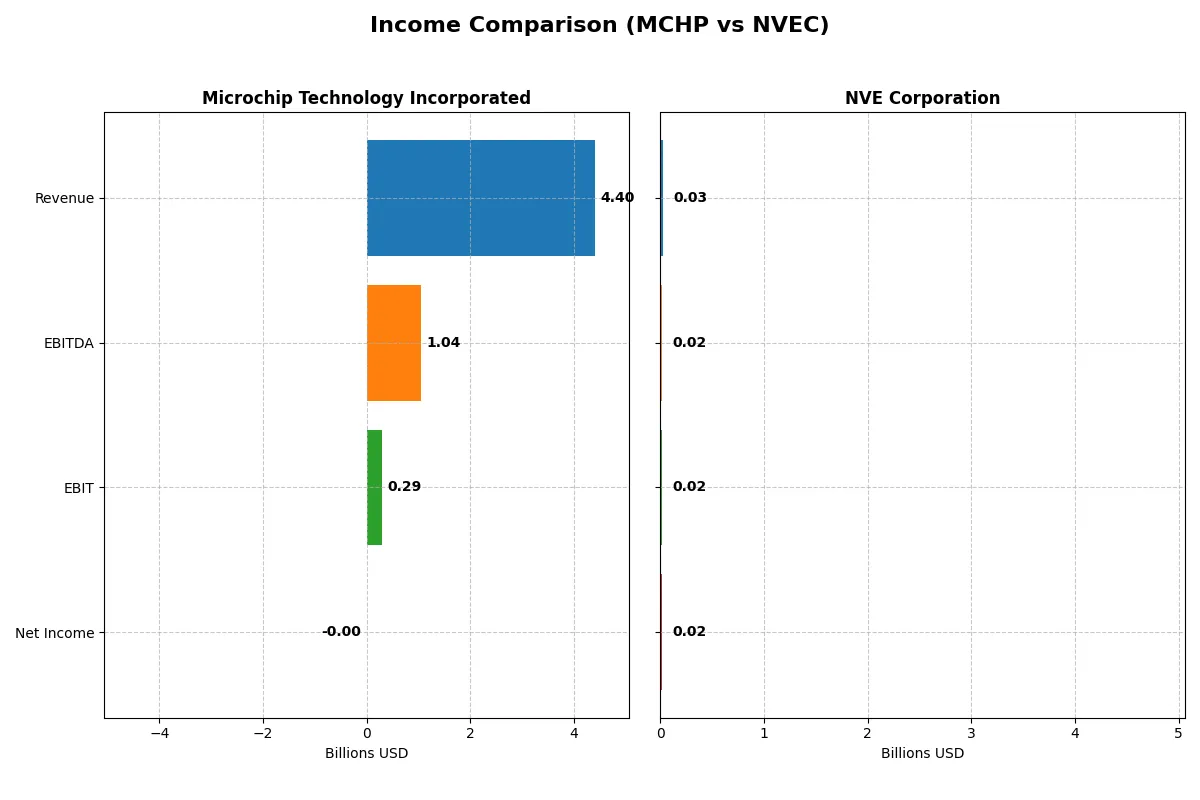
Income Statement Comparison
This data dissects the core profitability and scalability of both corporate engines to reveal who dominates the bottom line:
| Metric | Microchip Technology Incorporated (MCHP) | NVE Corporation (NVEC) |
|---|---|---|
| Revenue | 4.4B | 26M |
| Cost of Revenue | 1.93B | 4.24M |
| Operating Expenses | 2.17B | 5.64M |
| Gross Profit | 2.47B | 21.6M |
| EBITDA | 1.04B | 16.3M |
| EBIT | 290M | 16M |
| Interest Expense | 251M | 0 |
| Net Income | -0.5M | 15.1M |
| EPS | -0.005 | 3.12 |
| Fiscal Year | 2025 | 2025 |
Income Statement Analysis: The Bottom-Line Duel
This income statement comparison reveals which company converts sales into profit most efficiently, highlighting operational strengths and weaknesses.
Microchip Technology Incorporated Analysis
Microchip’s revenue dropped sharply by 42% in 2025, falling from 7.6B in 2024 to 4.4B. Net income swung from a strong 1.9B profit in 2024 to a slight loss in 2025, signaling margin deterioration. Gross margin remains healthy at 56%, but net margin turned negative, reflecting mounting costs and declining profitability momentum.
NVE Corporation Analysis
NVE’s 2025 revenue slipped 13% to 26M from 30M in 2024, a more moderate decline. However, NVE maintains robust profitability with a gross margin of 84% and net margin at 58%, demonstrating excellent cost control and operational leverage. Net income remains strong at 15M, underscoring efficient capital allocation and steady earnings resilience.
Margin Mastery vs. Revenue Volatility
NVE clearly outperforms Microchip in converting revenue into profit, boasting superior margins and consistent net income growth over five years. Conversely, Microchip faces steep revenue and earnings contractions, undermining its income statement health. For investors, NVE’s profile offers stable profitability and margin strength, while Microchip’s recent volatility signals caution.
Financial Ratios Comparison
These vital ratios act as a diagnostic tool to expose the underlying fiscal health, valuation premiums, and capital efficiency of the companies compared below:
| Ratios | Microchip Technology Incorporated (MCHP) | NVE Corporation (NVEC) |
|---|---|---|
| ROE | -0.007% (2025) | 24.19% (2025) |
| ROIC | -0.027% (2025) | 21.14% (2025) |
| P/E | -52,021 (2025) | 20.46 (2025) |
| P/B | 3.67 (2025) | 4.95 (2025) |
| Current Ratio | 2.59 (2025) | 28.40 (2025) |
| Quick Ratio | 1.47 (2025) | 22.03 (2025) |
| D/E | 0.80 (2025) | 0.015 (2025) |
| Debt-to-Assets | 0.37 (2025) | 0.014 (2025) |
| Interest Coverage | 1.18 (2025) | 0 (2025) |
| Asset Turnover | 0.29 (2025) | 0.40 (2025) |
| Fixed Asset Turnover | 3.72 (2025) | 8.91 (2025) |
| Payout Ratio | -1951% (2025) | 128% (2025) |
| Dividend Yield | 3.75% (2025) | 6.28% (2025) |
| Fiscal Year | 2025 | 2025 |
Efficiency & Valuation Duel: The Vital Signs
Financial ratios serve as a company’s DNA, exposing hidden risks and operational strengths critical for sound investment decisions.
Microchip Technology Incorporated
Microchip shows weak profitability with negative ROE and margins, signaling operational struggles. Its valuation appears attractive with a favorable P/E, but a high P/B ratio suggests stretched equity value. The company supports shareholder returns with a solid 3.75% dividend yield, balancing reinvestment in R&D for future growth despite current profitability challenges.
NVE Corporation
NVE delivers strong profitability with a 24.19% ROE and 58.22% net margin, confirming operational efficiency. Its P/E ratio is neutral at 20.46, though a high P/B ratio flags a possible valuation premium. NVE maintains a robust capital structure with minimal debt and offers no dividend, opting instead to reinvest heavily in growth and innovation.
Balanced Profitability vs. Valuation Discipline
NVE outperforms in profitability and balance sheet strength, while Microchip trades at a cheaper valuation with reliable dividends. Investors seeking growth and operational efficiency may favor NVE. Those prioritizing valuation and income might lean toward Microchip’s profile.
Which one offers the Superior Shareholder Reward?
I compare Microchip Technology Incorporated (MCHP) and NVE Corporation (NVEC) in 2026 through their dividend yields, payout ratios, and share buyback intensity. MCHP yields 3.75% but reports a negative net margin recently, raising sustainability concerns. Its dividend payout ratio is erratic, suggesting risk. NVEC offers a robust 6.28% yield, consistently supported by 90%+ free cash flow coverage and minimal debt. NVEC’s buybacks are less visible but its strong cash ratio (6.88) and low leverage sustain dividends better. MCHP’s buyback impact lacks clarity, and its negative earnings undermine returns. I conclude NVEC delivers a more reliable, sustainable total shareholder return in 2026.
Comparative Score Analysis: The Strategic Profile
The radar chart reveals the fundamental DNA and trade-offs of Microchip Technology and NVE Corporation, highlighting their strategic financial strengths and weaknesses:
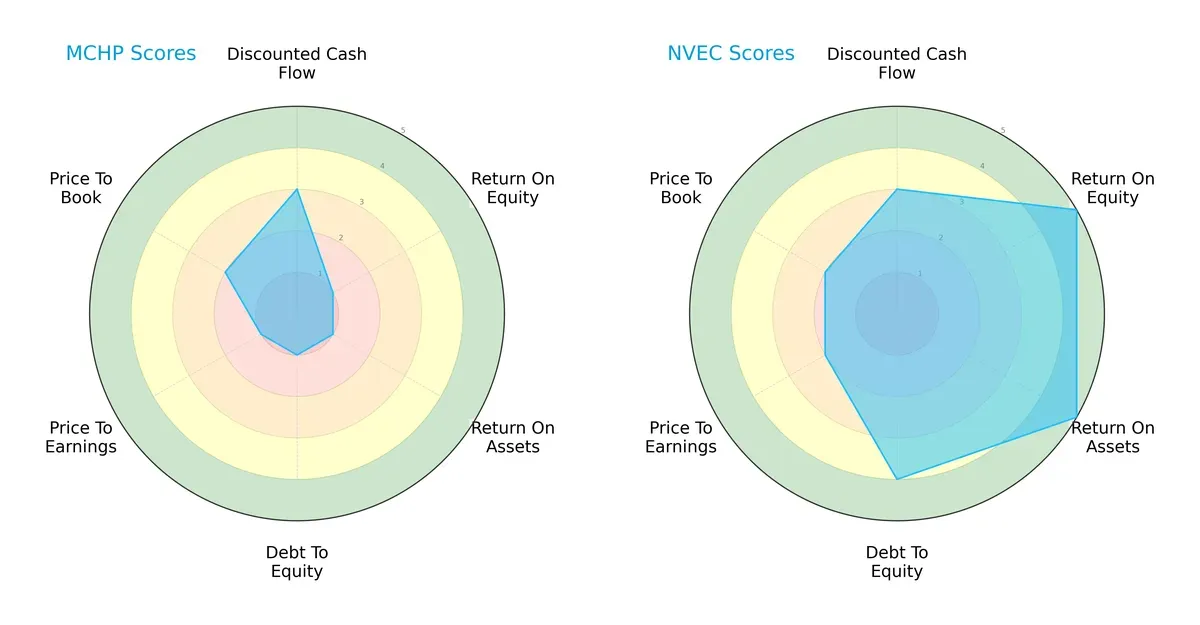
NVE Corporation dominates with superior ROE and ROA scores (5 vs. 1), signaling efficient asset use and profitability. It also boasts a stronger debt-to-equity profile (4 vs. 1), indicating lower financial risk. Microchip Technology shows a moderate DCF score parity but lags in valuation metrics, reflecting imbalanced fundamentals. Overall, NVE presents a well-rounded financial profile; Microchip relies on limited valuation edges.
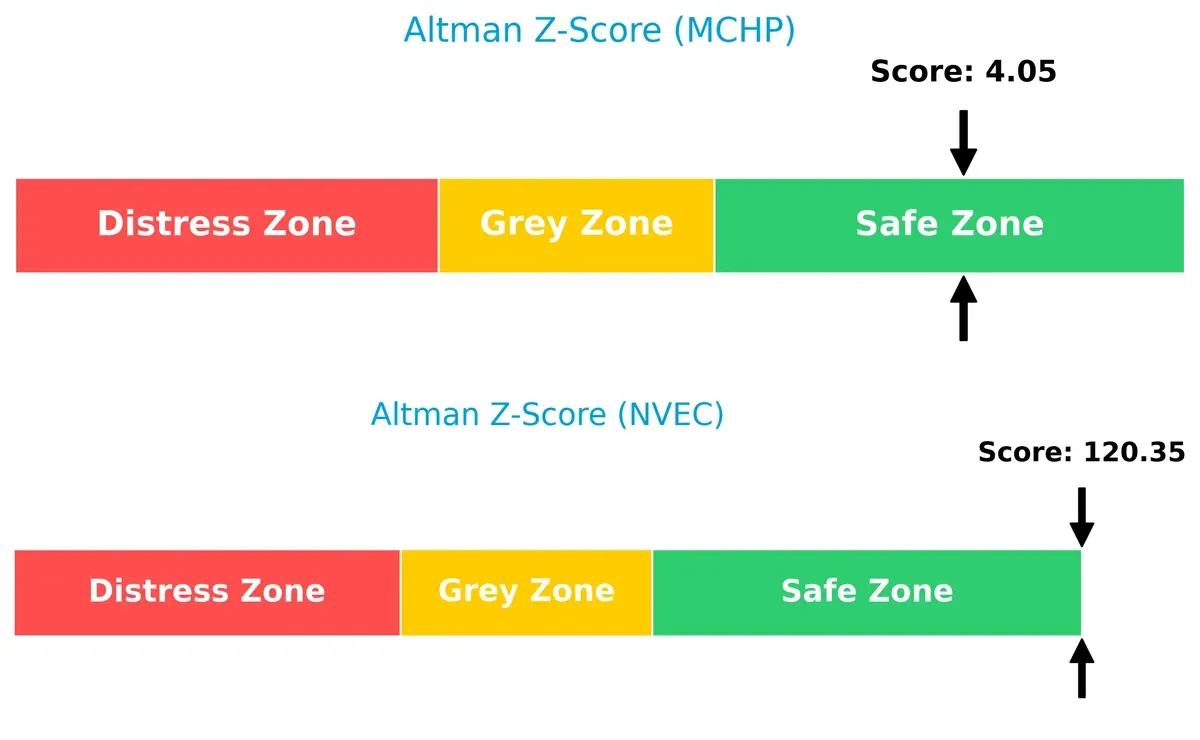
Bankruptcy Risk: Solvency Showdown
NVE’s Altman Z-Score of 120 vastly exceeds Microchip’s 4, both well within the safe zone, signaling robust long-term survival prospects in this cycle:
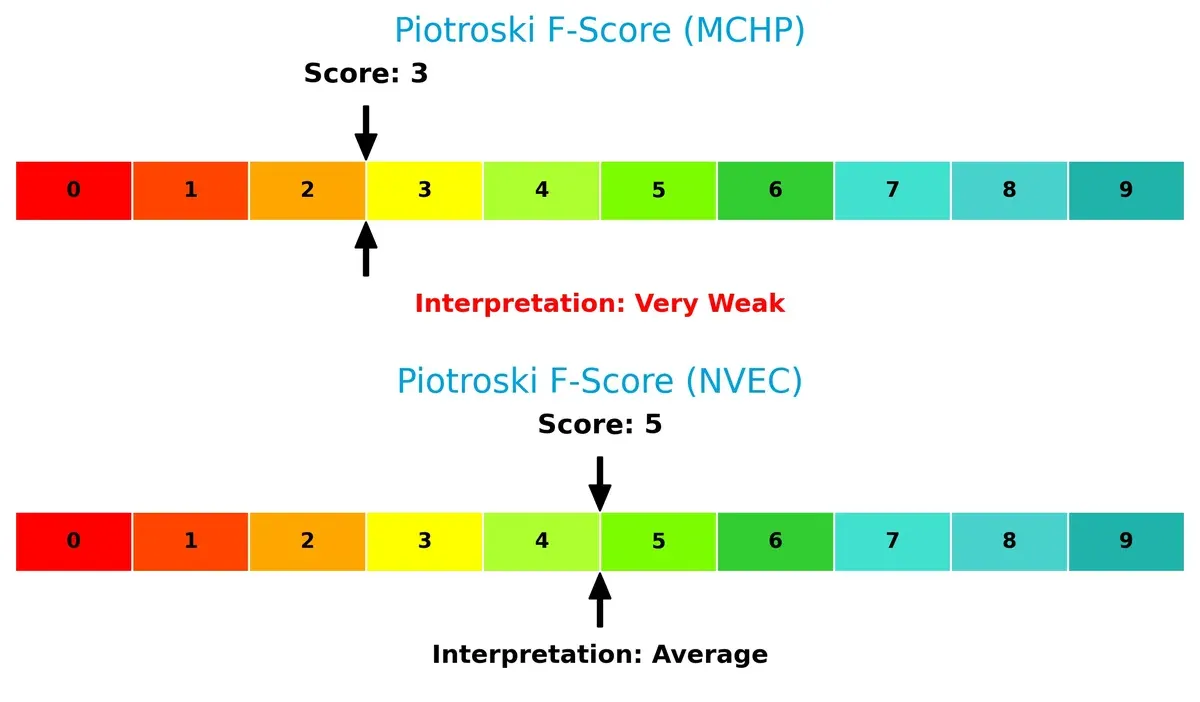
Financial Health: Quality of Operations
NVE’s Piotroski F-Score of 5 surpasses Microchip’s weak 3, indicating healthier internal operations and fewer red flags in profitability, leverage, and liquidity:
How are the two companies positioned?
This section dissects MCHP and NVEC’s operational DNA by comparing revenue distribution and internal dynamics. The goal is to confront their economic moats to identify which business model delivers the most resilient and sustainable competitive advantage today.
Revenue Segmentation: The Strategic Mix
This visual comparison dissects how Microchip Technology Incorporated and NVE Corporation diversify their income streams and where their primary sector bets lie:
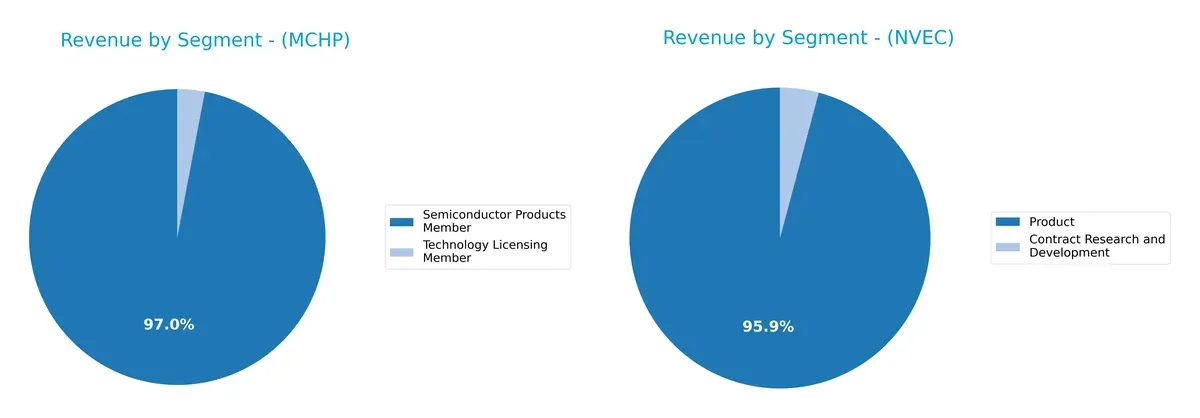
Microchip Technology anchors its revenue with $4.27B from Semiconductor Products, dwarfing its $131M Technology Licensing segment. This signals heavy reliance on semiconductor sales, exposing it to concentration risk but also ecosystem lock-in. Conversely, NVE balances $25.9M in Products with $1.1M in Contract Research, showing a more diversified mix. NVE’s spread suggests strategic flexibility, while Microchip’s dominance reflects its infrastructure power within semiconductors.
Strengths and Weaknesses Comparison
This table compares the Strengths and Weaknesses of Microchip Technology Incorporated and NVE Corporation:
Microchip Technology Incorporated Strengths
- Diverse semiconductor products and technology licensing revenue streams
- Strong current and quick ratios indicate solid liquidity
- Favorable fixed asset turnover and dividend yield
NVE Corporation Strengths
- High profitability with strong net margin, ROE, and ROIC
- Low debt levels and excellent interest coverage
- Robust fixed asset turnover and global revenue diversification
Microchip Technology Incorporated Weaknesses
- Negative profitability metrics: net margin, ROE, and ROIC
- Unfavorable interest coverage and asset turnover
- Price-to-book ratio suggests overvaluation concerns
NVE Corporation Weaknesses
- Unfavorable current ratio signals potential short-term liquidity risk
- Price-to-book ratio is high relative to peers
- Asset turnover remains below typical sector benchmarks
Overall, Microchip shows liquidity strength but struggles with profitability and asset efficiency, signaling challenges in capital allocation. NVE boasts strong profitability and balance sheet health but faces liquidity and valuation pressures, which may influence strategic priorities.
The Moat Duel: Analyzing Competitive Defensibility
A structural moat is the crucial barrier protecting long-term profits from relentless competition erosion. Let’s dissect the moats of two semiconductor players:
Microchip Technology Incorporated: Cost Advantage Under Pressure
Microchip’s moat stems from cost advantages in embedded control solutions, visible in historically solid gross margins. Yet, declining ROIC and shrinking revenues in 2025 signal erosion. New markets and products may struggle to restore its fading competitive edge.
NVE Corporation: Spintronics Innovation with Durable Value Creation
NVE’s moat is anchored in proprietary spintronics technology, delivering exceptional profitability and a growing ROIC. Unlike Microchip, NVE leverages niche innovation, supporting margin expansion and market growth despite recent revenue dips.
Innovation Edge vs. Cost Leadership: NVE’s Moat Runs Deeper
NVE’s strong, rising ROIC and high margins indicate a wider, more sustainable moat than Microchip’s fading cost advantage. NVE is better positioned to defend and expand its market share through cutting-edge technology.
Which stock offers better returns?
Microchip Technology and NVE Corporation stocks showed distinct price movements over the past year, with both experiencing overall declines but recent upward momentum since late 2025.
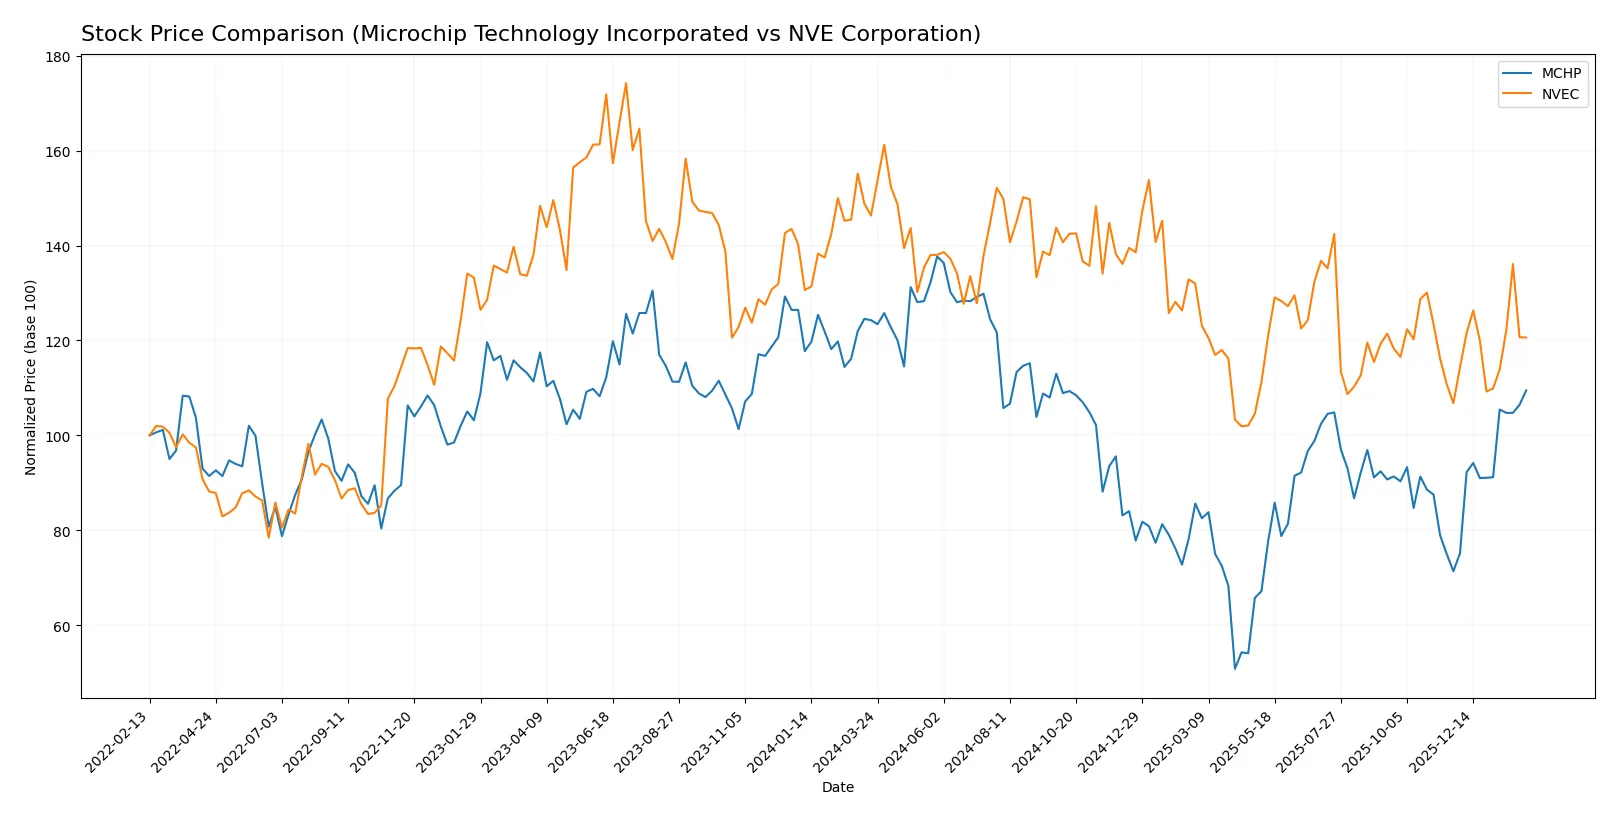
Trend Comparison
Microchip Technology’s stock declined 11.91% over the past 12 months, marking a bearish trend with accelerating downward momentum and high volatility (14.14 std dev). The stock hit a low of 36.22 and a high of 98.23 during this period.
NVE Corporation’s stock fell 17.56% over the same 12 months, also bearish with accelerating decline but lower volatility (7.55 std dev). Its price ranged between 56.99 and 90.18, showing a less volatile but steeper drop than Microchip.
Both stocks reversed recent trends since November 2025, with Microchip surging 53.4% and NVE rising 12.98%. Microchip’s stronger recent recovery delivered the highest market performance overall.
Target Prices
Microchip Technology Incorporated shows a clear analyst target consensus, reflecting optimistic growth expectations.
| Company | Target Low | Target High | Consensus |
|---|---|---|---|
| Microchip Technology Incorporated | 60 | 100 | 82.46 |
Analysts expect Microchip’s stock to appreciate modestly from its current $78.08 price, signaling confidence in its semiconductor market positioning. No verified target price data is available for NVE Corporation.

Don’t Let Luck Decide Your Entry Point
Optimize your entry points with our advanced ProRealTime indicators. You’ll get efficient buy signals with precise price targets for maximum performance. Start outperforming now!
How do institutions grade them?
The institutional grading records for Microchip Technology Incorporated and NVE Corporation are as follows:
Microchip Technology Incorporated Grades
The table below summarizes recent institutional grades for Microchip Technology Incorporated:
| Grading Company | Action | New Grade | Date |
|---|---|---|---|
| Cantor Fitzgerald | Maintain | Overweight | 2026-02-02 |
| UBS | Maintain | Buy | 2026-01-26 |
| Susquehanna | Maintain | Positive | 2026-01-22 |
| B of A Securities | Maintain | Neutral | 2026-01-21 |
| Citigroup | Maintain | Buy | 2026-01-15 |
| Piper Sandler | Maintain | Overweight | 2026-01-15 |
| B. Riley Securities | Maintain | Buy | 2026-01-12 |
| Mizuho | Maintain | Outperform | 2026-01-09 |
| Wells Fargo | Maintain | Equal Weight | 2026-01-07 |
| JP Morgan | Maintain | Overweight | 2026-01-06 |
NVE Corporation Grades
No institutional grades are available for NVE Corporation.
Which company has the best grades?
Microchip Technology Incorporated holds multiple positive grades including Buy and Overweight from reputable firms. NVE Corporation lacks institutional ratings, leaving investors without comparable grade insights. This discrepancy may affect perceptions of market confidence.
Risks specific to each company
The following categories identify the critical pressure points and systemic threats facing both firms in the 2026 market environment:
1. Market & Competition
Microchip Technology Incorporated
- Large market cap (42B) supports scale but faces intense semiconductor industry rivalry.
NVE Corporation
- Small market cap (326M) limits scale but focuses on niche spintronics with less direct competition.
2. Capital Structure & Debt
Microchip Technology Incorporated
- Moderate debt-to-equity (0.8) and debt-to-assets (37%) indicate balanced leverage risk. Interest coverage low at 1.15 signals tight debt servicing capacity.
NVE Corporation
- Extremely low debt-to-equity (0.01) and debt-to-assets (1.4%) show conservative capital structure and strong interest coverage (infinite).
3. Stock Volatility
Microchip Technology Incorporated
- Beta of 1.44 indicates above-market volatility, increasing investment risk during sector swings.
NVE Corporation
- Lower beta of 1.22 suggests more moderate volatility and potentially steadier price action.
4. Regulatory & Legal
Microchip Technology Incorporated
- Operates globally with potential exposure to trade restrictions and semiconductor export controls.
NVE Corporation
- Smaller, US-focused firm with less complex regulatory exposure but sensitive to nanotech-specific approvals.
5. Supply Chain & Operations
Microchip Technology Incorporated
- Complex global supply chain for diverse product lines risks disruption and cost inflation.
NVE Corporation
- Niche product focus likely results in simpler supply chain but higher dependency on specialized suppliers.
6. ESG & Climate Transition
Microchip Technology Incorporated
- Larger footprint implies greater ESG scrutiny and transition risk but also capacity to invest in sustainability.
NVE Corporation
- Smaller scale limits ESG impact but may lack resources to proactively address climate-related risks.
7. Geopolitical Exposure
Microchip Technology Incorporated
- Significant international operations expose it to geopolitical tensions, tariffs, and supply disruptions.
NVE Corporation
- Primarily US-based, reducing direct geopolitical risk but still subject to global market dynamics.
Which company shows a better risk-adjusted profile?
NVE faces lower financial and leverage risks, with a strong Altman Z-score and favorable profitability metrics. Microchip’s larger size brings scale advantages but also higher debt stress and market volatility. NVE’s niche focus and conservative balance sheet create a superior risk-adjusted profile. Microchip’s biggest concern is its weak interest coverage despite industry scale. NVE’s main risk lies in its concentrated product niche. Recent data shows Microchip’s interest coverage barely above 1, a red flag amid semiconductor cyclicality.
Final Verdict: Which stock to choose?
Microchip Technology Incorporated’s superpower lies in its solid liquidity and capital structure, offering a decent dividend yield that appeals to income-focused investors. However, its declining profitability and deteriorating returns on invested capital remain points of vigilance. It fits portfolios aiming for steady income with a tolerance for operational headwinds.
NVE Corporation boasts a durable competitive moat, demonstrated by a robust and growing ROIC well above its cost of capital. Its lean balance sheet and superior profitability create a safety cushion that outperforms Microchip’s risk profile. This stock suits investors seeking growth with a reasonable margin of safety, blending stability and expansion potential.
If you prioritize durable competitive advantages and consistent value creation, NVE Corporation outshines Microchip Technology due to its strong profitability and improving capital efficiency. However, if your strategy leans toward income generation with a tolerance for cyclical dips, Microchip could offer compelling yield opportunities despite its operational challenges.
Disclaimer: Investment carries a risk of loss of initial capital. The past performance is not a reliable indicator of future results. Be sure to understand risks before making an investment decision.
Go Further
I encourage you to read the complete analyses of Microchip Technology Incorporated and NVE Corporation to enhance your investment decisions: