In the fast-evolving semiconductor industry, Microchip Technology Incorporated (MCHP) and Nova Ltd. (NVMI) stand out as innovators with distinct approaches. Microchip focuses on embedded control solutions, while Nova specializes in advanced process control systems for semiconductor manufacturing. Both companies drive key technological advancements, making them compelling for investors seeking exposure to this critical sector. This article will help you determine which company offers the most promising investment opportunity.
Table of contents
Companies Overview
I will begin the comparison between Microchip Technology Incorporated and Nova Ltd. by providing an overview of these two companies and their main differences.
Microchip Technology Incorporated Overview
Microchip Technology Incorporated develops, manufactures, and sells embedded control solutions globally, focusing on microcontrollers, microprocessors, and analog products. It serves diverse sectors including automotive, industrial, and communications with a broad product portfolio spanning from 8-bit to 32-bit microcontrollers and memory products. Founded in 1989 and headquartered in Chandler, Arizona, Microchip holds a strong market position in the semiconductor industry with a market cap of $40.2B.
Nova Ltd. Overview
Nova Ltd. designs and produces process control systems for semiconductor manufacturing, specializing in metrology platforms that measure dimensional, film, and chemical properties for various production steps. Serving integrated circuit manufacturers worldwide, Nova operates primarily in Israel with a workforce of about 1,177 employees. Founded in 1993 and listed on NASDAQ, Nova’s market cap stands at $12.9B, focusing on advanced process control solutions in semiconductor fabrication.
Key similarities and differences
Both Microchip and Nova operate in the semiconductor industry and are listed on NASDAQ, but their business models differ significantly. Microchip provides embedded microcontrollers and analog components used across many industries, while Nova specializes in metrology and process control systems critical to semiconductor manufacturing. Microchip’s broader product range and larger workforce contrast with Nova’s focused niche in semiconductor production equipment.
Income Statement Comparison
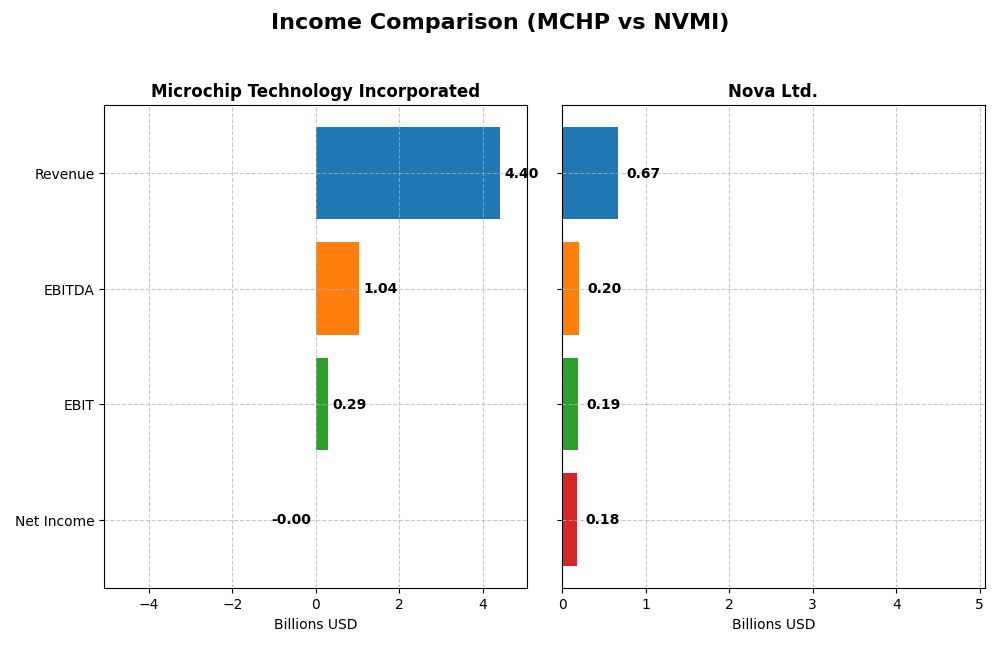
This table provides a clear side-by-side comparison of key income statement metrics for Microchip Technology Incorporated and Nova Ltd. for their most recent fiscal years.
| Metric | Microchip Technology Incorporated | Nova Ltd. |
|---|---|---|
| Market Cap | 40.2B | 12.9B |
| Revenue | 4.40B | 672M |
| EBITDA | 1.04B | 205M |
| EBIT | 290M | 188M |
| Net Income | -0.5M | 184.9M |
| EPS | -0.005 | 6.31 |
| Fiscal Year | 2025 | 2024 |
Income Statement Interpretations
Microchip Technology Incorporated
Microchip’s revenue declined significantly from $8.44B in 2023 to $4.40B in 2025, with net income turning negative to -$0.5M in 2025 after a $2.24B peak in 2023. Gross margin remained relatively stable at 56.07%, but net margin collapsed to nearly zero in 2025. The latest year shows sharp revenue and profitability deterioration, highlighting operational challenges.
Nova Ltd.
Nova’s revenue increased steadily from $269M in 2020 to $672M in 2024, with net income growing from $48M to $184M. Margins improved markedly, with gross margin at 57.57% and net margin at 27.33% in 2024. The latest fiscal year showed strong growth in revenue (29.83%) and earnings per share (34.35%), reflecting solid operational efficiency and market expansion.
Which one has the stronger fundamentals?
Nova Ltd. exhibits stronger fundamentals with consistent revenue and net income growth, favorable margins, and positive earnings momentum over the period. In contrast, Microchip Technology shows declining revenue, collapsing net income, and unfavorable margin trends, suggesting weakened profitability and financial stress. Overall, Nova’s income statement profile is markedly more favorable.
Financial Ratios Comparison
The table below presents a side-by-side comparison of key financial ratios for Microchip Technology Incorporated (MCHP) and Nova Ltd. (NVMI), based on their most recent fiscal year data.
| Ratios | Microchip Technology Incorporated (MCHP) | Nova Ltd. (NVMI) |
|---|---|---|
| ROE | -0.007% | 19.81% |
| ROIC | -0.027% | 13.39% |
| P/E | -52,021 | 31.20 |
| P/B | 3.67 | 6.18 |
| Current Ratio | 2.59 | 2.32 |
| Quick Ratio | 1.47 | 1.92 |
| D/E (Debt to Equity) | 0.80 | 0.25 |
| Debt-to-Assets | 36.85% | 16.98% |
| Interest Coverage | 1.18 | 116.20 |
| Asset Turnover | 0.29 | 0.48 |
| Fixed Asset Turnover | 3.72 | 5.06 |
| Payout Ratio | -1951.4% | 0% |
| Dividend Yield | 3.75% | 0% |
Interpretation of the Ratios
Microchip Technology Incorporated
Microchip’s ratios reveal a mixed picture with several unfavorable indicators such as negative net margin, return on equity, and return on invested capital, suggesting profitability challenges. However, liquidity ratios like the current ratio at 2.59 are favorable, indicating good short-term financial health. The company pays dividends with a solid 3.75% yield, but coverage concerns arise due to weak free cash flow and some risks in sustaining distributions.
Nova Ltd.
Nova Ltd. shows predominantly favorable ratios, including strong net margin at 27.33%, return on equity near 20%, and low debt metrics, reflecting effective profitability and capital management. Liquidity ratios are robust with current and quick ratios above 2, and interest coverage is excellent. The company does not pay dividends, likely prioritizing reinvestment and growth, which aligns with its high valuation and strategic focus.
Which one has the best ratios?
Comparing both, Nova Ltd. demonstrates a higher proportion of favorable ratios (64.29%), stronger profitability, and better debt management, whereas Microchip faces multiple profitability weaknesses and a slightly unfavorable overall ratio assessment. Nova’s absence of dividends suggests growth focus, contrasting with Microchip’s dividend payments amid financial stress, influencing the interpretation of their financial health.
Strategic Positioning
This section compares the strategic positioning of Microchip Technology Incorporated and Nova Ltd., focusing on market position, key segments, and exposure to technological disruption:
Microchip Technology Incorporated
- Large market cap (~40B USD) in semiconductors with competitive pressure from global players.
- Broad semiconductor product portfolio including microcontrollers, analog, and memory products driving revenue.
- Exposure to disruption via embedded systems and licensing technology in microcontrollers and analog products.
Nova Ltd.
- Smaller market cap (~13B USD), specializing in semiconductor process control systems.
- Focused on metrology platforms for semiconductor manufacturing processes.
- Potential disruption risk linked to innovation in semiconductor process control technology.
Microchip Technology Incorporated vs Nova Ltd. Positioning
Microchip has a diversified semiconductor portfolio spanning multiple applications, providing broad business drivers but facing intense competition. Nova is more concentrated on niche metrology systems, potentially limiting scale but focusing on specialized manufacturing processes.
Which has the best competitive advantage?
Based on MOAT evaluation, Microchip shows a very unfavorable moat with declining profitability, while Nova presents a slightly favorable moat with improving ROIC, indicating Nova has a modestly better competitive advantage currently.
Stock Comparison
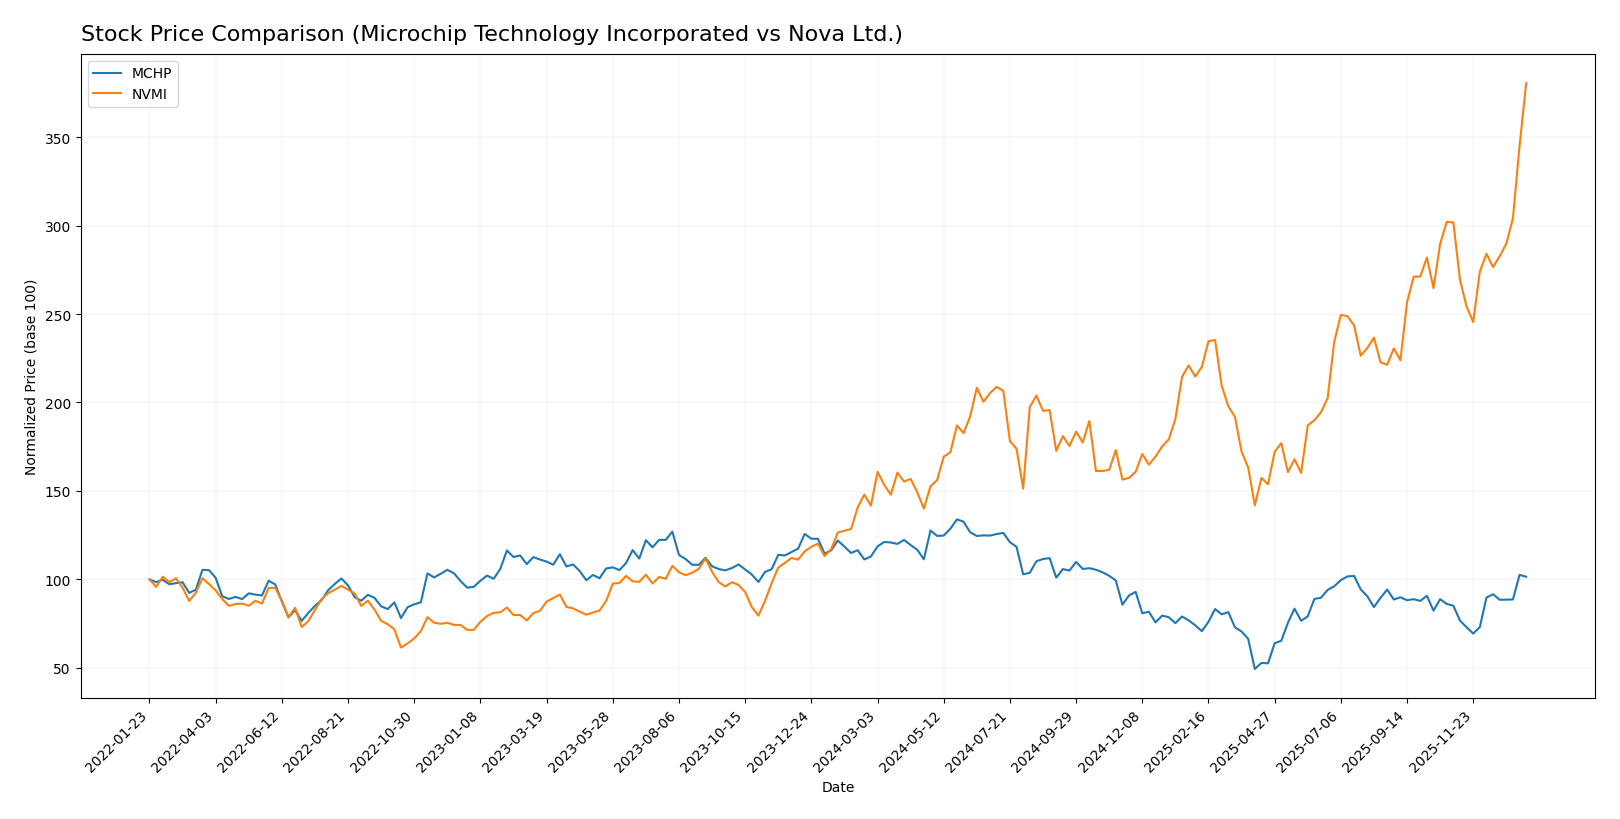
The stock price movements of Microchip Technology Incorporated (MCHP) and Nova Ltd. (NVMI) over the past 12 months reveal contrasting trends, with Microchip showing a bearish trajectory and Nova demonstrating strong bullish momentum.
Trend Analysis
Microchip Technology Incorporated’s stock has experienced a 10.13% decline over the past year, indicating a bearish trend with accelerating downward momentum. The price ranged between 36.22 and 98.23, with volatility measured by a 14.38 standard deviation.
Nova Ltd.’s stock posted a robust 168.54% gain over the past year, reflecting a bullish trend with accelerating growth. Price fluctuations were wider, between 159.92 and 434.55, with a high standard deviation of 55.86 indicating significant volatility.
Comparing these trends, Nova Ltd. delivered the highest market performance with substantial gains and accelerating momentum, while Microchip Technology showed a declining trend despite recent short-term recovery.
Target Prices
The consensus target prices from verified analysts indicate promising upside potential for these semiconductor companies.
| Company | Target High | Target Low | Consensus |
|---|---|---|---|
| Microchip Technology Incorporated | 85 | 60 | 77.44 |
| Nova Ltd. | 390 | 335 | 362.5 |
Analysts expect Microchip Technology’s price to rise moderately above its current $74.45, while Nova Ltd.’s target consensus suggests a notable discount compared to its current $434.55 stock price.
Analyst Opinions Comparison
This section compares analysts’ ratings and grades for Microchip Technology Incorporated and Nova Ltd.:
Rating Comparison
MCHP Rating
- Rating: C-, rated as Very Favorable overall by analysts.
- Discounted Cash Flow Score: Moderate with a score of 3.
- ROE Score: Very Unfavorable, low efficiency in generating profit.
- ROA Score: Very Unfavorable, poor asset utilization.
- Debt To Equity Score: Very Unfavorable, indicating higher financial risk.
- Overall Score: Very Unfavorable, with a score of 1.
NVMI Rating
- Rating: B-, rated as Very Favorable overall by analysts.
- Discounted Cash Flow Score: Moderate with a score of 3.
- ROE Score: Favorable, demonstrating strong profit generation.
- ROA Score: Very Favorable, excellent asset utilization.
- Debt To Equity Score: Very Unfavorable, showing significant financial risk.
- Overall Score: Moderate, with a score of 3.
Which one is the best rated?
Based strictly on the data, Nova Ltd. holds a better overall rating (B-) and outperforms Microchip Technology in ROE, ROA, and overall score. However, both face challenges with debt-to-equity metrics.
Scores Comparison
The scores comparison between Microchip Technology Incorporated and Nova Ltd. highlights their financial health and bankruptcy risk:
MCHP Scores
- Altman Z-Score of 4.00 indicates a safe financial zone.
- Piotroski Score of 3 signals very weak financial strength.
NVMI Scores
- Altman Z-Score of 7.76 indicates a safe financial zone.
- Piotroski Score of 7 signals strong financial strength.
Which company has the best scores?
Based strictly on the provided data, NVMI has the best scores with a higher Altman Z-Score indicating lower bankruptcy risk and a strong Piotroski Score versus MCHP’s very weak Piotroski rating.
Grades Comparison
Here is a detailed comparison of the latest grades assigned by reputable grading companies to the two companies:
Microchip Technology Incorporated Grades
This table summarizes recent grades and rating actions from leading financial institutions for Microchip Technology Incorporated:
| Grading Company | Action | New Grade | Date |
|---|---|---|---|
| Piper Sandler | Maintain | Overweight | 2026-01-15 |
| B. Riley Securities | Maintain | Buy | 2026-01-12 |
| Mizuho | Maintain | Outperform | 2026-01-09 |
| Wells Fargo | Maintain | Equal Weight | 2026-01-07 |
| JP Morgan | Maintain | Overweight | 2026-01-06 |
| Morgan Stanley | Maintain | Equal Weight | 2026-01-06 |
| Stifel | Maintain | Buy | 2026-01-06 |
| Rosenblatt | Maintain | Buy | 2026-01-06 |
| Needham | Maintain | Buy | 2026-01-06 |
| Cantor Fitzgerald | Upgrade | Overweight | 2025-12-16 |
Overall, Microchip Technology Incorporated’s grades show a consistent buy or overweight trend with no downgrades, reflecting stable positive sentiment.
Nova Ltd. Grades
This table outlines recent grades and rating decisions by recognized grading firms for Nova Ltd.:
| Grading Company | Action | New Grade | Date |
|---|---|---|---|
| B of A Securities | Maintain | Buy | 2026-01-13 |
| Jefferies | Maintain | Buy | 2025-12-15 |
| Evercore ISI Group | Maintain | Outperform | 2025-11-07 |
| Benchmark | Maintain | Buy | 2025-11-07 |
| Cantor Fitzgerald | Maintain | Overweight | 2025-06-24 |
| B of A Securities | Maintain | Buy | 2025-06-24 |
| Benchmark | Maintain | Buy | 2025-05-09 |
| Citigroup | Maintain | Buy | 2025-05-09 |
| B of A Securities | Maintain | Buy | 2025-04-16 |
| Cantor Fitzgerald | Maintain | Overweight | 2025-03-14 |
Nova Ltd.’s grades predominantly reflect a buy consensus with consistent maintenance of positive ratings over time, indicating steady investor confidence.
Which company has the best grades?
Both Microchip Technology Incorporated and Nova Ltd. have strong buy-side support from reputable grading companies. Microchip shows a slightly broader range of buy and overweight ratings, with recent upgrades, while Nova maintains a solid buy consensus without upgrades. This suggests investors may view Microchip’s outlook as marginally more favorable, potentially impacting portfolio allocation decisions.
Strengths and Weaknesses
The table below summarizes key strengths and weaknesses of Microchip Technology Incorporated (MCHP) and Nova Ltd. (NVMI) based on their diversification, profitability, innovation, global presence, and market share.
| Criterion | Microchip Technology Incorporated (MCHP) | Nova Ltd. (NVMI) |
|---|---|---|
| Diversification | Moderate: Primarily semiconductor products with a small tech licensing segment | Low: Revenue mainly from a single product line |
| Profitability | Weak: Negative net margin and ROIC, value destroying with declining profitability | Strong: High net margin (27%), growing ROIC, value creating |
| Innovation | Limited recent growth; declining ROIC suggests challenges in innovation impact | Positive: Growing ROIC indicates improving innovation and operational efficiency |
| Global presence | Established global semiconductor player, but facing profitability pressures | Smaller scale with focused niche, less diversified global footprint |
| Market Share | Large semiconductor market share but declining financial health | Smaller market presence but improving financial metrics |
Key takeaways: MCHP shows established scale but struggles with profitability and value creation, signaling caution. NVMI, while smaller and less diversified, demonstrates strong profitability and improving competitive positioning, suggesting a more favorable outlook for investors seeking growth with manageable risk.
Risk Analysis
Below is a comparative table highlighting key risks for Microchip Technology Incorporated (MCHP) and Nova Ltd. (NVMI) based on the most recent data available in 2026:
| Metric | Microchip Technology Incorporated (MCHP) | Nova Ltd. (NVMI) |
|---|---|---|
| Market Risk | High beta (1.445) indicates elevated volatility in tech sector | Higher beta (1.832) suggests even greater sensitivity to market swings |
| Debt level | Moderate debt-to-equity ratio (0.8), interest coverage low (1.15) | Low debt-to-equity (0.25), strong interest coverage (116.2) |
| Regulatory Risk | US-based, exposed to semiconductor export controls and IP regulations | Israeli HQ, subject to complex international trade and export laws |
| Operational Risk | Large global manufacturing footprint with supply chain vulnerabilities | Smaller scale, but reliance on precision metrology could pose risks if tech advances shift |
| Environmental Risk | Moderate, with semiconductor manufacturing environmental standards tightening | Moderate, with process control systems requiring compliance with environmental regulations |
| Geopolitical Risk | US-China tensions affecting semiconductor supply chains | Exposure to Middle East geopolitical instability impacting operations |
In summary, MCHP’s risks are heightened by its moderate leverage and weaker interest coverage, combined with supply chain and regulatory exposures. NVMI’s main concerns stem from geopolitical risks and market volatility but benefits from stronger financial stability and operational focus. Market risk is the most impactful for both due to their high betas in a volatile tech environment.
Which Stock to Choose?
Microchip Technology Incorporated (MCHP) shows a declining income trend with a -42.35% revenue drop in the last year and unfavorable profitability ratios, including negative net margin and ROE. Its debt level is moderate, but financial ratios are slightly unfavorable, and the overall rating is very unfavorable.
Nova Ltd. (NVMI) demonstrates strong income growth of 29.83% last year, with favorable profitability metrics such as a 27.33% net margin and robust ROE. It maintains low debt with favorable leverage ratios, a mostly favorable financial ratio profile, and a moderate overall rating.
For investors seeking growth and improving profitability, Nova Ltd. might appear more favorable given its positive income evolution, stronger financial ratios, and better rating. Conversely, risk-averse profiles prioritizing stability may find Microchip’s moderate debt and current ratios worth monitoring despite its declining profitability and unfavorable valuation metrics.
Disclaimer: Investment carries a risk of loss of initial capital. The past performance is not a reliable indicator of future results. Be sure to understand risks before making an investment decision.
Go Further
I encourage you to read the complete analyses of Microchip Technology Incorporated and Nova Ltd. to enhance your investment decisions: